Post PCE thoughts.PCE data in line with expectations, personal income and spending slightly up, all in all, when I saw the data, I felt it would potentially be good for the S&P and also the USD. But both the S&P and the USD are nonplussed.
The GBP has positive momentum, but it's not something I can hang my hat on while the rest of the currencies are behaving incoherently. All in all, i'd like to place a risk on trade, but I don't have conviction in the direction of the currencies over the next few hours.
Which means I'll close the book on a week of only trade, which stopped out. Mildly disappointing but I look forward to the new week.
Weekly Review and currency overview to follow. Wishing you a lovely weekend.
Trade ideas
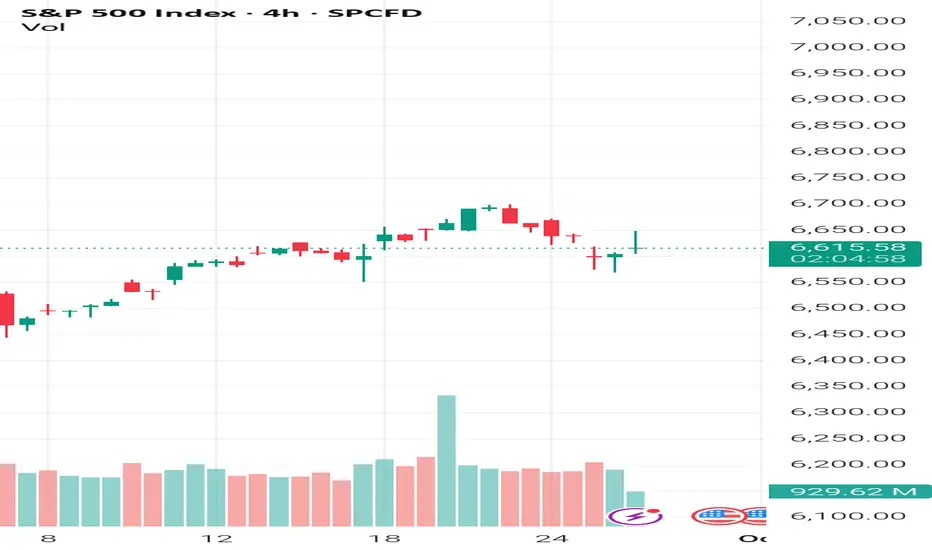
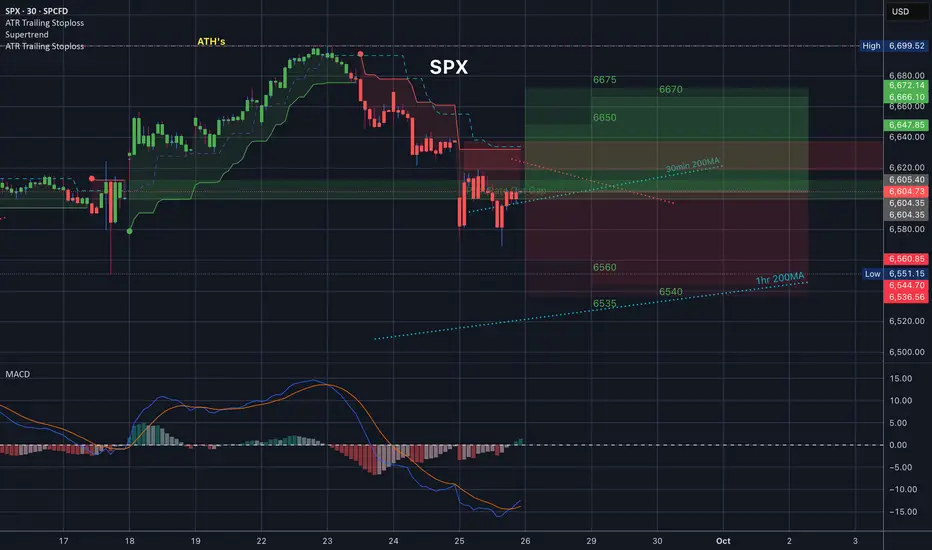
SPX .Bullish pattern/short termNeed to watch for failed signals/upside and maybe we even get a failed pattern and a dump.Lets see
SPX into the open.Friday 26th SeptemberRecoiling after an oversold sell off.Looks like it might test that downtrend.lets see what happens
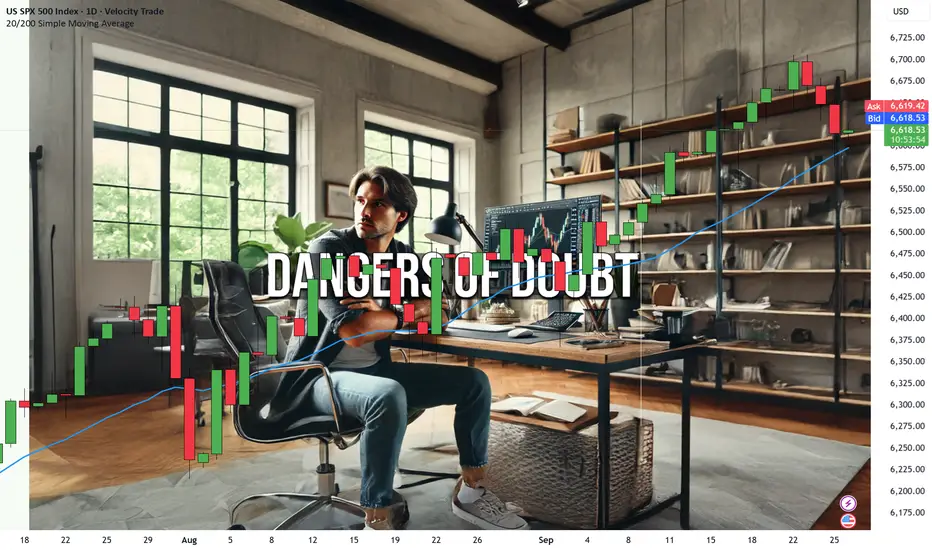
3 Dangers of Trading DOUBTDoubt.
It’s that little idiot in your head that whispers,
“What if you’re wrong?” or “Maybe this isn’t for you.”
It’s what stops you from achieving greatness.
It’s what keeps you in uncomfortable “comfort zones”
It’s what keeps you with the herd mentality of not doing anything.
And with trading, it’s the most dangerous trait to derail your hard earned work and progress.
Let’s stop the doubt and conquer those demons.
#1: DOUBT leads to Missed Opportunities
Have you ever hesitated on taking a trade?
Have you ever doubted your trading system?
Have you ever doubted your process?
Yep, that’s doubt working its dark magic.
Doubt makes you second-guess your analysis. It causes you to miss golden opportunities.
I am a big believer of risking money per trade in a way that it feels like pennies.
So whether it be 2%, 1% or even 0.5%.
Just think about this…
What do you have to lose? Very little right?
And whether you’re trading the JSE, Dow Futures or gold – you can manage your risk.
So, you might as well go ahead and risk little to make a little bit more.
The doubt might be there, but when you find that you’re taking the trades and winning and growing your portfolio more often than not – Doubt will disappear.
#2: DOUBT makes you Lose Confidence
Doubt and confidence are mortal enemies in life and with trading.
When doubt sets in, it gnaws away at your self-belief.
All of a sudden, you’re not just doubting your trades; you’re doubting yourself. And this destroys your integrity as a person.
And in trading, confidence is key.
Confidence is what will take you into battle with a plan and knowing how to protect yourself.
It allows you to execute trades with precision, even when there is a touch of uncertainty.
Doubt is like instead of grabbing a sword, you grab a feather duster.
So you need to learn how to build and maintain confidence in your trading.
How do you do that? Celebrate your performance, winning streaks, manage your losses and keep at it.
Doubt might try to shake your confidence, but resilience will keep you standing tall.
#3: DOUBT will lead you to change your System
Doubt doesn’t just mess with your mind; it messes with your system.
You start adding and removing elements.
You start changing and acting more on a discretionary manner.
When you start doubting your strategy, you’re tempted to tweak, tinker, and completely overhaul your approach.
These changes will make you feel like you’re back to the start of your journey.
And the inconsistency, doubt and confusion will manifest into another losing strategy.
Your trading system is your blueprint for success.
It’s built on research, experience, and fine-tuning.
But when doubt infiltrates, it can cause you to question the very foundation of your strategy.
Before you know it, you won’t even have a strategy anymore.
You’ll just act on impulsive trades. And this is one of the MAIN reasons traders blow their accounts.
Patience, Passion and Persistence are the keys to SUCCESS.
FINAL WORDS:
You now have the power to overcome doubt.
Save this article, print it and let’s stop doubting.
Missed Opportunities:
Doubt makes you hesitate and miss out on profitable trades.
Loss in Confidence:
Doubt erodes your self-belief, making you hesitant and indecisive.
Alter in Your Current Trading System:
Doubt leads to impulsive changes, disrupting your trading strategy.
Remember, every trader faces doubt.
It’s how you handle it that sets you apart.
Embrace confidence, trust your system, and watch your trading soar.
SPX500 – Markets Brace for GDP and PCE-Driven VolatilitySPX500 – Overview
More Fedspeak, More Questions
Wall Street points to a soft opening on Thursday as investors digest Fed Chair Jerome Powell’s caution on stretched equity valuations, a warning that injected a note of restraint after this year’s strong market rally.
Traders are bracing for high volatility, with a heavy lineup of Fed speakers today and key U.S. data releases ahead: the final estimate of Q2 GDP later today and the PCE inflation report tomorrow.
Stronger-than-expected GDP could dampen rate-cut expectations and pressure equities, while weaker data would support a more dovish outlook.
Technical View
The SPX500 remains in a range-bound setup, awaiting a catalyst for the next directional breakout.
Bearish Scenario:
A confirmed 1H close below 6,634 would signal a downside break, targeting 6,597 → 6,577.
Negative sentiment could accelerate if GDP prints stronger than expected, reinforcing a bearish bias.
Bullish Scenario:
Stability above 6,635 keeps price consolidating between 6,635 – 6,663.
A confirmed 1H close above 6,663 would trigger bullish momentum toward 6,698.
Key Levels
Pivot: 6,635
Resistance: 6,663 – 6,698
Support: 6,615 – 6,598 – 6,577
The SPX500 is poised for data-driven volatility. Watch GDP and PCE prints for a breakout cue:
Strong GDP → bearish break below 6,634.
Softer data → bullish breakout above 6,663.

Powell cutting rates? But why would he?📉 Powell cutting rates? 100% priced in. Even talk of 1–2% slashes. But why would he?
Let’s look at what the media ignores:
🇮🇳 Reports suggest India plans to cut its US Treasury holdings by up to 50% by 2025. That could mean roughly $450B hitting the market. Who’s going to buy that debt? The Fed? They’re already running negative equity — something that would be called insolvency for any private company.
Lowering rates would allow the US government (and its billionaire buddies) to borrow even more cheap money — not to fix the economy, but to speculate, pump Bitcoin, and trash the dollar further. Inflation? Even worse.
The US economy shows all the symptoms of a recession: layoffs rising, real wages falling, manufacturing shrinking. Official GDP numbers still look positive, but let’s not forget those “revisions” that always come later. Translation: the data is constantly massaged.
So what’s the real goal? Probably to juice the housing market. But let’s be honest: US mortgage rates today are just average by historical standards. Russia’s rates are higher, yet their currency and balance sheet look healthier because they don’t live off endless money printing.
The core problem is clear: reckless dollar printing to protect billionaire portfolios. And Powell? If he truly had conviction, he wouldn’t touch the rate at all.

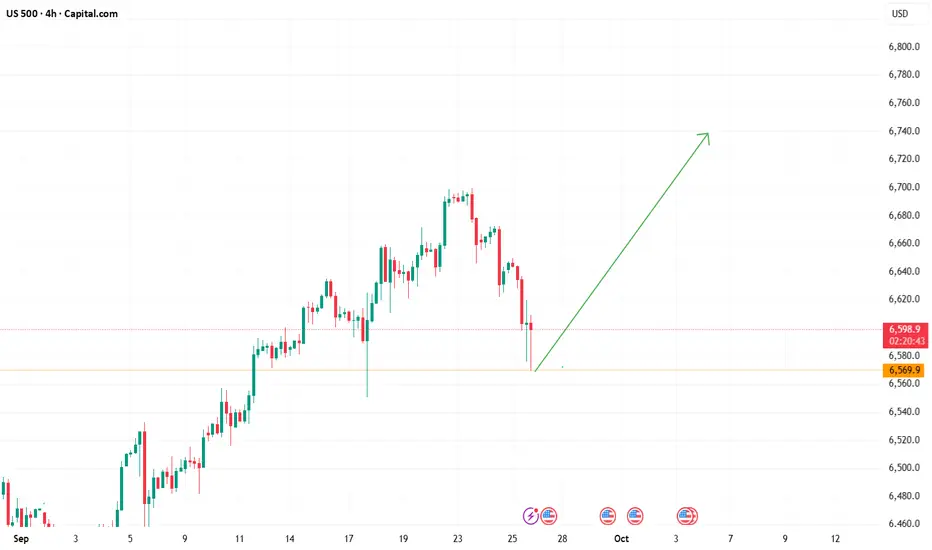
BullThis is not the time for weak bull hands. Despite this weeks dump we'll finish near 662-663 tomorrow.

$SPX Tomorrow’s Trading Range 9.26.25
This is tomorrow’s trading range for SPX - Look at that Island gap in the upper part. What do you think? End of the rally?
Rates were cut, equities are overvalued and it’s time to reverse this beast. Just my opinion - trade the chart not my opinion.
S&P 500 (SPX) Daily Technical & Macro Outlook🔎 S&P 500 (SPX) Daily Technical & Macro Outlook
🖼 Chart Technicals
Price closed 6600.97 (-0.10%), showing hesitation at a key fib confluence zone.
Breakdown from the short-term rising channel is confirmed with the red rejection wick.
Current price is testing the 0.786 fib (6627) and flirting with 0.702 (6599).
Key supports: 6570 (highlighted in yellow) and 6440.
Resistance overhead: 6699 (Fib 1) → 6808 (1.618 extension).
⚠️ The highlighted circle zone (crossing trend lines) suggests a decision point—either reclaim trend support or fail into deeper retracement.
🌍 Macro Environment & Catalysts
Fed policy & rate expectations: Recent inflation prints remain sticky; Powell comments could tilt the market either way.
U.S. fiscal situation: Government funding and deficit concerns add background risk.
Oil & commodities: Rising crude keeps inflation fears alive → bearish for equities.
Earnings season (upcoming Q3): Tech leaders will dictate momentum. Strong guidance = bullish recovery; misses = accelerated downside.
Global geopolitics: War threats and tariff disputes (e.g., U.S.–China tech rivalry) remain volatility triggers.
📊 Probability Outlook
Bullish case (40%)
Buyers defend 6570–6599 support zone.
Bounce could retest 6699, with breakout extension to 6807–6907.
Macro tailwind: Dovish Fed pivot or strong earnings beats.
Bearish case (60%)
Failure to hold 6570 = accelerated drop to 6440, then 6234.
Momentum shift shows sellers reclaiming control after a steep summer rally.
Macro headwind: Hot CPI/PCE data or Fed reasserting higher-for-longer stance.
🎯 Trade Alignment with Macro (Max Profit Setup)
Directional Bias: Short-term bearish unless 6699 is reclaimed.
Trade Idea (Options Swing):
Bearish put spread: Buy SPX 6570 puts, sell 6400 puts (3–4 weeks out).
Defined risk, profit zone aligns with 6440/6234 fib confluence.
High RR if macro bearish catalysts hit (CPI, Fed hawkish tone).
Hedge (Upside Risk): Small OTM calls at, 6800 can protect against squeeze.
📝 Final Take
SPX sits at a macro crossroads: holding above, 6570 keeps the bull case alive, but momentum favors downside. Traders should prepare for volatility into macro events, with 6570 → 6440 as a high-probability retracement path.
⚡️In summary: Until bulls reclaim 6699, the market leans bearish. Options spreads provide the best way to capture macro-driven swings while limiting risk.

SPX500 Bearish Breakout!
HI,Traders !
#SPX500 made a bearish
Breakout of the rising support
Line and we are bearish biased
Therefore, after retesting the sell cluster area
at 6643.11 So we will be expecting a Further
bearish move down !
Comment and subscribe to help us grow !

SPX is absolute in the garbage now! Great inverse playI've been saying this for a few weeks now and all those who bought at the top are now official bag holders. There's a lot more bleeding that will happen. First, SMA9 crossed (check), next we'll see aggressive drop crossing SMA50, maybe some consolidation, and if it drops below SMA200, we're in for some interesting times. Don't stress, here's your play.....check out CBOE:UVIX , CBOE:MSTZ for inverse plays. There's still some nice upside. When they say, don't sell, you sell otherwise you'll be exit liquidity! I've seen this way too many times. Best of luck!
Pull back tease, but still bearing SPX!There's a bit of a pull back taking place, but I'm not buying it! There's a lot of f&ckery taking place and no lipstick will make this pig look pretty. Fundamentals are weak and volatility is spiking, long overdue! Nice inverse plays CBOE:UVIX CBOE:MSTZ

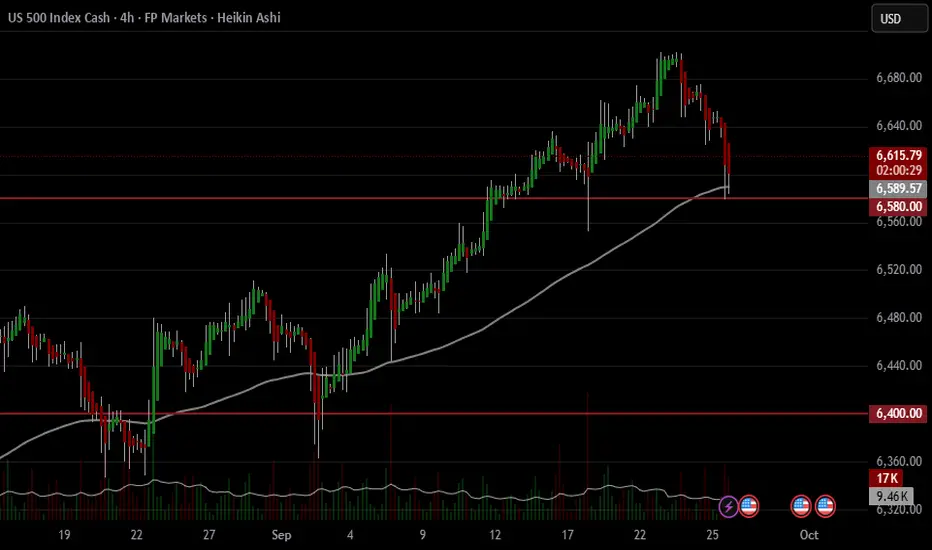
US500 Rally end?The S&P 500 is at a key moment right now, testing the 6580 support area after a sharp pullback from recent highs.
In my view, if this level breaks decisively with strong selling pressure, the market could head toward the 6400 zone, which has acted as an important support area in the past.
As long as 6580 holds, a bounce is still possible, but for now the risk seems tilted to the downside if we see a clear breakdown.
NOT FINANCIAL ADVICE.
Comment below with the ticker you’d like me to analyze next!
And don’t forget to leave a boost if you’d like to see more trading ideas like this :)
SPX frothy watersWe are currently operating firmly within the 4–5 range of several market cycles — a pattern that appears to be repeating consistently. Under such conditions, a prudent strategy is to remain mostly inactive, engaging only in limited, low-risk trades. Favor small positions, selling into strength and buying into weakness — in essence, "sell high, buy low."
Attempting to chase uptrends or buy into rallies while selling during minor corrections is likely to result in premature stop-outs, effectively eroding the gains accumulated thus far. The risk of giving back profits is elevated in this phase of the cycle.
A more significant pullback or structural correction is not expected until sometime after the first quarter of next year. Until then, restraint and precision are paramount.

S&P500 corrective pullback Recent moves: The S&P 500 (-0.36%) extended losses, still weighed by the AI-driven selloff earlier in the week. Futures have recovered about half of yesterday’s drop, but overall momentum looks paused.
Macro drivers:
US housing data + firmer oil prices dampened expectations for rapid Fed rate cuts.
This pushed Treasury yields higher, with a fresh steepening of the curve. 10yr yields are back near pre-payrolls levels (+10–15bps since the FOMC).
Today’s jobless claims are key after last week’s sharp drop, with tomorrow’s core PCE the bigger risk event.
Politics:
US government shutdown risks escalated, with the White House ordering contingency firings if funding lapses. Market anxiety may rise as deadlines loom.
Geopolitics in focus: Erdogan’s White House visit could bring defense deals (Boeing, Lockheed Martin) and NATO tensions remain over Russia.
Implication for S&P 500 trading:
Near-term tone is cautious, with yields back up and Fed easing hopes questioned.
Watch jobless claims for confirmation of labor resilience and core PCE tomorrow as the next major directional driver.
Shutdown risks add headline volatility, while defense sector stocks could outperform if US–Turkey talks deliver aircraft orders.
Key Support and Resistance Levels
Resistance Level 1: 6670
Resistance Level 2: 6700
Resistance Level 3: 6747
Support Level 1: 6550
Support Level 2: 6530
Support Level 3: 6500
This communication is for informational purposes only and should not be viewed as any form of recommendation as to a particular course of action or as investment advice. It is not intended as an offer or solicitation for the purchase or sale of any financial instrument or as an official confirmation of any transaction. Opinions, estimates and assumptions expressed herein are made as of the date of this communication and are subject to change without notice. This communication has been prepared based upon information, including market prices, data and other information, believed to be reliable; however, Trade Nation does not warrant its completeness or accuracy. All market prices and market data contained in or attached to this communication are indicative and subject to change without notice.


Still going up for SPX500USDHi traders,
I show you week after week what price will do. If you follow my outlooks, you've made a lot of profit.
For example SPX500USD played out exactly as predicted in my previous outlook. After a sharp correction it continued the upmove and made a new ATH.
Now next week we could see a little more upside and a bigger correction down for (orange) wave 4.
Let's see what the market does and react.
Trade idea: Wait for a small pullback and a change in orderflow to bullish on a lower timeframe to trade longs.
If you want to learn more about trading FVG's & liquidity sweeps with Elliott wavecount and patterns, then please make sure to follow me.
This shared post is only my point of view on what could be the next move in this pair based on my technical analysis.
Don't be emotional, just trade your plan!
Eduwave

Hellena | SPX500 (4H): SHORT to support area of 6550.Colleagues, I am not much of a correction trader, but I have to share my opinion that the upward impulse has almost formed wave “5” and now it would still be logical to expect a correction.
I believe that first the price will update the local maximum in the resistance area of 6759, then we will see a correction in wave “4”, which I expect to see at least in the support area of 6550.
Manage your capital correctly and competently! Only enter trades based on reliable patterns!

S&P 500: Pullback after flash dump is a Short opportunity
📝 1. Market Context
BLUEBERRY:SP500 recently witnessed a sharp drop from 6,698 down to 6,645, showing clear bearish momentum. After this fall, the index attempted a recovery, but the bounce was weak: green candles became smaller and stalled right at key resistance zones. A long red bearish engulfing candle then erased the entire recovery, proving sellers are back in control.
🟥 2. Static Resistance (Red Zone on Chart)
On the chart, the red zone represents static resistance, located around 6,671 – 6,664.62. This area aligns with:
• Dynamic resistance (moving averages).
• Static resistance (previous supply zone).
Every time price has tested this area, it faced rejection. This makes the red zone a high-probability level for sellers to step in again if price retests it.
🟩 3. Support Zone (Green Zone on Chart)
The nearest support lies at 6,639, highlighted as the green zone on the chart. This is the first logical downside target, where price might pause or react before choosing the next move.
🎯 4. Bearish Scenario
• Bias: Bearish continuation.
• Entry zone: 6,671 – 6,664.62 (red resistance zone).
• Target: 6,639 (blue support zone).
• Invalidation: If price closes firmly above 6,672, this bearish idea is no longer valid.
✅ 5. Summary
After a sharp decline, the weak bounce into resistance looks like an opportunity for sellers. As long as the index remains below the red resistance zone, the path of least resistance points lower, with 6,639 as the next key support to watch.
📈 Similar to the previous Buy setup, we can see that price is reacting in a similar manner — it touches the static support zone (marked in green) and the moving average (acting as dynamic resistance), before making a strong bounce.
Please like and comment below to support our traders. Your reactions will motivate us to do more analysis in the future 🙏✨

S&P500: Flash dump continues, short bias remains!
📝 1. Market Context
BLUEBERRY:SP500 Yesterday’s analysis highlighted the weakness after the market failed at resistance. Today, that scenario was confirmed with a flash dump and a sequence of strong red candles, signaling sellers remain firmly in control. The short-term structure continues to print lower highs and lower lows, which clearly reflects the dominance of the bearish trend.
🟥 2. Resistance Zone
The 6,651 – 6,658 area (red zone on the chart) continues to act as a critical resistance. This zone is reinforced by 4 levels of resistance combined with moving averages (MA). Moreover, the latest bounce is still contained within a large red candle, signaling that buyers lack the strength to shift momentum.
Each time price tested this zone, it faced strong rejection. As long as the market trades below this red zone, the dominant trend remains bearish.
📉 3. Bearish Trend & Downside Targets
Currently, the market has confirmed the bearish trend by consistently forming lower highs. This is already the third bearish leg since the downtrend began – and according to wave logic, the third leg often turns out to be the strongest one, provided resistance at 6,658 holds.
• Immediate target: 6,629 – 6,615 (a key support cluster that previously rejected price).
• If broken: selling pressure could push the market further down toward 6,578 and even 6,560 – both strong technical and psychological support levels.
✅ 4. Conclusion
The S&P500 has confirmed its bearish trend with a flash dump. The 6,651 – 6,658 area remains the critical resistance, and as long as price stays below this zone, sellers have the upper hand. The bearish scenario remains valid with the first target at 6,629 – 6,615, and if this support fails, the move could extend toward 6,578 – 6,560.
Please like and comment below to support our traders. Your reactions will motivate us to do more analysis in the future 🙏✨

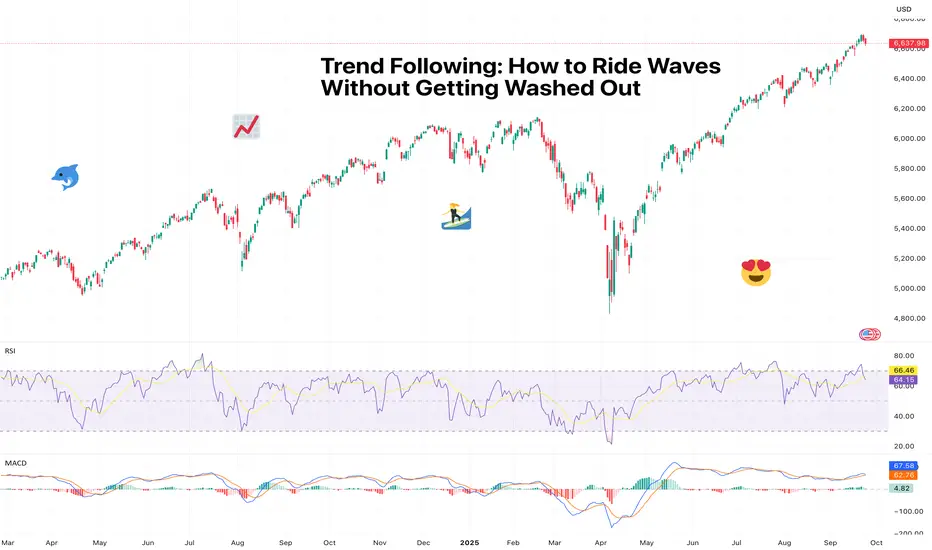
Trend Following: How to Ride Waves Without Getting Washed OutMarkets move in waves. Easy, right? But if you’ve tried catching one only to find out you get washed out, you’ve realized it ain’t’ that easy.
Sometimes there are gentle ripples that lull traders into boredom, other times they’re tsunamis that wipe out everything in sight.
The trick isn’t predicting when the next big set will hit – it’s learning how to catch it without falling off your board from the get-go. That’s where trend following comes in. Simple, structured, and surprisingly effective, it’s a strategy that says: stop guessing, start riding.
🌊 Catching It, Not Fighting It
At its core, trend following is about spotting momentum and sticking with it. If prices are climbing, you’re a buyer. If they’re falling, you’re a seller. No need to argue with the market about “fair value.” The trend follower’s mantra is: Mr. Market is always right, I’m just here to hitch a ride.
Why does this work? Because markets are essentially a bunch of thinking participants who move in herds. They share the same fears, hopes, expectations, and goals.
Traders, funds, and algorithms pile into the same ideas, technical patterns, and price levels, pushing valuations higher or lower. Your job isn’t to outsmart the herd – it’s to ride with it until the stampede loses steam.
Or better yet, spot the opportunity before the herd. "I am the animal at the head of the pack. I either get eaten, or I get the good grass,” says David Tepper, hedge fund manager.
🤫 Why It’s Harder Than It Sounds
“Buy high, sell higher” feels wrong anywhere but in the market. Human brains are usually wired to hunt for bargains, not chase expensive things. But there’s something about a record high that pulls you in and makes you say “Take my money!”
Traders love to bet on success. So when they see that Bitcoin BITSTAMP:BTCUSD is at $117,000 , near a record, it’s easier to throw cash than when it’s crashing and burning at a 60% discount.
True, no trend stays intact after a huge drop. But sometimes it’s better to see confirmation that the trend is exhausted than to exit during a mild dip and risk missing out on the big move.
Trend following isn’t about catching every top or bottom. It’s about accepting that you’ll never time it perfectly, but if you stay disciplined and let the trend play out, you’ll capture at least some of the move.
But in trading everything’s possible – some prefer to catch tops and bottoms, and that’s completely fine as long as it works.
“For twelve years I have been missing the meat in the middle but I have made a lot of money at tops and bottoms,” says Paul Tudor Jones, another big name in the industry.
📈 Tools of the Trade
So how do you know a trend is worth following? Traders lean on a few classics:
• Moving averages : If the 50-day is above the 200-day, that’s your green light. Prices above both? Bullish trend intact. Prices dive below the 200-day? Cue that a bear market is here.
• Support and resistance : Connect the dots (literally) and see if the price is respecting an upward or downward slope.
• Breakouts : When the price pops above resistance or drops below support on big volume, that’s the market saying, “Watch this.”
• Reversals : For those that like to live on the edge, spotting reversals might be a good way to catch a move from start to finish.
The trick isn’t in the tool itself, but in sticking to the plan when the inevitable wiggles and pullbacks happen.
🚤 Don’t Mistake Chop for Trend
Not every chart with bars pointing up is a trend. Sometimes you’re just looking at chop – those sideways, back-and-forth price moves that exist to chew up stop-losses and ruin Fridays.
Trend followers learn to wait for confirmation. That could mean a clean breakout with volume, or a moving average crossover with conviction. Enter too early, and you may find yourself drowning in false signals.
A confirmation is oftentimes triggered by economic news and reports. So pay attention to big and small releases stacked in the Economic Calendar .
🛟 The Stop-Loss Lifeboat
Here’s a little secret of trend following: you’ll be wrong a lot. The method is built around small losses and (occasional) big wins. That’s why stop-losses are essential . You’re not trying to win every trade, you’re trying to catch the few monster trends that more than pay for the slip-ups.
Think of it like surfing: you’ll get wiped out plenty of times, but you only need one clean wave to make the day worthwhile.
📊 The Math Behind the Swings
Why does this work over time? Because of asymmetric returns. If you risk $1 to make $3, you only need to be right 30% of the time to profit. Trend followers build systems where the losers are cut quickly, but the winners are allowed to run. That’s where the proper risk-reward ratio comes in.
Most traders do the opposite. They cut winners too early (“I’ll take my quick profit!”) and let losers drag on (“It’ll bounce, right?”).
🧩 Famous Trend Followers
This isn’t just theory. The Turtle Traders in the 1980s—an experiment by Richard Dennis and William Eckhardt—proved that complete novices could learn a rules-based trend following system and make millions. Fast forward, and big CTAs (Commodity Trading Advisors) still run billions using similar strategies today.
They all share one principle: don’t predict, only follow.
⏳ Patience Pays
The hardest part isn’t identifying trends. It’s sticking with them. Every pullback will tempt you to bail. Every analyst estimate, every scary headline, even your cousin at Thanksgiving telling you “Ether’s going to zero” will test your patience.
But trends don’t end because you got nervous. They end when the move breaks. Patience is what separates the trend followers who catch the big wave from the ones stuck paddling.
🎯 Final Take: Ride It Out
Trend following may not make you look like Paul Tudor Jones calling tops and bottoms. But it will keep you aligned with where the money is flowing. And when you’re on the right side of a trend, the ride is smoother, the wins are bigger, and the stress is lower.
Off to you : When’s the last time you got a nice wave and surfed it out to completion? Share your experience in the comments!
S&P pullback to 5900$Short post:
The market pullback to 5900$ is on the charts and probably accelerates in October mid week...
