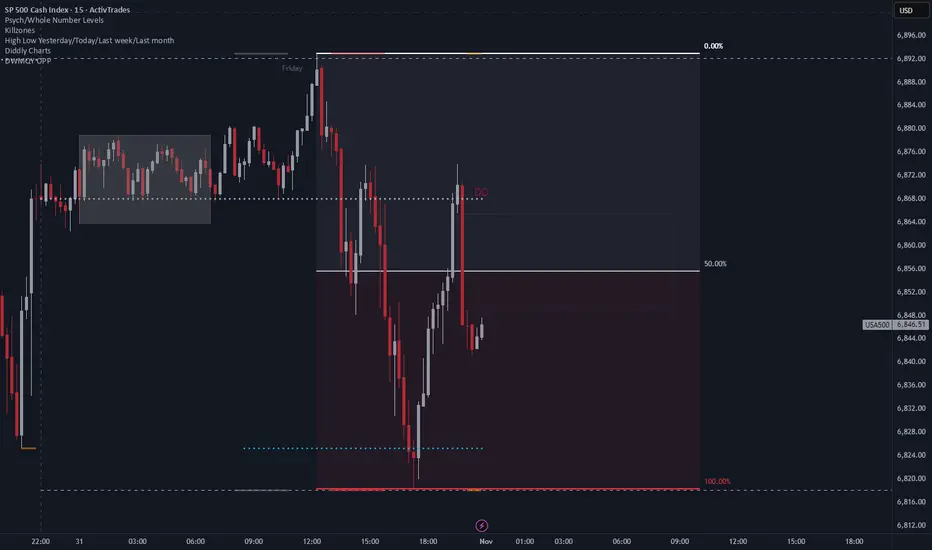
Intraday Range Expansion and Potential Repricing on the SPXFollowing a clean sweep of Friday’s high, price delivered a strong displacement to the downside, breaking short-term structure and rebalancing inefficiencies left behind. The subsequent rebound towards the daily open suggests a retracement into a premium area, potentially setting up for continuation lower if rejection holds around that zone.
If buyers fail to sustain price above the daily open, the market could aim for a full range fill back toward the previous low or discount zones below, maintaining the current bearish intraday order flow.
Trade ideas
S&P 500 Index Showing Weakness – Correction Ahead?Over the past seven days, the S&P 500 index( SP:SPX ) has been on a bullish run, frequently hitting new all-time highs. However, in the last two or three weeks, it's been influenced by the ongoing tariff tensions between the U.S. and China .
Let's look at the latest news about the S&P 500 index :
The IMF has flagged that market valuations might be a bit high, hinting at possible corrections. Plus, there's been a fresh look at how well China’s sticking to the 2020 trade deal, and on top of that, a new trade agreement in Southeast Asia is in the mix. So that’s the quick rundown!
Right now, if we look at the S&P 500 on a 1-hour timeframe, the index is near its Resistance lines and has lost its uptrend line , which is a sign of weakening momentum .
We also saw a Shooting Star Candlestick pattern form in the last few hours with good volume, adding credibility to the potential for a pullback .
From an Elliott Wave standpoint, it seems the S&P 500 has completed its wave 3, and we might see a wave 4 correction in the coming hours or days.
There's a noticeable Negative Regular Divergence(RD-) between the recent tops , and even on the daily timeframe, there's a divergence signaling potential weakness.
I expect the S&P 500 could drop at least to its Support line , around the $6,857 .
Note: The cryptocurrency market, and especially Bitcoin , has been highly correlated with the S&P 500 index these weeks, and a possible correction in this index could lead to a correction in this market.
Please respect each other's ideas and express them politely if you agree or disagree.
S&P 500 Index Analyze (SPX500USD), 1-hour time frame.
Be sure to follow the updated ideas.
Do not forget to put a Stop loss for your positions (For every position you want to open).
Please follow your strategy and updates; this is just my Idea, and I will gladly see your ideas in this post.
Please do not forget the ✅' like'✅ button 🙏😊 & Share it with your friends; thanks, and Trade safe.

What Is CPI and Why It Matters GloballyIntroduction: The Pulse of the Global Economy
In the complex world of economics, few indicators hold as much influence and significance as the Consumer Price Index (CPI). Whether it’s a policymaker setting interest rates, an investor predicting market movements, or an ordinary consumer noticing rising grocery bills, CPI plays a role in everyone’s financial life. It acts as a mirror reflecting changes in the cost of living and inflation, shaping everything from global monetary policies to household budgets.
Simply put, CPI measures how much prices have increased or decreased for a basket of goods and services that consumers typically buy. However, behind this simple concept lies a powerful tool that helps nations assess economic stability, business competitiveness, and the real purchasing power of their citizens.
Understanding CPI: The Basics
The Consumer Price Index (CPI) is an economic indicator that measures the average change in prices of a fixed basket of goods and services over time. This basket includes everyday items such as food, housing, clothing, healthcare, transportation, and education — essentially capturing the spending habits of urban consumers.
CPI as a Measure of Inflation
CPI is the most widely used tool to measure inflation — the general increase in prices and fall in the purchasing power of money.
When CPI rises steadily, it indicates inflation; when it falls, it suggests deflation.
Inflation can be both a sign of growth and a warning signal. Moderate inflation encourages spending and investment, as people prefer to buy now rather than later. But excessive inflation — as seen in countries like Argentina or Turkey in recent years — erodes savings, raises borrowing costs, and destabilizes economies.
Conversely, deflation (a sustained drop in prices) might sound appealing but can trigger economic stagnation. Falling prices reduce business revenues and wages, discouraging spending and investment.
Thus, tracking CPI helps governments strike a delicate balance between economic growth and price stability.
Types of CPI
Economists often use different versions of CPI to capture varied aspects of price changes:
Headline CPI:
This is the broadest measure, including all goods and services in the consumer basket. It reflects the overall inflation rate but can be volatile due to changes in food and energy prices.
Core CPI:
Excludes food and energy components, as they are prone to short-term fluctuations. Core CPI gives a clearer picture of long-term inflation trends.
CPI-W and CPI-U (in the U.S.):
CPI-W tracks the spending habits of urban wage earners and clerical workers.
CPI-U includes all urban consumers and is considered the official measure of inflation.
HICP (Harmonized Index of Consumer Prices):
Used by the European Union, this version allows for consistent inflation comparisons across member states.
Each variation of CPI serves a specific policy or analytical purpose, allowing economists to monitor inflation more accurately across different sectors and regions.
CPI and Global Monetary Policy
CPI plays a central role in shaping global monetary policy.
Central banks like the Federal Reserve (U.S.), European Central Bank (ECB), Bank of England, and the Reserve Bank of India (RBI) rely on CPI trends to make key decisions about interest rates and money supply.
When CPI shows rising inflation, central banks often raise interest rates to cool down spending and borrowing.
When CPI indicates deflation or weak inflation, they lower rates to stimulate economic activity.
For instance, during the COVID-19 pandemic, global CPI levels dropped as demand collapsed. Central banks responded with historically low interest rates and massive stimulus packages.
However, post-pandemic supply chain disruptions and energy shortages sent CPI soaring globally — prompting rapid interest rate hikes in 2022–2023.
These fluctuations show how closely CPI data influences global financial stability, currency values, and investment decisions.
CPI and Purchasing Power
CPI also helps determine changes in purchasing power — how much goods and services a unit of currency can buy.
If wages rise slower than CPI, real income effectively decreases, meaning consumers can buy less with the same money.
For example:
If CPI rises by 6%, but wages increase by only 3%, then real wages have fallen by 3%.
This erosion in purchasing power can reduce consumer confidence and spending — key drivers of economic growth.
Governments and labor unions often use CPI data to adjust wages, pensions, and social benefits (a process called indexation) to maintain people’s living standards.
CPI as a Global Benchmark
CPI data is not just a domestic concern — it has international ramifications.
Global investors, financial institutions, and multinational corporations all monitor CPI across different countries to assess economic health and currency risks.
Here’s how:
Exchange Rates:
High inflation (rising CPI) typically weakens a nation’s currency because it erodes purchasing power. Investors may move money to countries with lower inflation and higher returns, affecting foreign exchange markets.
Investment Flows:
CPI trends help guide foreign direct investment (FDI) and portfolio investment decisions. For instance, a stable CPI and moderate inflation attract investors seeking predictable returns.
Trade Competitiveness:
Countries with lower inflation maintain price stability in exports, making their goods more competitive globally. Conversely, high CPI growth can make exports expensive and hurt trade balances.
Thus, CPI serves as a universal barometer for comparing economic conditions across nations.
CPI and the Financial Markets
The stock market, bond market, and commodity markets react strongly to CPI reports.
Traders and investors treat CPI announcements as key economic events because they directly influence interest rate expectations and corporate profitability.
Equity Markets:
Rising CPI may hurt company profits by increasing input costs. However, certain sectors — like energy, commodities, and consumer staples — often benefit during inflationary periods.
Bond Markets:
Bonds are highly sensitive to inflation. When CPI rises, bond yields increase because investors demand higher returns to offset the loss of purchasing power. This inversely affects bond prices.
Commodity Markets:
Commodities such as gold and crude oil often act as inflation hedges. A high CPI can push investors toward tangible assets that retain value when currencies lose purchasing power.
Thus, CPI data can trigger short-term volatility and long-term investment strategy shifts across asset classes.
Limitations of CPI
While CPI is an essential tool, it’s not without flaws. Economists often debate its accuracy and representativeness due to several factors:
Substitution Bias:
Consumers tend to switch to cheaper alternatives when prices rise, but CPI assumes a fixed basket — overstating inflation.
Quality Adjustments:
Technological improvements often increase product quality (e.g., smartphones), but CPI may not fully capture this added value.
Geographical Variations:
Price changes differ between regions. Urban CPI may not accurately reflect rural cost-of-living changes.
Lagging Indicator:
CPI measures inflation after it has occurred, meaning policymakers are often reacting to past data.
Exclusion of Certain Costs:
CPI may exclude investment assets like real estate or stocks, even though they significantly affect household wealth.
Despite these limitations, CPI remains the most reliable and widely accepted inflation measure because of its consistency and comparability.
Case Studies: CPI in Action
1. United States: Inflation and Federal Reserve Policy
In 2022, U.S. CPI surged above 9%, the highest in four decades. Rising food, fuel, and housing costs prompted the Federal Reserve to raise interest rates aggressively throughout 2022–2023. This decision cooled inflation but also slowed economic growth and rattled stock markets.
It showcased how CPI data can reshape monetary strategy and ripple through global markets.
2. India: Balancing Growth and Inflation
India’s CPI basket is heavily weighted toward food and housing. When food prices rise due to poor monsoon or supply shortages, CPI spikes quickly.
The RBI uses CPI as its main inflation target, aiming to keep it between 2–6%. By adjusting repo rates based on CPI trends, the RBI manages both growth and price stability.
3. Eurozone: The Battle with Deflation and Energy Prices
For years, the Eurozone struggled with low inflation and deflation risks, prompting the ECB to maintain ultra-low interest rates. However, after the Ukraine conflict in 2022, energy-driven CPI spikes forced the ECB to tighten policy sharply.
This swing illustrated CPI’s impact on regional economic integration and fiscal coordination.
CPI in the Context of Global Challenges
Today’s world faces unprecedented inflationary pressures due to factors like:
Geopolitical conflicts (e.g., Russia–Ukraine)
Supply chain disruptions
Energy market volatility
Climate change impacting agriculture
Post-pandemic demand surges
As a result, global CPI data has become a critical early warning system for potential recessions, stagflation, or monetary tightening cycles.
International institutions such as the IMF and World Bank rely on CPI trends to forecast global growth and recommend policy adjustments.
Future of CPI: Adapting to a Changing Economy
As consumption habits evolve, CPI calculations must also adapt. The rise of digital goods, subscription services, and AI-driven economies is reshaping how statisticians define the “consumer basket.”
Future CPI methodologies may include:
Real-time price tracking using big data and AI
Regional CPI dashboards for urban and rural contrasts
Inclusion of environmental costs and green inflation (the impact of climate policies on prices)
Better adjustments for technological improvements
Such innovations will make CPI a more accurate, dynamic, and inclusive measure of global inflation.
Conclusion: The Global Significance of CPI
The Consumer Price Index is more than just a number; it is the heartbeat of the world economy. It influences how central banks set interest rates, how investors allocate capital, how governments plan budgets, and how families manage their daily expenses.
Understanding CPI is crucial not only for economists but for anyone navigating an interconnected global economy. Whether inflation is surging or stabilizing, CPI tells the story of how value, consumption, and confidence move together in shaping our economic future.
In a world of shifting trade patterns, volatile energy markets, and evolving digital economies, CPI remains the compass that helps policymakers, businesses, and citizens alike find direction amid economic uncertainty.

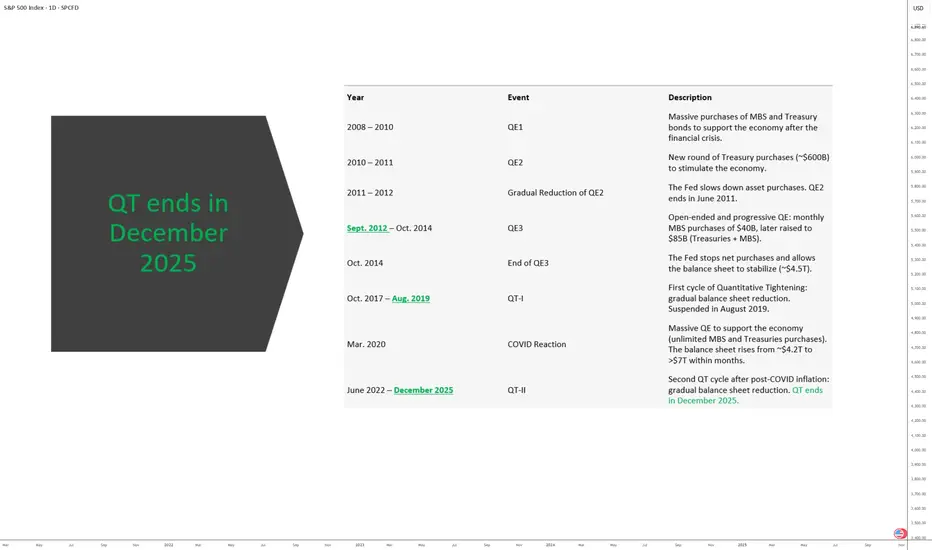
Fed Overview: The Good and the Not So GoodDriven by an euphoric phase, the S&P 500 has approached 7,000 points, nearing its 2000 valuation record, with six consecutive months of gains without retracement.
The key question for investors is now clear: has the Federal Reserve provided enough justification for this confidence, or does Jerome Powell’s caution mark the beginning of the end of this euphoric phase?
1) A Fed slowing the pace without complacency
On Wednesday, October 29, the Fed announced another 25-basis-point rate cut, bringing the federal funds rate into the 3.75%–4.00% range. This is the second consecutive reduction, aimed at countering the labor market slowdown.
However, the FOMC vote revealed strong internal divisions: one member wanted a deeper cut, another preferred no change. This reflects the delicate balance between supporting employment and avoiding renewed inflationary pressure.
Another key signal: the Fed decided to pause its balance sheet reduction (quantitative tightening) starting December 1st, in order to preserve financial system liquidity, as credit markets show early signs of stress. Powell clarified that this pause does not imply a lasting return to an expansionary stance.
Finally, Powell cooled expectations for another rate cut in December, stating that “nothing is guaranteed.” Money markets now price roughly a 70% chance of a hold in December, down from nearly 90% odds of a cut before the meeting.
2) Between monetary realism and market excess
The Fed is not ruling out further easing, but it refuses to fuel a bullish rally in the S&P 500 that is now considered excessive relative to fundamentals.
Current valuations rely heavily on expectations of continued rate cuts. If that narrative weakens, the likelihood of a technical correction in the S&P 500 rises.
At this stage, however, the index has not yet signaled a reversal.
DISCLAIMER:
This content is intended for individuals who are familiar with financial markets and instruments and is for information purposes only. The presented idea (including market commentary, market data and observations) is not a work product of any research department of Swissquote or its affiliates. This material is intended to highlight market action and does not constitute investment, legal or tax advice. If you are a retail investor or lack experience in trading complex financial products, it is advisable to seek professional advice from licensed advisor before making any financial decisions.
This content is not intended to manipulate the market or encourage any specific financial behavior.
Swissquote makes no representation or warranty as to the quality, completeness, accuracy, comprehensiveness or non-infringement of such content. The views expressed are those of the consultant and are provided for educational purposes only. Any information provided relating to a product or market should not be construed as recommending an investment strategy or transaction. Past performance is not a guarantee of future results.
Swissquote and its employees and representatives shall in no event be held liable for any damages or losses arising directly or indirectly from decisions made on the basis of this content.
The use of any third-party brands or trademarks is for information only and does not imply endorsement by Swissquote, or that the trademark owner has authorised Swissquote to promote its products or services.
Swissquote is the marketing brand for the activities of Swissquote Bank Ltd (Switzerland) regulated by FINMA, Swissquote Capital Markets Limited regulated by CySEC (Cyprus), Swissquote Bank Europe SA (Luxembourg) regulated by the CSSF, Swissquote Ltd (UK) regulated by the FCA, Swissquote Financial Services (Malta) Ltd regulated by the Malta Financial Services Authority, Swissquote MEA Ltd. (UAE) regulated by the Dubai Financial Services Authority, Swissquote Pte Ltd (Singapore) regulated by the Monetary Authority of Singapore, Swissquote Asia Limited (Hong Kong) licensed by the Hong Kong Securities and Futures Commission (SFC) and Swissquote South Africa (Pty) Ltd supervised by the FSCA.
Products and services of Swissquote are only intended for those permitted to receive them under local law.
All investments carry a degree of risk. The risk of loss in trading or holding financial instruments can be substantial. The value of financial instruments, including but not limited to stocks, bonds, cryptocurrencies, and other assets, can fluctuate both upwards and downwards. There is a significant risk of financial loss when buying, selling, holding, staking, or investing in these instruments. SQBE makes no recommendations regarding any specific investment, transaction, or the use of any particular investment strategy.
CFDs are complex instruments and come with a high risk of losing money rapidly due to leverage. The vast majority of retail client accounts suffer capital losses when trading in CFDs. You should consider whether you understand how CFDs work and whether you can afford to take the high risk of losing your money.
Digital Assets are unregulated in most countries and consumer protection rules may not apply. As highly volatile speculative investments, Digital Assets are not suitable for investors without a high-risk tolerance. Make sure you understand each Digital Asset before you trade.
Cryptocurrencies are not considered legal tender in some jurisdictions and are subject to regulatory uncertainties.
The use of Internet-based systems can involve high risks, including, but not limited to, fraud, cyber-attacks, network and communication failures, as well as identity theft and phishing attacks related to crypto-assets.
SPX500 | Consolidation Phase Before BreakoutSPX500 – MARKET OUTLOOK | Consolidation Phase Before Breakout 🇺🇸
The S&P 500 is consolidating between 6,918 and 6,879, as traders await the next breakout following recent Fed guidance and earnings results.
Above 6,918: Bullish continuation toward 6,941 → 6,991.
Below 6,879: Opens correction toward 6,842 → 6,770.
Pivot: 6,918
Support: 6,879 · 6,843 · 6,770
Resistance: 6,941 · 6,991
SPX500 remains range-bound, but a breakout from this zone will define the next trend direction.

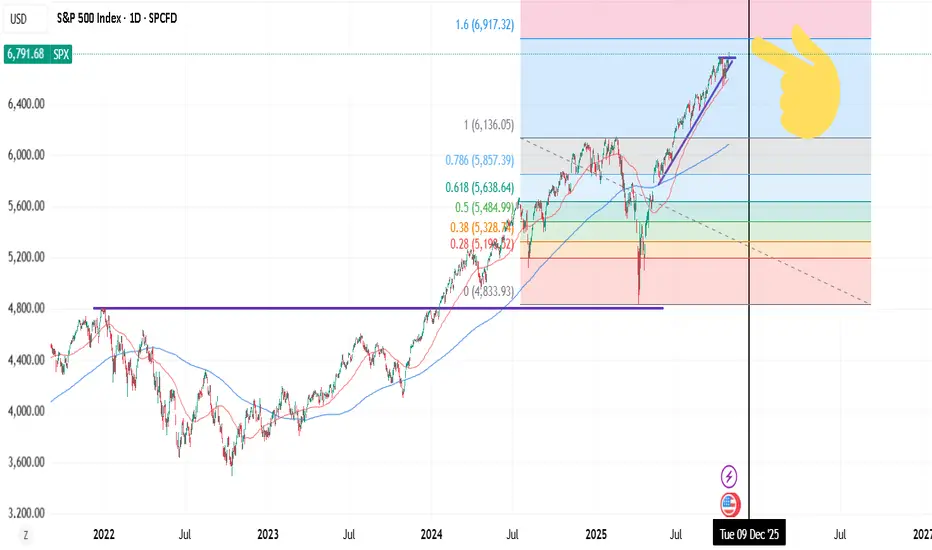
S&P Nearing Major Resistance (Update)This updates my previous S&P chart back last year showing the S&P still had room to run until any major resistance. We're nearing that major resistance at 7577. Looks like it might hit around January 2026.
The trouble is this trend is heating up and we needed a pullback to 6295. With all the excitement from Nvidia and other major Hyperscalers I'm worried it's going to just go straight to Major resistance. *If it does* we could be looking at a decently large pullback next year (finishing around August) down to that 6295 area and back into the supporting trend line for the next big uptrend to start.
If however we slow down here and get a pullback back to 6295 then I think we're good to make it over the major resistance without that big pullback next year.
Either way once we hit the major resistance at 7577 we'll need to get close to that lower trend line at some point to begin a new bull run.
Good luck and take caution as we approach this resistance!

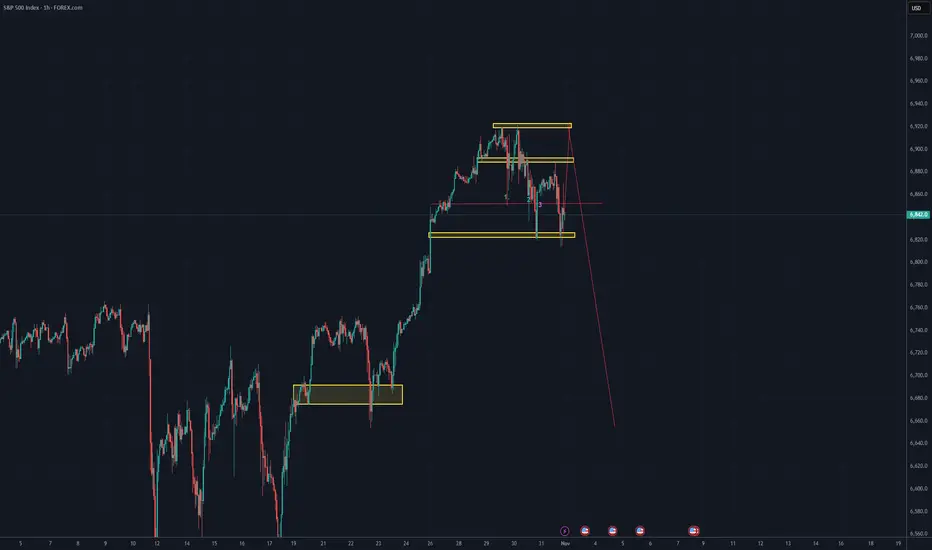
SPX Breaks Down: Tech Momentum Cools as Risk-Off Sentiment BuildThe S&P 500 just broke below its short-term descending channel — confirming selling pressure is building. High-valuation tech and AI names like NASDAQ:NVDA , NASDAQ:MSFT , NASDAQ:GOOGL , NASDAQ:MU , and NASDAQ:PLTR are leading the pullback as investors rotate out of crowded trades.
Macro headwinds — Fed uncertainty, stretched valuations, and global weakness — are weighing on sentiment. Near-term bias stays bearish unless SP:SPX can reclaim 6,850.

SPX500 H1 | Bullish Bounce OffS&P500 has bounced off the buy entry at 6,839.32, which is a pullback support that aligns with the 23.6% Fibonacci retracement and could rise from this level to the take profit.
Stop loss is at 6,793.88, which is a pullback support that lines up with the 50% Fibonacci retracement.
Take profit is at 6,926.57, which s a swing high resistance.
Stratos Markets Limited (tradu.com ):
CFDs are complex instruments and come with a high risk of losing money rapidly due to leverage. 68% of retail investor accounts lose money when trading CFDs with this provider. You should consider whether you understand how CFDs work and whether you can afford to take the high risk of losing your money.
Stratos Europe Ltd (tradu.com ):
CFDs are complex instruments and come with a high risk of losing money rapidly due to leverage. 70% of retail investor accounts lose money when trading CFDs with this provider. You should consider whether you understand how CFDs work and whether you can afford to take the high risk of losing your money.

S&P 500 Technical & Fundamental Outlook — Week of Nov 3–7, 2025🧭 S&P 500 Technical & Fundamental Outlook — Week of Nov 3–7, 2025
Chart View:
Price is consolidating between 6,815 support and 6,921–6,940 resistance, holding just above the major ascending trend line from October.
This area marks a critical inflection: will buyers defend the trend, or will we finally break structure?
📊 Technical Breakdown
Primary Trend: Uptrend intact while above trend line support.
Key Support Zone: 6,800 – 6,815 (buyers last defended strongly).
Major Breakdown Level: Below 6,656 opens the door to 6,550 and new lower lows.
Resistance Zone: 6,921 – 6,940 (previous swing high & supply area).
Bias: Neutral-to-bullish while above 6,815; bearish momentum accelerates under 6,656.
🟢 Bullish Path: Use the trend line as a launchpad to retest 6,921+.
🔴 Bearish Path: Break and close below 6,815 → target 6,656 then 6,550.
🗓 Macro Calendar – Key Events to Watch
Mon (Nov 3) – ISM Manufacturing PMI (48.7 vs 49.4 prior)
→ Soft manufacturing data keeps Fed-cut expectations alive.
Tue (Nov 4) – ECB President Lagarde speaks (2 appearances)
→ Watch EUR/USD volatility; global equity tone may shift if dovish.
Wed (Nov 5) – ADP Employment (+31K expected after –32K prior); ISM Services PMI (50.7 exp)
→ Jobs rebound or slowdown will steer rate-cut bets and risk appetite.
Thu (Nov 6) – Bank of England rate decision (4.00% expected hold) + Governor Bailey speech; FOMC Member Waller speaks (2:30 PM ET)
→ Cross-market rate tone could affect bond yields → equity valuations.
Fri (Nov 7) – U.S. Non-Farm Payrolls + Unemployment + UoM Sentiment (53.0 exp)
→ This is the week’s main volatility catalyst. Strong jobs = hawkish pressure; weak jobs = bullish equities.
💬 Market Sentiment & Headlines
AI Mania Continues: Amazon hit a record after a $38 B OpenAI deal via AWS, fueling tech momentum.
Earnings Strength: 80% of S&P companies beat Q3 estimates; megacap tech remains the driver.
Breadth Concerns: 300+ S&P names closed red Monday — showing the rally is narrow and fragile.
Other Corporate Moves: Kimberly-Clark to acquire Kenvue ($48.7 B), Starbucks China JV announcement.
Macro Backdrop: Investors await clarity on Fed policy path and global rate decisions amid softening manufacturing data.
🧩 Trader’s Take
This week is all about trend-line defense vs breakdown.
Stay flexible:
Above 6,815 → trend continuation bias.
Below 6,656 → prepare for deeper retracement toward 6,550.
Macro data + AI headlines are creating a push-pull market: tech buoyancy vs broader weakness.
📅 Watch the reaction during ISM & NFP — these will likely decide direction for mid-November.
#SPX #SP500 #Futures #TradingView #PriceAction #Fundamentals #TechnicalAnalysis #StockMarket #AIStocks #MacroWeek #NFP #ISM #Fed #Equities #Amazon #OpenAI #NASDAQ #SPX500

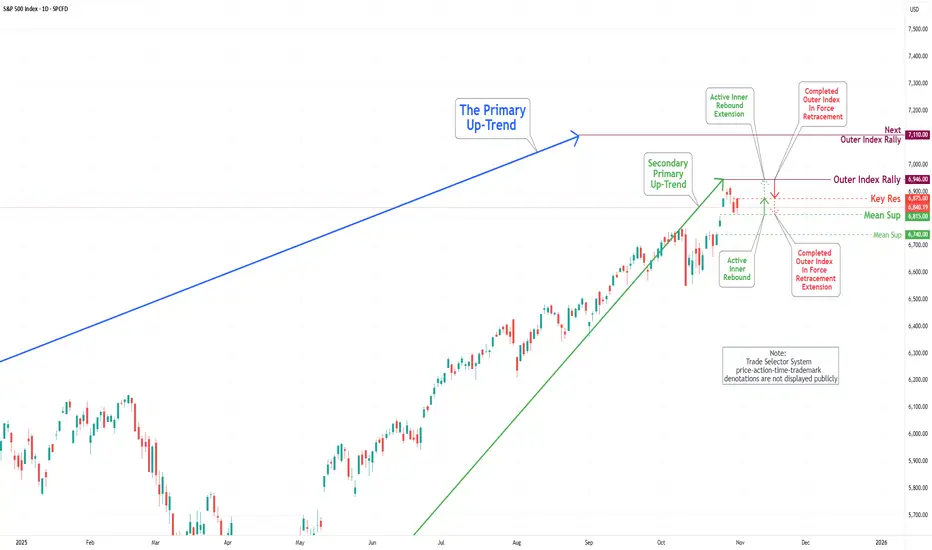
S&P 500 Daily Chart Analysis For Week of Oct 31, 2025Technical Analysis and Outlook:
During the recent trading session, the S&P 500 Index continued its wild ride, highlighting the importance of our key target, which stands as an Outer Index Rally at 6946. Fluctuations between the Mean Support at 6815 and the Key Resistance at 6875 serve as a crucial threshold for market participants. This positioning suggests the potential for further upward momentum, as the prevailing trend indicates a well-structured Active Inner Rebound extension toward the target stated above.
Nevertheless, it is essential to acknowledge the possibility of a sustained and gradual pullback within the current Active Inner Rebound zone. Such a pullback may retest the Mean Support at 6815 and could decline further to the Mean Support at 6740 before ultimately resuming an upward trajectory.
S&P500 resilient US data reignited riskRisk appetite returned to markets over the last 24 hours, with the S&P 500 rising +0.37% as stronger US data and optimism over a potential end to the government shutdown lifted sentiment.
The ADP private payrolls report surprised to the upside at +42k (vs. +30k expected), while the ISM Services index jumped to 52.4 (vs. 50.8 expected) with new orders at a 12-month high, easing fears of an economic slowdown after Monday’s weak manufacturing data.
The improved tone triggered a broad risk-on rally:
US HY spreads tightened (-9bps) for the first time in a week.
Bitcoin rebounded (+3.38%) after recent losses.
Asian equities followed through overnight, with the Nikkei up +1.48% and Hang Seng +1.61%.
Despite solid data, Treasuries rallied as markets priced a higher chance of a December Fed rate cut, sending the USD to its biggest 3-week drop.
In corporate news, SpaceX agreed to buy EchoStar’s AWS-3 spectrum licenses for $2.6bn in stock, while EchoStar booked a $16.5bn non-cash charge tied to its 5G network wind-down.
However, some valuation concerns are re-emerging — the “Buffett Indicator” now shows US equities worth over twice GDP, with total market cap around $72tn, underscoring stretched levels after a +36% rally since April lows.
Bottom line: The S&P 500 regained momentum as resilient US data reignited risk appetite and rate-cut hopes, though extended valuations remain a potential headwind.
This communication is for informational purposes only and should not be viewed as any form of recommendation as to a particular course of action or as investment advice. It is not intended as an offer or solicitation for the purchase or sale of any financial instrument or as an official confirmation of any transaction. Opinions, estimates and assumptions expressed herein are made as of the date of this communication and are subject to change without notice. This communication has been prepared based upon information, including market prices, data and other information, believed to be reliable; however, Trade Nation does not warrant its completeness or accuracy. All market prices and market data contained in or attached to this communication are indicative and subject to change without notice.

S&P500 pullback reaching pivotal zone at 6748The S&P 500 (+0.17%) eked out a small gain yesterday, but market breadth remained weak. The Magnificent 7 (+1.18%) continued to drive performance while the S&P 500 ex-Mag 7 (-0.30%) and equal-weighted index (-0.30%) both declined, highlighting the narrow leadership.
The main positive driver came from another AI-related deal—Amazon’s partnership with OpenAI, which boosted sentiment in large-cap tech. However, overall momentum was capped by soft economic data, hawkish Fed commentary, and concerns around a prolonged U.S. government shutdown, now matching the longest on record and set to surpass it by midnight.
Overnight sentiment turned weaker, with Palantir (-4% after hours) dragging tech sentiment lower after offering limited 2026 guidance despite solid results. Nasdaq and S&P futures are down -0.85% and -0.59%, respectively, and Asian markets are mostly lower, adding to the cautious tone.
Today’s focus:
Earnings: A busy session with results from AMD, Shopify, Uber, Pfizer, BP, and others, likely to shape sector moves.
Politics: U.S. state elections (New York mayoral, New Jersey and Virginia gubernatorial races) could test political sentiment but are unlikely to have major near-term market impact.
Outlook: Expect a softer start for the S&P 500 as tech momentum fades and macro uncertainty persists, with investor focus shifting to corporate earnings and central bank commentary for direction.
Key Support and Resistance Levels
Resistance Level 1: 6830
Resistance Level 2: 6857
Resistance Level 3: 6880
Support Level 1: 6748
Support Level 2: 6727
Support Level 3: 6707
This communication is for informational purposes only and should not be viewed as any form of recommendation as to a particular course of action or as investment advice. It is not intended as an offer or solicitation for the purchase or sale of any financial instrument or as an official confirmation of any transaction. Opinions, estimates and assumptions expressed herein are made as of the date of this communication and are subject to change without notice. This communication has been prepared based upon information, including market prices, data and other information, believed to be reliable; however, Trade Nation does not warrant its completeness or accuracy. All market prices and market data contained in or attached to this communication are indicative and subject to change without notice.

SPX | Daily Analysis #10 - 3 November 2025Hello and Welcome Back to DP,
Review & News Coverage:
Since our last SPX analysis, we mentioned that a broken trendline could open the door for downside movement. As we can see on the chart, the index fell toward the 1.68 Fibonacci zone before bouncing back.
This drop created about $44 of volatility — hopefully, you managed to catch that move! We had highlighted the 6811 area as a potential buy zone, and indeed, that level opened an opportunity for entries (I personally missed it since I needed more confirmation, but I hope some of you caught it).
From both the economic and political sides, several developments could shape SPX sentiment and direction:
Economic Calendar:
Monday: ISM Manufacturing PMI
Wednesday: ADP Non-Farm Employment Change & ISM Services PMI
Friday: Tentative Unemployment Rate
Stronger-than-expected data could strengthen the dollar and weigh on equities, while weaker readings may support a rebound if markets price in potential rate relief.
Political Landscape:
Watch for new announcements on funding negotiations or relief measures — any progress (or setback) in the government-shutdown talks could move markets.
The U.S. government shutdown remains a risk factor, with pressure building from expiring healthcare tax credits and food assistance programs.
And most importantly — keep an eye on “Trump’s Indicator” (his posts or tweets). His remarks often create sharp, short-term volatility across indices and sectors.
1H - 4H Technical Analysis:
On the charts, the SPX is struggling to regain upward momentum.
If price breaks the intraday trendline, room opens for a move down toward 6844 and 6829.
If those zones show strong volume and bullish candle patterns, we could look for buy entries around that range.
The key is to wait for confirmation — volume support and candle behavior will guide whether the market finds its footing or continues to slide.
Summary:
Short-term tone remains cautiously bullish while above 6811, but pressure remains from macro and political uncertainty.
Watch mid-week data and political headlines for volatility spikes.
Technical zones: Support 6829–6811, Resistance 6895–6920 (potential retest if sentiment turns).
Disclaimer:
This content is for informational purposes only and does not constitute financial or investment advice. © DIBAPRISM
Amir D.Kohn

US500 maintains inherently bullish structureFundamental Analysis
US500 maintains an inherently bullish structure, trading above both EMAs. Q3 earnings were strong, with 83% of companies beating expectations and delivering 13.8% blended EPS growth, largely thanks to megacap tech/AI. However, the forward P/E ratio is high at 23.1x (above the 5-year average of 19.9x), signaling elevated valuations. The recent profit taking in high growth names like AMD and Nvidia due to margin concerns and macro headwinds (high rates/inflation) exposes this valuation sensitivity.
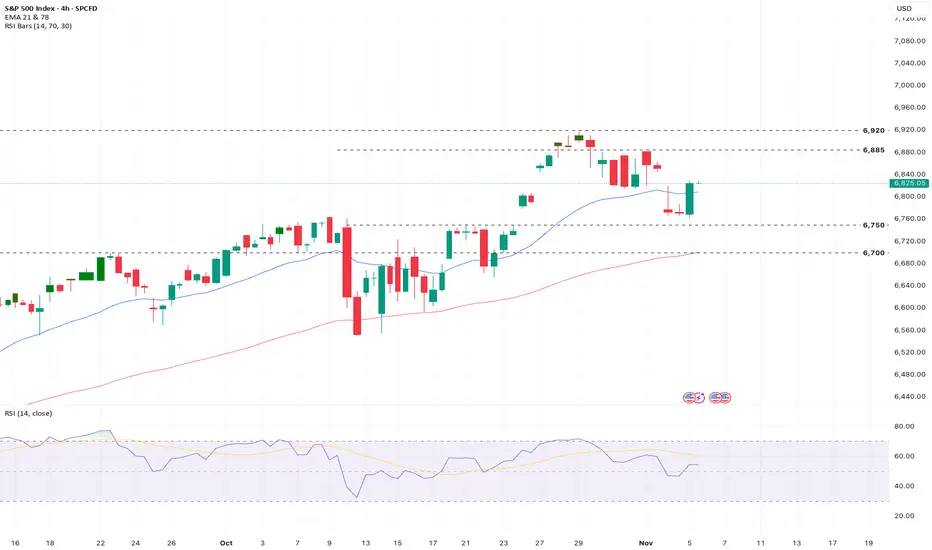
Technical Analysis
The index is currently pulling back from all time highs near 6,900, consolidating in a short term support zone of 6,750. Momentum is neutralizing with RSI approx 51.6, indicating a pause rather than a reversal. Key technical battleground: Resistance at 6,885 and 6,920 versus support at 6,750 and the EMA at 6,700. Consolidation is the most probable short term path.
Sentiment Analysis
Sentiment is cautious to slightly negative. The sharp correction in AI leaders (AMD, NVDA) has fueled "AI bubble" fears, overriding fundamentally strong earnings reports. There is a clear, broad sector rotation occurring as investors de-risk and take year end profits from high growth tech toward defensive/value plays. The market is currently driven by nervousness about sustaining premium valuations against persistent macro uncertainty.
Outlook
The near term outlook is moderately cautious. While the long term bullish trend remains supported by healthy corporate earnings, the market faces an inflection point driven by overvaluation concerns in the tech sector. Further short term volatility is expected as the market digests earnings nuances (like margin guidance) and awaits clearer signals on US monetary policy and inflation. A decisive break of the 6,750 support or 6,885 resistance will likely define the next directional move.
Analysis is by Terence Hove, Senior Financial Markets Strategist at Exness

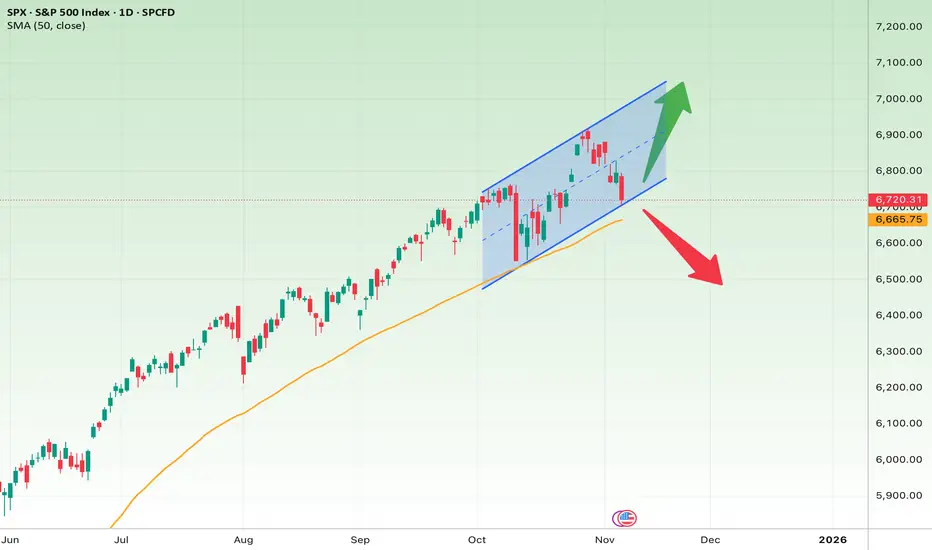
S&P 500 Index (SPX) — Daily Chart AnalysisThe S&P 500 is moving within a well-defined ascending channel on the daily timeframe. After touching the top of the channel, the index entered a short-term correction and is now testing the mid-channel area and the 50-day moving average (around 6,665) — both key support zones.
Short-Term Outlook (next few days to weeks)
If the index holds above 6,660–6,700 and starts to rebound, the next target would likely be the 6,950–7,000 resistance area near the top of the channel.
However, if 6,650 breaks and the price closes below it, a deeper pullback toward 6,450 or even 6,300 could follow.
• Bullish target: 6,950–7,000
• Bullish stop loss: Below 6,650
• Bearish target: 6,450–6,300
• Bearish stop loss: Above 6,800
Mid-Term Outlook (1–3 months)
The broader trend remains bullish, as the 50-day moving average still slopes upward. As long as the price stays above this line, the market structure remains positive.
If the upward channel holds, the next potential targets lie between 7,100 and 7,200.
But a confirmed breakdown below 6,650 could signal a shift in momentum toward a larger correction.
• Bullish mid-term target: 7,100–7,200
• Mid-term stop loss: Below 6,650
Summary :
The 6,660–6,700 range is the key zone to watch:
• Holding above it → continuation of the uptrend toward the channel’s upper boundary
• Breaking below it → possible decline toward the lower channel or deeper correction
In short, this area acts as the line between continuation and correction for the S&P 500.
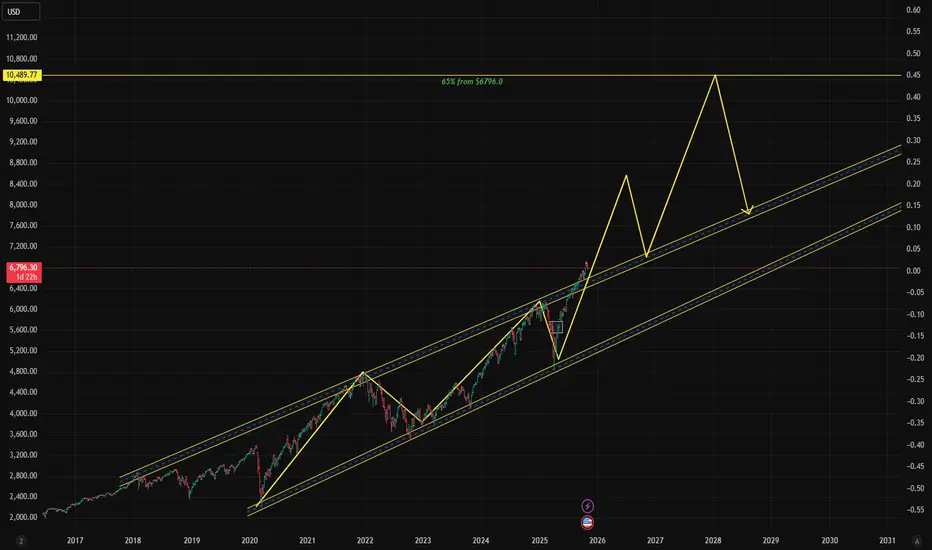
$SPX Hi, we are back with another one: SP:SPX !!!
As we can see we have SP:SPX sitting at $6796.30 with and expectation for a 65% pump.
That would bring us around $9-$10K per 1 SP:SPX .
Wouldn't that be incredible if we can see this by 2026 -2028 ?
What a time to be alive no ?
Don't forget to comment like and share for good luck :) !!!
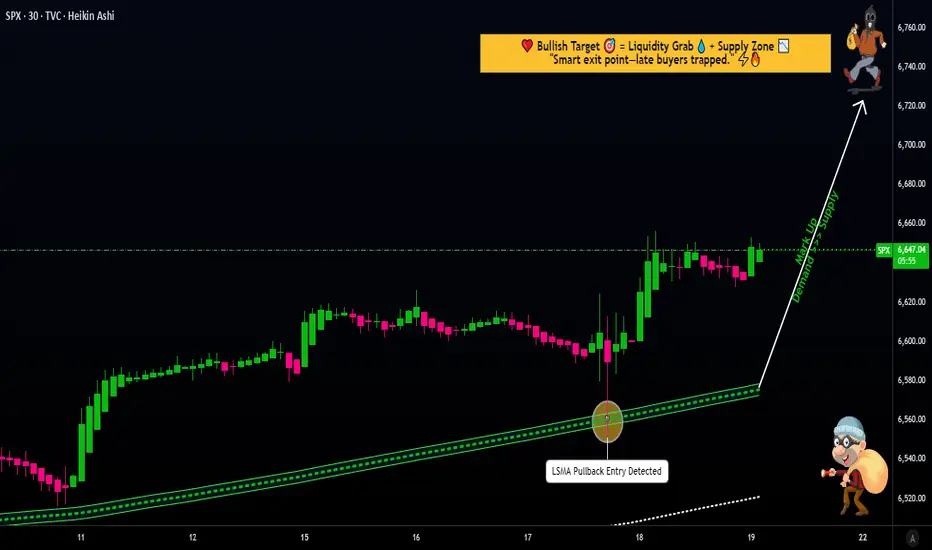
SPX500 Trading Strategy Explained: From Entry to Exit⚡ SPX500 “STANDARD & POOR” Indices Market Wealth Strategy Map ⚡
(Swing / Day Trade Plan – Thief OG Style)
🧭 Plan
📈 Bias: Bullish confirmed with 30m LSMA pullback + 0.786 Fibonacci-based MA confluence.
💡 Entry Approach (Thief Layering Strategy™):
Instead of one-shot entry, I place multiple buy-limit layers to average into strength. Example setup:
Buy limit: 6600
Buy limit: 6620
Buy limit: 6640
👉 You can extend or adjust the layering based on your own strategy.
🎯 Stop Loss (SL)
This is my Thief SL @6560.
⚠️ Note to Ladies & Gentlemen (Thief OG’s): This SL is not a recommendation. Use your own judgment — protect your loot at your own risk.
💰 Target (TP)
📌 6750 — sitting at strong resistance + overbought zone + possible bull-trap.
⚠️ Again, OG’s — this is not financial advice. Take profit when it fits your plan. Secure the bag, then enjoy the loot!
🔍 Related Pairs to Watch
Keep an eye on these correlated assets to confirm the SPX500’s move:
NASDAQ:NDX (Nasdaq 100): Tech-heavy index with strong correlation to SPX500. If tech stocks are pumping, it’s a bullish signal for our trade. 📊
TVC:DXY (US Dollar Index): A weaker dollar often boosts equities. Watch for inverse correlation—DXY dropping could mean SPX500 is ready to fly! 🚀
TVC:VIX (Volatility Index): Low VIX levels signal market calm, supporting our bullish setup. A spike in VIX could warn of trouble, so stay sharp! ⚡
Key Correlation Insight: SPX500 often moves in tandem with NASDAQ:NDX due to shared tech giants (think Apple, Microsoft). If NASDAQ:NDX is rallying, it’s a tailwind for our trade. Conversely, a rising TVC:DXY or TVC:VIX could signal caution.
📝 Thief Note
Dear Ladies & Gentlemen (Thief OG’s):
This map is my personal swing/day trade playbook — not a fixed recommendation. Layer entries, cut losers fast, and loot when you can. Market moves are wild; manage risk like a true OG.
✨ “If you find value in my analysis, a 👍 and 🚀 boost is much appreciated — it helps me share more setups with the community!”
⚠️ Disclaimer: This is a Thief-style trading strategy shared just for fun & educational vibes. Not financial advice. DYOR & trade responsibly.
Double TopWe have a double top pattern followed a strong bearish engulfing candle, this shows that the price is most likely to fall and make a lower low

S&P500 INDEX | Bulls in Control Above 6,889 Ahead of Fed CutSPX500 – MARKET OVERVIEW | Bullish Momentum Builds Ahead of Fed Decision 🇺🇸
Barclays equity strategists believe stocks will continue their strong rally into year-end, despite some “pockets of froth.”
The Federal Reserve is widely expected to cut interest rates later today, with growing speculation it may also slow or end balance sheet reduction, further supporting risk assets.
Technically, the SPX500 has stabilized above 6,889, confirming bullish momentum and signaling potential continuation toward 6,941 and 6,991.
As long as the index trades above 6,889, the bias remains bullish.
However, to shift toward a bearish trend, the price would need to stabilize below 6,889, which could trigger a decline toward 6,842 and 6,755.
Key Technical Levels
Pivot Line: 6,889
Resistance: 6,941 · 6,991
Support: 6,843 · 6,760
Outlook:
SPX500 remains bullish above 6,889, supported by expectations of a Fed rate cut and year-end equity strength.
A confirmed break below 6,889 would shift momentum to bearish, targeting deeper corrections toward 6,842–6,755.

SPX500 H4 | Potential Bearish ReversalS&P500 is reacting off the sell entry at 6,888.42, which aligns with the 100% Fibonacci projection and could reverse from this level to the take profit.
Stop loss is at 6,950, whic is a swing high resistance level.
Take profit is at 6,761.08, which is a pullback support that aligns with the 38.2% Fibonacci retracement.
Stratos Markets Limited (tradu.com ):
CFDs are complex instruments and come with a high risk of losing money rapidly due to leverage. 68% of retail investor accounts lose money when trading CFDs with this provider. You should consider whether you understand how CFDs work and whether you can afford to take the high risk of losing your money.
Stratos Europe Ltd (tradu.com ):
CFDs are complex instruments and come with a high risk of losing money rapidly due to leverage. 70% of retail investor accounts lose money when trading CFDs with this provider. You should consider whether you understand how CFDs work and whether you can afford to take the high risk of losing your money.

1.6 FIB Ceiling - Stock market correction soon in NOV/DEC.You can apply 1.6 FIB to FAANG or QQQ for high probability ceilings. VIX "structure" (pattern) or setup also indicates it. Stocks forming a sharp "wedge drop", extension from 50dma.
Bullish near term (probably?), correction in NOV/DEC.
I wonder if the first 5 (monthly) trading days in NOV are not volatile AF. 😂