Weekly Outlook: XAUUSD, #SP500, #BRENT for 27-31 October 2025XAUUSD: BUY 4075.00, SL 4025.00, TP 4225.00
Gold starts the week near record territory, with spot prices fluctuating around $4,080 per ounce. Support comes from expectations of a Federal Reserve rate cut at the October 28–29 meeting and the recent pullback in U.S. Treasury yields ahead of the decision. Headlines about a potential temporary government funding pause in the U.S. and delayed data releases enhance gold’s role as a defensive asset, while September inflation came in slightly below expectations, reinforcing the case for policy easing. In addition, fund inflows into gold have stayed strong after October’s price spike.
The fundamental backdrop remains constructive: World Gold Council data point to renewed net purchases by central banks late in the summer, and October saw more active investment flows into “paper” gold as market volatility rose and real yields eased. Risks to this view include a more cautious Fed tone and a brief dollar rebound after the decision, but these are offset by steady institutional demand and ongoing geopolitical uncertainty.
Trade idea: BUY 4075.00, SL 4025.00, TP 4225.00
#SP500: BUY 6785, SL 6705, TP 7025
U.S. equities enter the week on strong footing: the S&P 500 holds near 6,790 after softer September inflation data and lower government bond yields. Markets are focused on the Fed’s October 28–29 decision; the prevailing view anticipates another rate cut, which would reduce borrowing costs and support the valuation of future earnings. The reporting season is in full swing, with expectations for double-digit earnings growth for 2025 and a busy week of results from index constituents.
Fundamentally, the index benefits from a combination of easing rate pressure, resilient profit expectations in sectors tied to digital infrastructure and AI-related investment, and a broadly steady consumer backdrop. Key risks include any prolonged disruption to federal services that could distort the macro data flow, and the chance of tighter corporate guidance given currency strength and fluctuations in global electronics demand.
Trade idea: BUY 6785, SL 6705, TP 7025
#BRENT: SELL 66.30, SL 68.00, TP 61.20
Brent trades around $66 per barrel. The weekly news flow is mixed: on one hand, infrastructure risks linger in the Black and Baltic Sea regions; on the other, international agencies flag accelerating supply growth alongside moderate demand. The earlier OPEC+ decision to allow a marginal output increase and revised surplus projections effectively cap prices despite sporadic supply disruptions and sanctions-related headlines.
By late October, industry assessments imply a gradual rebuild in inventories and a softer price path into Q4, albeit with elevated headline-driven volatility. Additional pressure comes from a cooler global backdrop and rising non-OPEC+ production, while any Fed rate cut would only partly lift the commodity complex. Short-position risks include an escalation of geopolitical tensions that threatens exports and an unexpectedly sharp draw in weekly U.S. stock data.
Trade idea: SELL 66.30, SL 68.00, TP 61.20
Trade ideas

US500Trading forex based on strong fundamentals is beneficial because it allows investors to make informed decisions grounded in real economic data rather than speculation. By analyzing key indicators like interest rates, inflation, GDP growth, employment, and geopolitical stability, a trader can anticipate currency movements driven by macroeconomic forces. This approach helps identify long-term trends and reduces emotional or impulsive trading, offering more consistent and sustainable profits. In essence, good fundamentals turn forex trading from a gamble into a strategic investment rooted in economic reality.

S&P 500 ready for correction?Hi Guys,
The sharp selloff on the US indices recently was a sign of further selling to come on the US Indices. As with just about all corrections there is the selling pressure in the form of an engulfing candle or breach of support etc, that indicates that the correction is imminent.
There is strong confluence to support a case for a nice pullback.
Firstly index is approaching 7000. Psychological number and if one takes a look at every time 1000 points has been reached the SP 500 has had a pullback.
Secondly the 1.618 fib retracement of the most recent correction is almost exactly at the 7000 mark.
Last of all , trendline resistance from recent price action and also from last few years lies in same area.
Sell trades using lower time frames, with price action candlestick chart patterns could result in some nice risk to reward trades.
Safe Trading all

US stocks hit record highs on better-than-expected CPI
The Sep US CPI indicated that tariff-driven inflation has not materialized, reinforcing the Fed’s dovish policy stance and driving US equities to new record highs. The prevailing view in the market remains with “Don’t fight the Fed.” The stock market’s impressive resilience, defying the typical seasonal weakness through Oct, reflects a dovish Fed stance amid the absence of recession signals.
The S&P; 500 remained within the ascending channel, reaching a new high at 6,800. Diverging bullish EMAs suggest that the bullish structure may extend further. If the index closes above 6,800, it could advance toward 6,900. Conversely, a drop below 6,800 may lead the price to retreat toward 6,700, which coincides with EMA21.
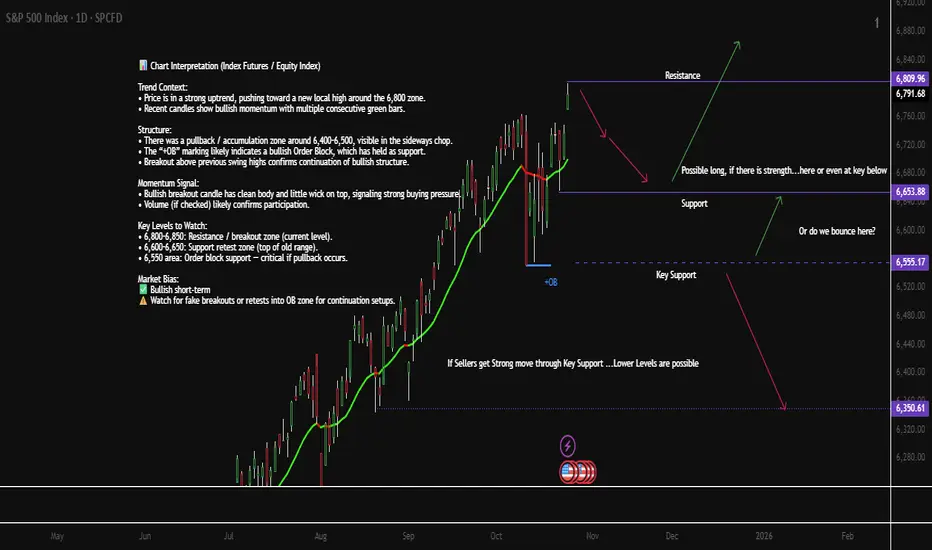
Chart Interpretation (Index Futures / Equity Index) SPX / S&PChart Interpretation (Index Futures / Equity Index)
TECHNICAL ANALYSIS
Trend Context:
• Price is in a strong uptrend, pushing toward a new local high around the 6,800 zone.
• Recent candles show bullish momentum with multiple consecutive green bars.
Structure:
• There was a pullback / accumulation zone around 6,400–6,500, visible in the sideways chop.
• The “+OB” marking likely indicates a bullish Order Block, which has held as support.
• Breakout above previous swing highs confirms continuation of bullish structure.
Momentum Signal:
• Bullish breakout candle has clean body and little wick on top, signaling strong buying pressure.
• Volume (if checked) likely confirms participation.
Key Levels to Watch:
• 6,800–6,850: Resistance / breakout zone (current level).
• 6,600–6,650: Support retest zone (top of old range).
• 6,450 area: Order block support — critical if pullback occurs.
Market Bias: Bullish short-term
Watch for fake breakouts or retests into OB zone for continuation setups.
FUNDEMENTAL ANALYSIS
U.S. Market Key Events — Week of Oct 27–31
Mon Oct 27
• 4:00 AM — 🇪🇺 German IFO Business Climate (watch EUR tone early session)
Tue Oct 28
• 9:00 AM — 🇺🇸 Richmond Manufacturing Index
• Tentative — 🇺🇸 CB Consumer Confidence
Wed Oct 29
• 9:00 AM — 🇺🇸 Pending Home Sales m/m
• 1:00 PM — 🇺🇸 Federal Funds Rate Decision (FOMC)
• 1:30 PM — 🇺🇸 FOMC Press Conference (high impact)
Thu Oct 30
• Tentative — 🇺🇸 Advance GDP q/q
• Tentative — 🇺🇸 Advance GDP Price Index
U.S.–China Trade Talks (market sensitivity risk)
Fri Oct 31
• Tentative — 🇺🇸 Core PCE Price Index m/m
• Tentative — 🇺🇸 Employment Cost Index q/q
📝 Focus on FOMC (Wed), GDP & Trade Talks (Thu), Core PCE (Fri) — high impact sessions for S&P / Dow / USD.
SPX into the new weekWe either pop 6800 on good news or retrace to test support.That looks to be the pattern we are trading uneless it breaks

US500 Surges On Softer US CPI DataFundamental & Sentiment Analysis
The US500 surged this week after the release of cooler than expected US CPI data. This bolstered expectations for further rate cuts by the Fed at its 28–29 Oct meeting. Investor sentiment turned sharply bullish, pushing the index to new record highs near 6,792 on Friday.
The inflation report for September 2025 surprised markets to the downside: headline US CPI rose 0.3% (3.0% YoY) and core CPI rose 0.2% (3.0% YoY), both below forecasts.
This moderation fueled optimism that inflation is cooling sustainably, raising the odds of a 25 basis point rate cut at the upcoming FOMC meeting. Following the CPI release, the US500 rose to 6,762 intraday, just shy of its all-time high.
Technical Outlook
The outlook for the coming week is moderately bullish, with potential consolidation at record highs. Momentum remains supported by softer inflation, dovish Fed expectations, and continued strong corporate earnings.
However, technical analysts warn of short-term pullbacks as the index tests critical resistance levels. A correction toward 6,720 would be healthy before a move higher toward 7,000.
The US stock market is positioned for further gains into year-end if inflation stays contained and the Fed confirms a sustained policy easing trajectory.
Analysis is by Terence Hove, Senior Financial Markets Strategist at Exness

REVEALED: What REAL Trading isWhat is Financial Trading in a nutshell?
For the last 20 years I’ve summed up trading as just ONE BIG AUCTION.
It sounds like a fast-paced, high-risk, Wall Street movie scene with shouting brokers and skyrocketing graphs.
But, here’s the truth:
Trading is the most relaxing thing – when done right!
It’s a lifestyle, a process, and a mindset.
It’s one thing where YOU can take your finances on an exciting adventure — if you do it right.
Whether you’re a complete newbie or a seasoned trader, here is a refresher to dive into what trading really is.
Trading Is More Than Just an Auction of buying or selling…
Let’s clear up one thing first.
For the last 20 years I’ve summed up trading as just ONE BIG AUCTION.
And yes it is one big market of buying and selling – but that’s only part of it.
TRADING is all about solving a puzzle of analyzing probabilities, managing risks, and navigating uncertainty.
Every time you enter a trade (buy or sell), you’re making an educated guess on where the market is LIKELY to go next.
And you’re placing a bet on human behavior — how millions of people around the world (with their emotions, news reactions, and strategies) will affect the price of an asset.
That’s the technical side of trading. Here’s where I want you to integrate trading into your life…
Trading Is A Lifestyle
It’s not just about making money — it’s about integrating trading into your lifestyle.
You need to find the right markets, time, time frame, styles, strategy and approach.
Trading is like hitting the gym; it requires discipline, consistency, and a whole lot of sweat equity.
And just like you don’t get a six-pack or lose weight after ONE workout.
You shouldn’t expect to master trading overnight.
It’s a routine you build day by day.
A typical trading day might include:
Pre-market analysis (Weekly bias):
You need to check what’s happening in the world with other markets with both Asian, American, European and even London session.
You also need to look at the US Economic Calendar to see what news is arising for the week.
Analyse and Execute trades:
Once done the pre analysis, you need to do the actual analysis. See what trades are lining up according to your proven strategy. And if anything looks good to go EXECUTE.
Review and track your trades:
This is where you will reflect on what went right and what went wrong. This is where you’ll track and review your trades that lined up to add to your journal.
The key takeaway: Trading isn’t just what you do; it’s who you become.
Trading Is a Forever Game
When it comes to trading, think long-term.
Like, REALLY long-term. Because trading is a forever game.
Unlike sports with seasons or video games with levels, trading doesn’t end.
The markets will be there tomorrow, next week, and 100 years from now.
And as a trader, your mission is to stay in the game for the long haul.
That means managing your risk, protecting your capital, and always looking to improve your skills.
Trading Is A Business Where YOU Are The Boss
The beauty of trading?
You’re in control.
Trading is a business, and you are the CEO.
You call the shots, decide when to enter and exit trades, and ultimately, you take control of your financial destiny.
Like any business, trading requires:
Planning and strategy:
Risk and reward management:
Tracking performance and improving:
And, just like in any business, you’ll make mistakes.
But those mistakes are not failures; they’re lessons.
You learn from them, adapt, and get better. That’s what makes trading such an empowering journey.
Final Words:
Financial trading is more than a job, a hobby, or a side hustle.
It’s a process-driven approach to decision-making, a lifestyle to live, a forever game to play, and a business where you’re in charge.
If done right, trading can be one of the most rewarding pursuits you’ll ever undertake.
Key Takeaways
Trading is a process: Follow a set strategy, criteria, and rules for success.
Trading is a lifestyle: Incorporate trading into your daily routine and stick with it consistently.
Trading is a forever game: It’s not a one-time event; it’s a lifelong pursuit.
Trading is a business: You’re the CEO — plan your moves, manage your risk, and take charge of your financial destiny.

The Real 3 Thrills of Trading: (Hint: It’s Not When You Think)Trading.
It’s a game.
A challenge.
A journey.
It’s a lifestyle.
And yes having a passion to trade is half the battle won.
But it’s not just about winning.
If you feel thrill when you win a trade. Then you’re enjoying the wrong parts of successful trading.
If you’re in a winning streak and feel thrill – Same story.
Because you know the losses are inevitable.
And you know the drawdown is coming too.
So that’s why you need to enjoy the FULL journey…
And here’s where you should feel the THRILL for trading.
THRILL #1: When you survive the drawdown
Like I said earlier, your next drawdown is coming.
Your BIGGEST drawdown is coming.
So you need to embrace and prepare for these times.
I have gone through more drawdowns than you can imagine.
And yet my portfolio keeps heading to all time highs.
HOW?
Well you need to endure the drawdown.
You need to keep following your rules and strategy.
And when the market environment is more favourable, your portfolio will turn from down to up.
And it will continue to go up until you not only recover – but your portfolio breaks to all time highs.
And when you survive the drawdown – FEEL THRILL!
THRILL #2: Knowing your strategy works (through the good and bad)
The markets are like an ocean.
Waves come and go, the tide shifts, and sometimes there’s a storm.
If you go look at the US Economic Calendar you’ll know the market is about to swivel in ways you can’t even imagine!
The thrill doesn’t come from riding one good wave (winner).
It should come from taking every trade that lines up perfectly with the strategy.
If you followed your rule and criteria to a T – Feel THRILL that you are on the right path to success.
Regardless of whether the trade is a winner or a loser.
See the bigger picture and what it can do for you!
THRILL #3: The Love for the Game and the benefits of trading
Remember I said trading is more than just money.
Trading helps with everything in your life!
It teaches you to be a risk manager.
It teaches you how to toughen your mind.
It teaches you how to be disciplined, consistent.
And it teaches you how you can CREATE your own wealth without depending on a BOSS.
The Challenge, the Mental Toughness, and the Growth
And the thrill?
FINAL WORDS – Celebrate the Right Thrills
The thrill of trading isn’t about the quick wins, the big gains, or riding the market waves.
It’s about resilience. Mastery. Passion. Patience. And growth.
Well fall in love with what trading has offered and taught you, other than the money aspect.
It’s not just about making money; it’s about becoming better. Sharper. Wiser.
Every trade you take is a lesson.
Every loss is a learning opportunity.
And every time you wake up excited to face the market, that’s the thrill of passion.
Because trading isn’t just a job.
It’s a craft.
A skill.
A calling.
If you find yourself waking up early, excited to start your day, knowing full well there’s a challenge waiting for you—you’ve found the thrill.
If you find weekends are not ending early enough because you want to trade – that’s a thrill!
Let’s sum up some reasons to feel THRILL when trading.
THRILL #1: When you survive the drawdown
THRILL #2: Knowing your strategy works (through the good and bad)
THRILL #3: The Love for the Game and the benefits of trading
Do you agree and how has trading changed your life?
WHY Financial Markets Will Always ChangeChange is the only constant in the financial markets.
And that’s why it’s important to stay humble and grounded because everyday is a UNIQUE day to the markets and the pre market movers.
No matter how much experience you have, you can’t get too comfortable with the way things are.
Because we know they won’t stay that way for long.
The markets are like a living, breathing entity—constantly shifting, evolving, and transforming.
And now I want to explain why I believe the markets are ALWAYS changing.
REASON #1: The Fresh Faces of Trading
Continuous flow of new and old traders.
Every day, new traders enter the game while seasoned veterans continue to play.
This constant influx of fresh perspectives creates a dynamic market environment.
New traders bring innovative strategies, emotions, and decision-making processes into the market, while the veterans tweak their systems to keep up with ever-evolving trends.
And so the demand and supply is constantly shifting in new ways – which changes the markets style, moves and algorithms.
End of the day, the market is one big AUCTION as I have told my members for the last 15 years.
They’re influenced by the people who trade in them.
REASON #2: The Never-Ending Stream of New Information
New information – shining on the market
Here’s the thing: the financial markets thrive on information.
New data points, news reports, earnings releases, and economic indicators flow in non-stop, impacting prices and trends at every turn.
Sometimes there is good days with amazing news coming out.
Other days there is catastrophic news.
And then you get the mundane boring days with no reaction.
If a central bank announces an unexpected interest rate cut, or if a company releases disappointing earnings, the market is going to react swiftly.
Even geopolitical events and natural disasters play their part in shaping the direction of markets.
So no matter how much analysis you’ve done, be prepared for the fact that new info can change the game in an instant.
REASON #3: Micro, Macro, and Inner Fundamentals
New micro, macro and inner fundamentals
The fundamentals that underpin market movements are far from static.
On the micro level, individual companies are constantly evolving.
New product launches
Mergers and acquisitions
News and earning reports
Prospects
Leadership changes can all affect a stock’s price.
Zoom out a little, and you’ve got macro fundamentals.
These show the big-picture factors like:
Interest rates
inflation, and
unemployment rates,
All of which influence the broader economy.
REASON #4: Global Economies and World Events
World info from the economies
The financial markets are more interconnected than ever.
What happens in one part of the world now ripples through the rest of the global economy in minutes, not weeks.
A change in China’s trade policy can directly impact European markets.
An unexpected election result in America could influence the South African or UK equities.
REASON #5: The Endless Actions of Traders
Constant actions of traders around the world
Then, of course, we have the daily actions of traders around the world.
Every time a buy or sell order is placed, the market shifts.
I like to think of it as the Stock Market’s Butterfly-Effect.
These actions are a direct result of human behavior—our emotions, analysis, strategies, and even fear and greed.
When traders believe in a trend, they pile on, creating momentum.
But when panic strikes, markets can spiral down in a blink of an eye.
Since traders are constantly reacting to new information, the market flows like an ever-shifting river.
Conclusion
The financial markets are in a constant state of flux.
They will forever change and we need to learn how to evolve, adapt or die trying.
But there is one thing that is inevitable.
The markets will KEEP moving and trending. And for that, we will always be profiting in the medium to long term.
Let’s sum up why the markets will always change…
REASON #1: The Fresh Faces of Trading
Continuous flow of new and old traders.
REASON #2: The Never-Ending Stream of New Information
New information – shining on the market
REASON #3: Micro, Macro, and Inner Fundamentals
New micro, macro and inner fundamentals
REASON #4: Global Economies and World Events
World info from the economies
REASON #5: The Endless Actions of Traders
Constant actions of traders around the world

US500 Actionable Long Bullish 5 stack fundamental 6 stacks TechCMCMARKETS:SPX500Z2025
Fundamental: Bullish (5 stacks).
Technical: Bullish (6 stacks, Actionable 6+).
20-word summary: Earnings resilience and easing expectations support bids. EMAs aligned, RSI constructive. Dips bought while above 6675; trend continuation favored highs.
Trade plan (LONG): SL 107.768, TP 280.1968 (ATR method).
All stars align however stay sharp, stay nimble as tariffs loom.

SPX for Thursday October 23rdSimilar pattern to Dax.There is now an uptrend.Running into resistance.Lets see what happens

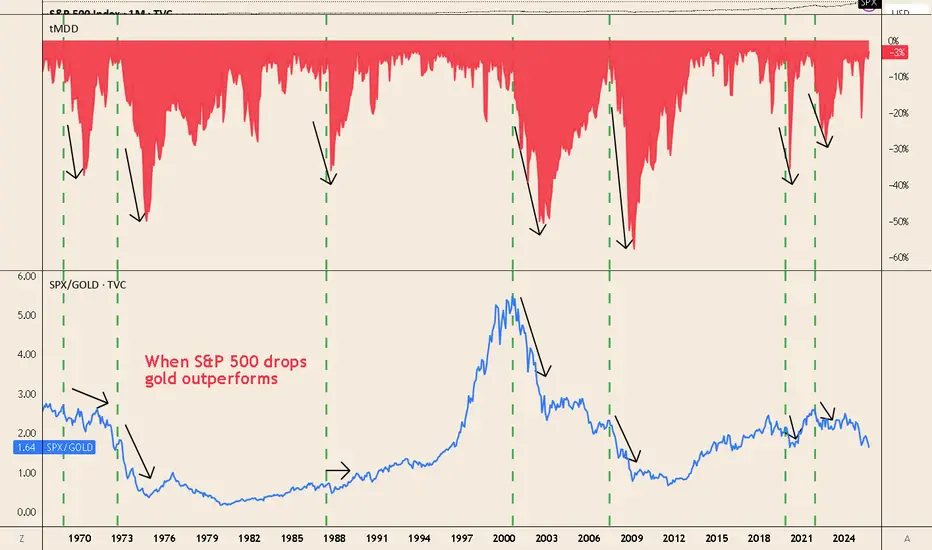
When Equities Fall, Gold Outperforms — SPX/Gold Says It All📊 Key insight
-Every major equity drawdown coincides with a drop in the SPX/Gold ratio — meaning gold outperforms stocks.
📉 What the chart shows
-1973–74 (stagflation): deep S&P 500 drawdown, SPX/Gold collapses.
-2000–02 (tech bust): ratio peaks ~5, then trends lower as gold rises and equities fall.
-2008–11 (GFC): brief liquidity hit to gold, then SPX/Gold plunges as gold rallies.
-2020 (COVID shock): rapid drop in SPX/Gold during equity sell-off.
-2022 bear market: ratio turns down again with inflation and rate stress.
Why it happens
-During market stress, investors seek safe collateral → gold demand spikes.
-Real rates and recession fears hurt equities more than gold.
-Silver carries industrial exposure, gold acts as a true safe haven.
🛡️ How to use it
-A gold allocation helps hedge against equity drawdowns.
-Long TVC:GOLD / short TVC:SPX (ratio trade) historically reduces portfolio volatility.
-Note: gold can dip during initial liquidity shocks (e.g., 2008, Mar 2020) — but recovers faster than equities.
Sovereign Debt Explained in the Global MarketIntroduction
Sovereign debt, also known as government debt or public debt, represents the money that a national government borrows to finance its expenditures and obligations. It is one of the most significant pillars of the global financial system, influencing everything from international trade and exchange rates to global market stability and development. Governments borrow to cover budget deficits, fund infrastructure, respond to crises, or stimulate economic growth. The management, structure, and sustainability of sovereign debt play a crucial role in determining a country's economic credibility and its integration into the global market.
In today’s interconnected world, sovereign debt is not an isolated national issue—it has far-reaching implications across borders. When a country defaults or faces a debt crisis, the ripple effects can be felt throughout the international financial system. Therefore, understanding sovereign debt in the context of the global market is essential to comprehend global economic dynamics, investor confidence, and long-term growth prospects.
1. Concept and Nature of Sovereign Debt
Sovereign debt is the total amount of money a government owes to external and internal creditors. It can take the form of bonds, loans, or other financial instruments issued by the government to domestic investors or foreign entities. Governments typically issue sovereign bonds—long-term or short-term securities that promise repayment of principal plus interest—to finance their fiscal needs.
There are two main categories of sovereign debt:
Domestic Debt:
Borrowed in the country’s own currency and often from local financial institutions or citizens. Domestic debt reduces exposure to foreign exchange risks but can crowd out private investment if excessive.
External Debt:
Borrowed from foreign creditors, including international organizations, foreign governments, and investors. It is often denominated in foreign currencies such as the U.S. dollar, euro, or yen. External debt exposes a country to exchange rate risks and global financial fluctuations.
Sovereign debt differs from corporate or personal debt because governments have unique powers—they can print money, tax citizens, and control monetary policy. However, these powers are not limitless, and excessive borrowing can lead to inflation, devaluation, or default.
2. Importance of Sovereign Debt in the Global Market
Sovereign debt plays several crucial roles in the global financial system:
Financing Government Expenditure:
Governments use debt to fund projects that stimulate economic growth—such as infrastructure, education, defense, and social welfare. This borrowing supports public services and long-term development.
Macroeconomic Stability and Fiscal Policy:
Borrowing helps smooth economic cycles. During recessions, governments may borrow more to stimulate demand and reduce unemployment. During booms, they may pay down debt to avoid overheating the economy.
Benchmark for Global Financial Markets:
Sovereign bonds, especially those issued by stable economies (like U.S. Treasury bonds), act as benchmarks for global interest rates. Investors worldwide use these as reference points to assess risk premiums on other assets.
Investment and Safe Haven Asset:
Many institutional investors, including central banks and pension funds, hold sovereign bonds as low-risk investments. U.S., Japanese, and German government bonds are considered “safe haven” assets during global uncertainty.
Indicator of Economic Health:
The level and sustainability of sovereign debt indicate a country’s fiscal health. A high debt-to-GDP ratio may raise concerns about solvency, while moderate debt can signal sound economic management.
3. Globalization and the Expansion of Sovereign Debt Markets
The globalization of finance has transformed sovereign debt markets dramatically. In the 20th and 21st centuries, capital mobility increased, allowing investors to buy foreign government bonds easily. Emerging markets also gained access to international borrowing, leading to a global expansion of sovereign debt.
Some key drivers of this trend include:
Financial Liberalization: Many developing countries opened their capital markets, allowing foreign investors to purchase local government bonds.
Technological Advancements: Digital trading platforms and global financial networks facilitated cross-border investment.
Global Savings Glut: High savings in developed nations, such as Japan and China, increased the demand for sovereign debt from other countries.
Monetary Policy in Advanced Economies: Low interest rates in developed countries pushed investors to seek higher yields in emerging markets, expanding their sovereign bond markets.
As a result, sovereign debt has become deeply intertwined with global capital flows. Investors in one country routinely hold the debt of others, linking their financial fortunes. This interdependence strengthens global economic cooperation but also amplifies systemic risks.
4. Determinants of Sovereign Debt Sustainability
The sustainability of sovereign debt depends on whether a government can service its obligations without resorting to excessive borrowing or risking default. Key determinants include:
Debt-to-GDP Ratio:
A widely used measure of a country’s debt burden. A high ratio may indicate financial strain, but the threshold varies across countries depending on growth rates and interest costs.
Interest Rate and Growth Differential:
If economic growth exceeds the interest rate on debt, the debt ratio tends to stabilize or decline over time. Conversely, if interest rates rise faster than growth, debt can become unsustainable.
Fiscal Balance:
Governments with persistent fiscal deficits (spending exceeding revenue) may accumulate unsustainable debt levels.
Exchange Rate Stability:
For countries with large external debt denominated in foreign currencies, exchange rate depreciation can inflate the debt burden.
Investor Confidence:
Global investors’ perception of a country’s economic management directly affects borrowing costs. Confidence can be influenced by political stability, monetary policy, and institutional credibility.
Debt Structure and Maturity Profile:
Short-term or variable-rate debt poses higher rollover and interest rate risks than long-term, fixed-rate debt.
5. Sovereign Debt Crises: Causes and Consequences
Sovereign debt crises occur when governments cannot meet their debt obligations, either through repayment or servicing interest. Such crises can arise due to poor fiscal management, external shocks, or global financial contagion.
Major Causes:
Excessive borrowing during boom periods followed by economic downturns.
Currency mismatches between debt and revenue.
Sudden stops in capital inflows or rising global interest rates.
Political instability and policy mismanagement.
Consequences:
Default and Restructuring: Governments may renegotiate terms with creditors or suspend payments temporarily.
Economic Recession: Austerity measures to reduce debt often suppress growth and increase unemployment.
Inflation and Currency Collapse: If debt is monetized (financed by printing money), it can lead to hyperinflation.
Loss of Credibility: A country’s access to international markets diminishes, raising borrowing costs for years.
Historical Examples:
Latin American Debt Crisis (1980s): Triggered by rising U.S. interest rates and oil price shocks.
Asian Financial Crisis (1997): Currency collapses led to debt defaults in several Asian economies.
Greek Debt Crisis (2010s): Excessive government spending and structural inefficiencies led to massive bailouts from the EU and IMF.
Argentina (multiple defaults): Chronic fiscal mismanagement and political instability have caused repeated sovereign defaults.
6. Role of International Institutions in Sovereign Debt Management
Institutions such as the International Monetary Fund (IMF), World Bank, and regional development banks play vital roles in managing sovereign debt crises and promoting fiscal stability.
IMF: Provides financial assistance and policy advice to countries facing balance-of-payments or debt crises. Its programs often come with fiscal and structural reform conditions.
World Bank: Focuses on long-term development financing and helps countries design sustainable debt management strategies.
Paris Club and London Club: Groups of official and private creditors that coordinate debt restructuring efforts for distressed sovereign borrowers.
Credit Rating Agencies (CRAs): Agencies like Moody’s, S&P, and Fitch assess sovereign creditworthiness, influencing borrowing costs in the global market.
These institutions aim to ensure that countries maintain fiscal discipline while providing relief during crises. However, critics argue that their policies sometimes prioritize creditor interests over social welfare, especially through austerity measures.
7. Sovereign Debt and Emerging Markets
Emerging markets have become significant participants in the global sovereign debt landscape. Countries like India, Brazil, Indonesia, and South Africa issue bonds in both domestic and international markets. While this enhances their access to capital, it also exposes them to global volatility.
Challenges Faced by Emerging Economies:
Currency risk due to foreign-denominated debt.
Limited investor confidence compared to developed nations.
Higher borrowing costs and vulnerability to global interest rate changes.
Political and policy uncertainties affecting credit ratings.
Despite these challenges, emerging market sovereign bonds attract global investors seeking higher yields, contributing to portfolio diversification.
8. The Future of Sovereign Debt in the Global Market
As the global economy evolves, the nature of sovereign debt is also transforming. Several trends are shaping its future:
Rising Global Debt Levels:
The COVID-19 pandemic and subsequent fiscal stimulus programs have driven global public debt to record highs, surpassing 100% of global GDP in many advanced economies.
Green and Sustainable Bonds:
Many governments now issue green bonds to finance environmentally sustainable projects. These instruments align debt issuance with climate goals and attract ESG-focused investors.
Digitalization and Transparency:
Blockchain technology and digital platforms are enhancing debt transparency, improving trust and efficiency in bond markets.
Geopolitical Shifts:
Rivalries among major economies, such as the U.S. and China, are influencing global debt markets through changes in capital flows and currency alignments.
Debt Relief and Restructuring Mechanisms:
Post-pandemic, international cooperation has increased to support low-income countries through debt relief initiatives like the G20 Common Framework.
Conclusion
Sovereign debt is both a tool of economic development and a potential source of financial instability. In the global market, it functions as a key instrument for investment, fiscal policy, and international cooperation. Properly managed, it enables nations to build infrastructure, stimulate growth, and enhance welfare. Mismanaged, it can trigger crises that ripple across the world economy.
The challenge for policymakers is to maintain a balance—borrowing enough to foster development while ensuring sustainability and market confidence. As the global financial landscape evolves, transparency, innovation, and prudent fiscal governance will determine how effectively sovereign debt continues to serve as a cornerstone of the global economy.

SPX .Pulling back a tadBuyers will want to keep it above 6700
6680-6695 is a bull test area if it gets there

ESG Investing and Green FinanceIntroduction
In the 21st century, global finance has undergone a profound transformation. Investors, corporations, and governments are increasingly recognizing that economic growth must go hand in hand with environmental protection, social responsibility, and ethical governance. This shift has given rise to two major trends — ESG (Environmental, Social, and Governance) investing and Green Finance. Both concepts aim to align financial decision-making with sustainability goals, addressing global challenges such as climate change, inequality, and responsible corporate behavior. ESG investing and Green Finance are not just moral imperatives; they are strategic approaches that seek long-term value creation, risk management, and the transition to a low-carbon economy.
1. Understanding ESG Investing
ESG investing refers to an investment strategy that incorporates environmental, social, and governance factors into financial analysis and portfolio management. It goes beyond traditional financial metrics by assessing how companies manage sustainability-related risks and opportunities.
Environmental criteria evaluate how a company impacts the planet — through carbon emissions, waste management, water usage, renewable energy adoption, and biodiversity protection.
Social criteria examine how a company treats people — including employees, customers, suppliers, and local communities. It focuses on labor rights, diversity, equality, workplace safety, and human rights.
Governance criteria assess corporate ethics, transparency, board diversity, executive compensation, and shareholder rights.
In essence, ESG investing combines profitability with purpose, allowing investors to generate financial returns while contributing to positive social and environmental outcomes.
2. Evolution and Growth of ESG Investing
The origins of ESG investing can be traced back to socially responsible investing (SRI) movements of the 1960s and 1970s. Activist investors avoided industries such as tobacco, weapons, or apartheid-linked businesses. However, ESG investing evolved beyond exclusionary screening to focus on proactive investment in sustainable and responsible companies.
A significant milestone occurred in 2006, when the United Nations launched the Principles for Responsible Investment (UNPRI), encouraging institutional investors to integrate ESG principles into their investment decisions. Since then, ESG investing has grown exponentially.
By 2025, the global ESG assets under management (AUM) are projected to exceed $50 trillion, representing more than one-third of total global assets. Major asset managers like BlackRock, Vanguard, and Fidelity have incorporated ESG frameworks into their portfolios, while ESG-focused funds have outperformed traditional funds in many market cycles, particularly during crises such as the COVID-19 pandemic.
3. Key Components of ESG
(a) Environmental Factors
Environmental aspects are central to ESG investing. Investors assess a company’s carbon footprint, energy efficiency, waste disposal practices, and compliance with environmental laws. For instance, companies that transition toward renewable energy sources or adopt circular economy principles are considered environmentally sustainable.
Important sub-factors include:
Greenhouse gas (GHG) emissions and carbon neutrality goals
Renewable energy investment
Water conservation and pollution control
Sustainable supply chains
Biodiversity preservation
For example, Tesla and Ørsted attract ESG investors for their leadership in clean energy and low-carbon technologies.
(b) Social Factors
The social dimension emphasizes a company’s treatment of people and communities. This includes fair labor practices, human rights, product safety, customer privacy, and diversity initiatives. A company’s reputation and long-term success often depend on social responsibility and stakeholder trust.
Key areas include:
Employee welfare and workplace safety
Gender and racial diversity in leadership
Consumer protection and ethical marketing
Community development programs
Supply chain ethics
Firms like Unilever and Patagonia are known for integrating social responsibility into their corporate strategy, enhancing both brand loyalty and long-term profitability.
(c) Governance Factors
Governance ensures accountability, transparency, and ethical leadership. It involves assessing how decisions are made within an organization and whether management aligns with shareholders’ and stakeholders’ interests.
Governance evaluation considers:
Board composition and independence
Executive pay and accountability
Anti-corruption policies
Shareholder voting rights
Ethical corporate conduct
Poor governance can lead to scandals and losses, as seen in corporate collapses like Enron or Wirecard, where lack of oversight and transparency destroyed investor confidence.
4. ESG Investing Strategies
Investors use several methods to implement ESG principles:
Negative Screening: Excluding companies involved in harmful industries (e.g., fossil fuels, tobacco, or weapons).
Positive Screening: Selecting companies that perform better on ESG metrics than their peers.
Best-in-Class Approach: Investing in the most sustainable companies within each sector.
Thematic Investing: Focusing on specific sustainability themes such as renewable energy, clean water, or gender equality.
Impact Investing: Targeting measurable social and environmental outcomes alongside financial returns.
ESG Integration: Incorporating ESG data into traditional financial analysis to evaluate overall risk-adjusted returns.
These approaches allow investors to align their portfolios with their values and long-term sustainability goals.
5. Importance and Benefits of ESG Investing
ESG investing offers multiple advantages to investors, businesses, and society.
Risk Mitigation: Companies with strong ESG performance tend to manage risks better, reducing exposure to legal, environmental, and reputational crises.
Financial Performance: Numerous studies show a positive correlation between ESG integration and long-term financial returns. Sustainable firms are often more efficient, innovative, and resilient.
Investor Demand: Younger generations, especially Millennials and Gen Z, increasingly prefer ethical investments that align with their values.
Regulatory Support: Governments and regulators are promoting ESG disclosures, creating an environment where sustainability becomes a necessity rather than a choice.
Corporate Reputation: Strong ESG performance enhances brand image, attracting customers, investors, and top talent.
6. Understanding Green Finance
While ESG investing focuses on evaluating sustainability within investments, Green Finance refers to financial instruments and services that directly support environmentally beneficial projects. It aims to mobilize capital toward green initiatives that promote climate resilience, energy efficiency, and ecological sustainability.
Green Finance includes a wide range of products such as:
Green Bonds – bonds issued to finance renewable energy, clean transportation, and waste management projects.
Green Loans – loans with favorable terms for sustainable projects.
Green Mutual Funds and ETFs – investment funds focusing on companies or projects that meet environmental standards.
Carbon Markets and Credits – mechanisms that incentivize emissions reduction.
Sustainable Insurance and Banking – financial institutions offering eco-friendly products and services.
In essence, Green Finance channels money into projects that contribute to a low-carbon and sustainable future.
7. The Rise of Green Finance Globally
Green finance gained global recognition after the 2015 Paris Agreement, which called for aligning financial systems with climate goals. The agreement encouraged nations to mobilize trillions of dollars in climate finance to limit global warming to below 2°C.
Leading economies such as the European Union, China, and the United States have established green finance frameworks.
The EU Green Deal and EU Taxonomy for Sustainable Activities provide a clear classification system for green investments.
China’s Green Bond Endorsed Project Catalogue guides green bond issuance and has made China one of the largest green bond markets globally.
Multilateral institutions such as the World Bank and Asian Development Bank support developing nations in adopting green finance principles.
According to the Climate Bonds Initiative, global green bond issuance surpassed $600 billion in 2023, signaling the growing importance of sustainability-linked finance.
8. Relationship Between ESG Investing and Green Finance
While both concepts share sustainability as their foundation, they differ in scope and application.
ESG investing focuses on evaluating corporate behavior and integrating sustainability into investment decisions across all industries.
Green Finance specifically directs capital toward projects that have clear environmental benefits.
However, the two are interconnected. ESG investors often allocate capital to green financial instruments, while green finance initiatives rely on ESG metrics to ensure accountability and transparency. Together, they form the backbone of sustainable finance, promoting a more inclusive and climate-conscious global economy.
9. Challenges in ESG Investing and Green Finance
Despite their growth, both ESG investing and green finance face several challenges:
Lack of Standardization: Different countries and rating agencies use varied ESG criteria, leading to inconsistent assessments and “greenwashing.”
Greenwashing Risks: Some companies exaggerate their sustainability claims to attract investors without actual environmental commitment.
Data Availability: Reliable ESG data and performance metrics are limited, especially in developing markets.
Short-Term Investor Mindset: Many investors prioritize short-term gains over long-term sustainability impacts.
Regulatory Barriers: Inconsistent regulations across jurisdictions make it difficult to measure and compare ESG performance globally.
Transition Costs: Shifting to sustainable business models requires upfront investments that may deter smaller firms.
Addressing these challenges requires global cooperation, transparent reporting, and strong regulatory frameworks.
10. The Future of ESG and Green Finance
The future of finance is undeniably green and responsible. Governments, institutions, and individuals are realizing that sustainability is essential for economic resilience and planetary survival. Key future trends include:
Mandatory ESG Disclosure: Regulators in the EU, India, and the US are introducing compulsory ESG reporting standards for corporations.
Technology Integration: Artificial intelligence, blockchain, and big data analytics are improving ESG measurement and transparency.
Sustainable Development Goals (SDGs): ESG investing and green finance will play vital roles in achieving the United Nations’ 17 SDGs by 2030.
Green Central Banking: Central banks are increasingly integrating climate risks into monetary policies and lending frameworks.
Emerging Market Participation: Developing countries are adopting green finance to address energy transitions and attract foreign investment.
Ultimately, ESG and green finance are not temporary trends — they represent a long-term transformation of the global financial system.
Conclusion
ESG investing and Green Finance have redefined how the world views the relationship between money, ethics, and the environment. They demonstrate that profitability and sustainability can coexist, driving innovation, resilience, and inclusive growth. As climate change intensifies and social challenges persist, the role of finance as a catalyst for sustainable development has never been more crucial.
By integrating ESG principles and promoting green financial instruments, investors and policymakers can pave the way toward a more sustainable, equitable, and prosperous global economy. The future belongs to those who not only generate wealth but also protect the planet and uplift society — a vision where finance serves humanity, not just profits.

SP500 7000+++++In our latest analysis, we emphasized this region as decisive for seeking new highs.
Not much has changed since the last one, it made a small retraction and is already looking for the last ATH again.
Stay tuned in this price region, if it breaks we could soon see SP500 above 7000 points
Become a part of our Forex Dream Community

“SPX – 750-Point Range in Play”Date: 20-10-2025
#SPX - Current Price: $6,664.00
Pivot Point: $6,656.59 Support: $6,518.03 Resistance: $6,796.21
Upside Levels:
L1: $6,938.02 L2: $7,079.83 L3: $7,238.55 L4: $7,397.26
Downside Levels:
L1: $6,375.69 L2: $6,233.35 L3: $6,074.64 L4: $5,915.92
#SPX #TRADINGVIEW #DJI #NDQ # NIFTY

SPX into the open.Monday 20th OctoberLooking pretty bullish.Previous rez was above 6700.Lets see what happens above 6710 area

Or is this profit-taking ahead of year-end rebalancing?Or is this profit-taking ahead of year-end rebalancing?
1. US500 has reclaimed multiple EMAs, but price is still rotating around them—signaling range conditions and a wait for a clear break. With price hovering near the range top, the pullback is possible to extend consolidation or even shift to downtrend.
2. Failure to clear 6700 risks a roll-over beneath the EMAs toward 6500 support.
3. However, a decisive break/close above the 6700 swing high would confirm upside continuation and reopen the uptrend.
4. Equities investors paused ahead of big earnings and a delayed inflation print that could drive moves later this week. Markets were still nursing losses from bank-stress jitters, though solid U.S. regional bank results briefly calmed volatility.
5. Goldman Sachs said hedge funds sold U.S. equities at the fastest pace since early April, led by shorts in Macro Products and single names. U.S. ETF short interest saw its biggest jump in 5+ months, ending a seven-week net-buying streak.
6. Therefore, the failure to make a new high may signal profit-taking pressure, and the price could fall further as we approach year-end.
Analysis by: Krisada Yoonaisil, Financial Markets Strategist at Exness

SPX | DAILY ANALYSIS #6Hello and welcome back to DP.
Let’s kick off the weekday together by analyzing the **S&P 500 Index (SPX)**.
🟠 Market Overview
Previous Close: 6692.50
Current Daily Range: 6678.00 – 6705.80
Asia Session High: 6705.80
Asia Session Low: 6678.00
The index has seen significant selling pressure over the past week. She broke below the previous demand zone at 6715–6700, forming a new demand zone between 6680–6665.
This could suggest:
* Sellers are gaining momentum, OR
* Short positions were liquidated to make room for new entries.
🔵 Key Levels to Watch
Resistance Zone (Upside Target):
6711 – A break and hold above this level could lead to a test of 6735 and potentially new highs near 6755.
Support Zone (Blue Box):
6680 – 6665 – This is a critical support zone.
If broken, we may see the index fall toward:
First Support (Yellow Box): 6645
Deeper Support Zone: 6620 – 6605
If the 6680 zone holds and we see bullish confirmation (e.g., strong buying wicks, volume spike, or bullish engulfing candle), buyers may regain control and push the price back up toward the 6710–6730 range.
🧠 Trading Outlook
Bullish Bias Above: 6711
Bearish Bias Below: 6680
Neutral Zone: 6680–6710 (watch for consolidation or fakeouts)
📌 Note: The current structure suggests we are at a decision point. Be patient, wait for confirmation, and manage your risk accordingly.
Take care and have a great trading day!
For informational purposes only – not financial advice. © DIBAPRISM
Amir D. Kohn

US500 rallied despite lingering risks of regional banks stress
Fears surrounding regional banks that rattled markets quickly faded, as reassuring earnings results and President Trump’s conciliatory tone toward China restored investor confidence.
Earlier this week, Zions Bank and Western Alliance Bank reported losses tied to loan fraud, reviving fears reminiscent of the Silicon Valley Bank collapse. However, stronger-than-expected earnings and limited signs of credit deterioration reassured investors and eased market jitters. Moody’s noted that while concerns over bad loans persist, there is little evidence of systemic risk. They added that regional banks’ key health metrics remain solid.
US500 briefly tested the support at 6530 before approaching the resistance at 6700 again. The index remains above bullish EMAs, indicating a potential extension of bullish momentum.
If US500 closes above 6700, it may gain upward momentum toward the next resistance at 6800. Conversely, if it closes near EMA21, the index may retreat toward the next support at 6530.

Weekly Trading Opportunities | October 21–25 • Monday: China GDP data
China’s third-quarter GDP report will be closely watched as growth is expected to slow to 4.8% year-on-year from 5.2% in Q2.
Slowing growth in China could reduce demand and prices for commodities. A surprise upside could support commodity prices.
• Tuesday: Coca-Cola and Netflix earnings.
Earnings season continues with Coca-Cola, Netflix, and others including Tesla, IBM, and Intel.
Strong results could offset soft U.S. data and help reignite the risk-on environment.
• Wednesday: U.K. inflation data and Tesla earnings
U.K. inflation is expected to edge back toward 4%. A softer reading could boost U.K. equities and pressure the pound.
• Thursday: Intel earnings
• Friday: U.S. CPI report
With the U.S. government shutdown entering its fourth week, the CPI release remains the week’s key data point. A hotter print could lift the dollar.