Weekly Outlook: XAUUSD, #SP500, #BRENT for 27-31 October 2025XAUUSD: BUY 4075.00, SL 4025.00, TP 4225.00
Gold starts the week near record territory, with spot prices fluctuating around $4,080 per ounce. Support comes from expectations of a Federal Reserve rate cut at the October 28–29 meeting and the recent pullback in U.S. Treasury yields ahead of the decision. Headlines about a potential temporary government funding pause in the U.S. and delayed data releases enhance gold’s role as a defensive asset, while September inflation came in slightly below expectations, reinforcing the case for policy easing. In addition, fund inflows into gold have stayed strong after October’s price spike.
The fundamental backdrop remains constructive: World Gold Council data point to renewed net purchases by central banks late in the summer, and October saw more active investment flows into “paper” gold as market volatility rose and real yields eased. Risks to this view include a more cautious Fed tone and a brief dollar rebound after the decision, but these are offset by steady institutional demand and ongoing geopolitical uncertainty.
Trade idea: BUY 4075.00, SL 4025.00, TP 4225.00
#SP500: BUY 6785, SL 6705, TP 7025
U.S. equities enter the week on strong footing: the S&P 500 holds near 6,790 after softer September inflation data and lower government bond yields. Markets are focused on the Fed’s October 28–29 decision; the prevailing view anticipates another rate cut, which would reduce borrowing costs and support the valuation of future earnings. The reporting season is in full swing, with expectations for double-digit earnings growth for 2025 and a busy week of results from index constituents.
Fundamentally, the index benefits from a combination of easing rate pressure, resilient profit expectations in sectors tied to digital infrastructure and AI-related investment, and a broadly steady consumer backdrop. Key risks include any prolonged disruption to federal services that could distort the macro data flow, and the chance of tighter corporate guidance given currency strength and fluctuations in global electronics demand.
Trade idea: BUY 6785, SL 6705, TP 7025
#BRENT: SELL 66.30, SL 68.00, TP 61.20
Brent trades around $66 per barrel. The weekly news flow is mixed: on one hand, infrastructure risks linger in the Black and Baltic Sea regions; on the other, international agencies flag accelerating supply growth alongside moderate demand. The earlier OPEC+ decision to allow a marginal output increase and revised surplus projections effectively cap prices despite sporadic supply disruptions and sanctions-related headlines.
By late October, industry assessments imply a gradual rebuild in inventories and a softer price path into Q4, albeit with elevated headline-driven volatility. Additional pressure comes from a cooler global backdrop and rising non-OPEC+ production, while any Fed rate cut would only partly lift the commodity complex. Short-position risks include an escalation of geopolitical tensions that threatens exports and an unexpectedly sharp draw in weekly U.S. stock data.
Trade idea: SELL 66.30, SL 68.00, TP 61.20
Trade ideas

US500Trading forex based on strong fundamentals is beneficial because it allows investors to make informed decisions grounded in real economic data rather than speculation. By analyzing key indicators like interest rates, inflation, GDP growth, employment, and geopolitical stability, a trader can anticipate currency movements driven by macroeconomic forces. This approach helps identify long-term trends and reduces emotional or impulsive trading, offering more consistent and sustainable profits. In essence, good fundamentals turn forex trading from a gamble into a strategic investment rooted in economic reality.

S&P 500 ready for correction?Hi Guys,
The sharp selloff on the US indices recently was a sign of further selling to come on the US Indices. As with just about all corrections there is the selling pressure in the form of an engulfing candle or breach of support etc, that indicates that the correction is imminent.
There is strong confluence to support a case for a nice pullback.
Firstly index is approaching 7000. Psychological number and if one takes a look at every time 1000 points has been reached the SP 500 has had a pullback.
Secondly the 1.618 fib retracement of the most recent correction is almost exactly at the 7000 mark.
Last of all , trendline resistance from recent price action and also from last few years lies in same area.
Sell trades using lower time frames, with price action candlestick chart patterns could result in some nice risk to reward trades.
Safe Trading all

US stocks hit record highs on better-than-expected CPI
The Sep US CPI indicated that tariff-driven inflation has not materialized, reinforcing the Fed’s dovish policy stance and driving US equities to new record highs. The prevailing view in the market remains with “Don’t fight the Fed.” The stock market’s impressive resilience, defying the typical seasonal weakness through Oct, reflects a dovish Fed stance amid the absence of recession signals.
The S&P; 500 remained within the ascending channel, reaching a new high at 6,800. Diverging bullish EMAs suggest that the bullish structure may extend further. If the index closes above 6,800, it could advance toward 6,900. Conversely, a drop below 6,800 may lead the price to retreat toward 6,700, which coincides with EMA21.
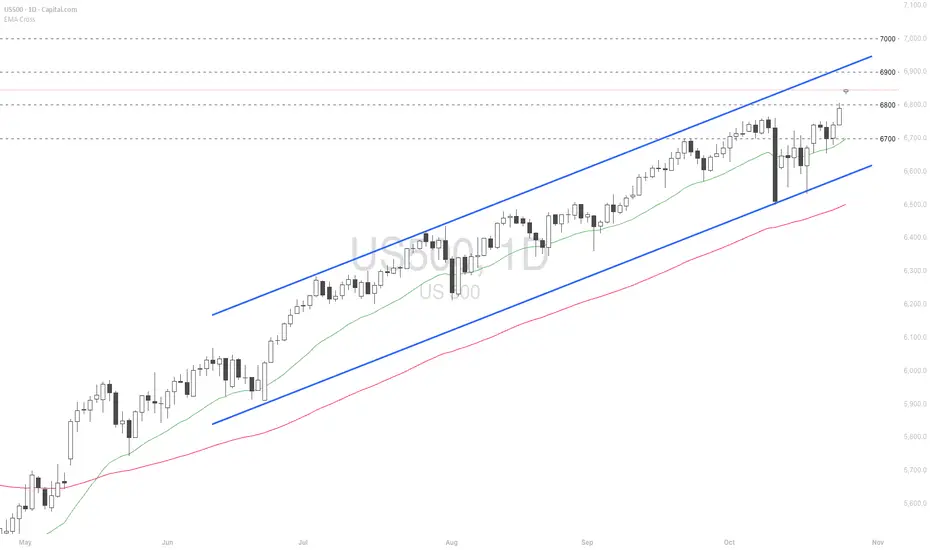
Chart Interpretation (Index Futures / Equity Index) SPX / S&PChart Interpretation (Index Futures / Equity Index)
TECHNICAL ANALYSIS
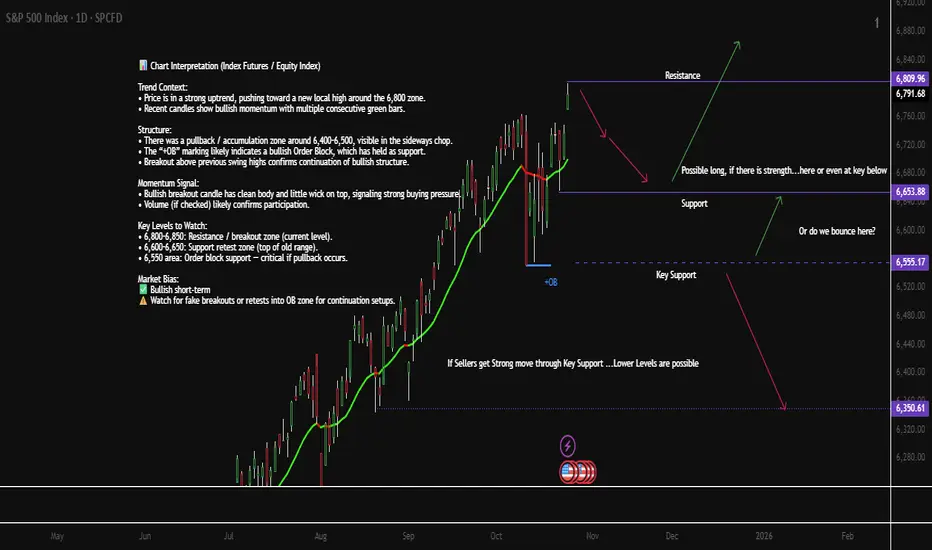
Trend Context:
• Price is in a strong uptrend, pushing toward a new local high around the 6,800 zone.
• Recent candles show bullish momentum with multiple consecutive green bars.
Structure:
• There was a pullback / accumulation zone around 6,400–6,500, visible in the sideways chop.
• The “+OB” marking likely indicates a bullish Order Block, which has held as support.
• Breakout above previous swing highs confirms continuation of bullish structure.
Momentum Signal:
• Bullish breakout candle has clean body and little wick on top, signaling strong buying pressure.
• Volume (if checked) likely confirms participation.
Key Levels to Watch:
• 6,800–6,850: Resistance / breakout zone (current level).
• 6,600–6,650: Support retest zone (top of old range).
• 6,450 area: Order block support — critical if pullback occurs.
Market Bias: Bullish short-term
Watch for fake breakouts or retests into OB zone for continuation setups.
FUNDEMENTAL ANALYSIS
U.S. Market Key Events — Week of Oct 27–31
Mon Oct 27
• 4:00 AM — 🇪🇺 German IFO Business Climate (watch EUR tone early session)
Tue Oct 28
• 9:00 AM — 🇺🇸 Richmond Manufacturing Index
• Tentative — 🇺🇸 CB Consumer Confidence
Wed Oct 29
• 9:00 AM — 🇺🇸 Pending Home Sales m/m
• 1:00 PM — 🇺🇸 Federal Funds Rate Decision (FOMC)
• 1:30 PM — 🇺🇸 FOMC Press Conference (high impact)
Thu Oct 30
• Tentative — 🇺🇸 Advance GDP q/q
• Tentative — 🇺🇸 Advance GDP Price Index
U.S.–China Trade Talks (market sensitivity risk)
Fri Oct 31
• Tentative — 🇺🇸 Core PCE Price Index m/m
• Tentative — 🇺🇸 Employment Cost Index q/q
📝 Focus on FOMC (Wed), GDP & Trade Talks (Thu), Core PCE (Fri) — high impact sessions for S&P / Dow / USD.
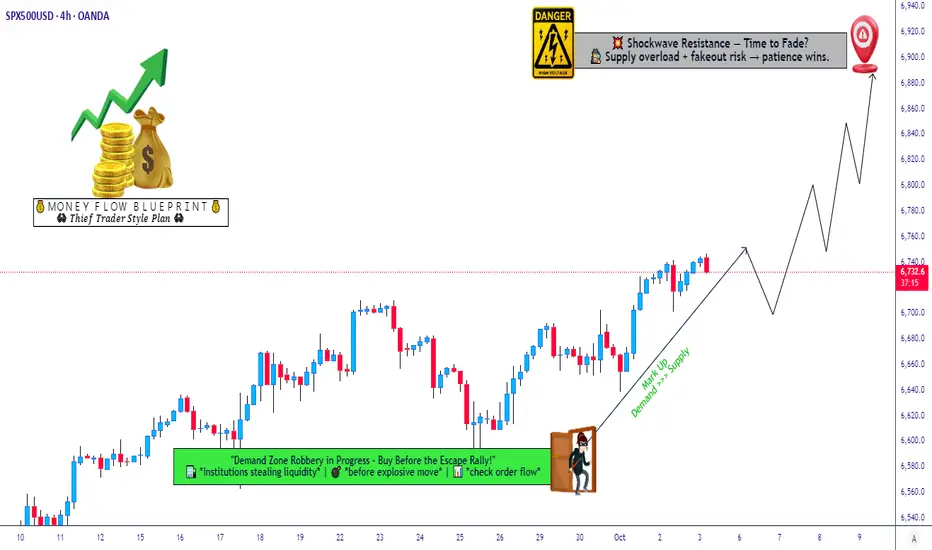
SPX 500 Swing/Day Trade Plan | Bullish Layers & Risk Guard✨ SPX 500 Index | Market Wealth Strategy Map (Swing/Day Trade) ✨
🚨 Plan: Bullish bias with Thief Strategy (layered limit entries).
🕹️ Style: Multiple buy-limit orders placed at different levels (“layering method” for smarter entries).
🎯 Entry Plan (Layered Thief Style)
🔑 Buy Limit Layers: 6660, 6680, 6700, 6720
➕ You can add more layers if market conditions allow.
🧠 Idea: Scaling in like a true Thief 🕶️ — stealing the best spots!
🛑 Stop Loss (SL)
Thief SL: @ 6640
⚠️ Note: Dear Ladies & Gentlemen (Thief OG’s), I’m not recommending you to use only my SL.
It’s your money → your choice → your risk management.
🎯 Target (TP)
Primary Target: @ 6900
🌀 Why? Shockwave resistance ⚡ + overbought zones 📈 + liquidity traps 🪤.
⛑️ Again, it’s your choice to set your own TP — escape with profits when you feel comfortable!
📊 Related Pairs & Correlations to Watch
CAPITALCOM:US500 / SP:SPX / CME_MINI:ES1! → Direct correlation to SPX 500.
NASDAQ:NDX / NASDAQ 100 → Often leads tech momentum, affects SPX swings.
TVC:DXY (US Dollar Index) → Strong dollar = pressure on indices. Weak dollar = fuel for bulls.
CAPITALCOM:US30 (Dow Jones) → Sometimes diverges from SPX, offering confluence signals.
TVC:VIX → Volatility Index — spikes = watch out for fakeouts / liquidity grabs.
💡 Key Takeaways
✅ Thief layering entry style = Scaling smarter, not harder.
✅ SL/TP = Flexible to your own trading psychology & risk appetite.
✅ Always respect risk management & don’t copy-paste blindly.
✅ Remember: markets love traps — be the thief, not the victim.
✨ “If you find value in my analysis, a 👍 and 🚀 boost is much appreciated — it helps me share more setups with the community!”
⚠️ Disclaimer: This is a Thief-style strategy shared just for fun & market learning purposes.
Not financial advice — trade at your own risk!
#SPX500 #US500 #SP500 #SPX #ThiefStrategy #DayTrading #SwingTrading #IndexTrading #MarketAnalysis #StockMarket
SPX into the new weekWe either pop 6800 on good news or retrace to test support.That looks to be the pattern we are trading uneless it breaks

US500 Surges On Softer US CPI DataFundamental & Sentiment Analysis
The US500 surged this week after the release of cooler than expected US CPI data. This bolstered expectations for further rate cuts by the Fed at its 28–29 Oct meeting. Investor sentiment turned sharply bullish, pushing the index to new record highs near 6,792 on Friday.
The inflation report for September 2025 surprised markets to the downside: headline US CPI rose 0.3% (3.0% YoY) and core CPI rose 0.2% (3.0% YoY), both below forecasts.
This moderation fueled optimism that inflation is cooling sustainably, raising the odds of a 25 basis point rate cut at the upcoming FOMC meeting. Following the CPI release, the US500 rose to 6,762 intraday, just shy of its all-time high.
Technical Outlook
The outlook for the coming week is moderately bullish, with potential consolidation at record highs. Momentum remains supported by softer inflation, dovish Fed expectations, and continued strong corporate earnings.
However, technical analysts warn of short-term pullbacks as the index tests critical resistance levels. A correction toward 6,720 would be healthy before a move higher toward 7,000.
The US stock market is positioned for further gains into year-end if inflation stays contained and the Fed confirms a sustained policy easing trajectory.
Analysis is by Terence Hove, Senior Financial Markets Strategist at Exness

S&P 500 — Short IdeaEntering short from current levels.
Stop-loss: if price closes above 6770 (4H candle body).
Take-profits: along the price movement — will adjust dynamically.
⚠️ Disclaimer:
This post is not financial advice and should not be interpreted as a trading recommendation.
I share my personal market view for educational and informational purposes only.
Everyone should make their own decisions, manage their own risks, and trade based on their own analysis.

REVEALED: What REAL Trading isWhat is Financial Trading in a nutshell?
For the last 20 years I’ve summed up trading as just ONE BIG AUCTION.
It sounds like a fast-paced, high-risk, Wall Street movie scene with shouting brokers and skyrocketing graphs.
But, here’s the truth:
Trading is the most relaxing thing – when done right!
It’s a lifestyle, a process, and a mindset.
It’s one thing where YOU can take your finances on an exciting adventure — if you do it right.
Whether you’re a complete newbie or a seasoned trader, here is a refresher to dive into what trading really is.
Trading Is More Than Just an Auction of buying or selling…
Let’s clear up one thing first.
For the last 20 years I’ve summed up trading as just ONE BIG AUCTION.
And yes it is one big market of buying and selling – but that’s only part of it.
TRADING is all about solving a puzzle of analyzing probabilities, managing risks, and navigating uncertainty.
Every time you enter a trade (buy or sell), you’re making an educated guess on where the market is LIKELY to go next.
And you’re placing a bet on human behavior — how millions of people around the world (with their emotions, news reactions, and strategies) will affect the price of an asset.
That’s the technical side of trading. Here’s where I want you to integrate trading into your life…
Trading Is A Lifestyle
It’s not just about making money — it’s about integrating trading into your lifestyle.
You need to find the right markets, time, time frame, styles, strategy and approach.
Trading is like hitting the gym; it requires discipline, consistency, and a whole lot of sweat equity.
And just like you don’t get a six-pack or lose weight after ONE workout.
You shouldn’t expect to master trading overnight.
It’s a routine you build day by day.
A typical trading day might include:
Pre-market analysis (Weekly bias):
You need to check what’s happening in the world with other markets with both Asian, American, European and even London session.
You also need to look at the US Economic Calendar to see what news is arising for the week.
Analyse and Execute trades:
Once done the pre analysis, you need to do the actual analysis. See what trades are lining up according to your proven strategy. And if anything looks good to go EXECUTE.
Review and track your trades:
This is where you will reflect on what went right and what went wrong. This is where you’ll track and review your trades that lined up to add to your journal.
The key takeaway: Trading isn’t just what you do; it’s who you become.
Trading Is a Forever Game
When it comes to trading, think long-term.
Like, REALLY long-term. Because trading is a forever game.
Unlike sports with seasons or video games with levels, trading doesn’t end.
The markets will be there tomorrow, next week, and 100 years from now.
And as a trader, your mission is to stay in the game for the long haul.
That means managing your risk, protecting your capital, and always looking to improve your skills.
Trading Is A Business Where YOU Are The Boss
The beauty of trading?
You’re in control.
Trading is a business, and you are the CEO.
You call the shots, decide when to enter and exit trades, and ultimately, you take control of your financial destiny.
Like any business, trading requires:
Planning and strategy:
Risk and reward management:
Tracking performance and improving:
And, just like in any business, you’ll make mistakes.
But those mistakes are not failures; they’re lessons.
You learn from them, adapt, and get better. That’s what makes trading such an empowering journey.
Final Words:
Financial trading is more than a job, a hobby, or a side hustle.
It’s a process-driven approach to decision-making, a lifestyle to live, a forever game to play, and a business where you’re in charge.
If done right, trading can be one of the most rewarding pursuits you’ll ever undertake.
Key Takeaways
Trading is a process: Follow a set strategy, criteria, and rules for success.
Trading is a lifestyle: Incorporate trading into your daily routine and stick with it consistently.
Trading is a forever game: It’s not a one-time event; it’s a lifelong pursuit.
Trading is a business: You’re the CEO — plan your moves, manage your risk, and take charge of your financial destiny.

The Real 3 Thrills of Trading: (Hint: It’s Not When You Think)Trading.
It’s a game.
A challenge.
A journey.
It’s a lifestyle.
And yes having a passion to trade is half the battle won.
But it’s not just about winning.
If you feel thrill when you win a trade. Then you’re enjoying the wrong parts of successful trading.
If you’re in a winning streak and feel thrill – Same story.
Because you know the losses are inevitable.
And you know the drawdown is coming too.
So that’s why you need to enjoy the FULL journey…
And here’s where you should feel the THRILL for trading.
THRILL #1: When you survive the drawdown
Like I said earlier, your next drawdown is coming.
Your BIGGEST drawdown is coming.
So you need to embrace and prepare for these times.
I have gone through more drawdowns than you can imagine.
And yet my portfolio keeps heading to all time highs.
HOW?
Well you need to endure the drawdown.
You need to keep following your rules and strategy.
And when the market environment is more favourable, your portfolio will turn from down to up.
And it will continue to go up until you not only recover – but your portfolio breaks to all time highs.
And when you survive the drawdown – FEEL THRILL!
THRILL #2: Knowing your strategy works (through the good and bad)
The markets are like an ocean.
Waves come and go, the tide shifts, and sometimes there’s a storm.
If you go look at the US Economic Calendar you’ll know the market is about to swivel in ways you can’t even imagine!
The thrill doesn’t come from riding one good wave (winner).
It should come from taking every trade that lines up perfectly with the strategy.
If you followed your rule and criteria to a T – Feel THRILL that you are on the right path to success.
Regardless of whether the trade is a winner or a loser.
See the bigger picture and what it can do for you!
THRILL #3: The Love for the Game and the benefits of trading
Remember I said trading is more than just money.
Trading helps with everything in your life!
It teaches you to be a risk manager.
It teaches you how to toughen your mind.
It teaches you how to be disciplined, consistent.
And it teaches you how you can CREATE your own wealth without depending on a BOSS.
The Challenge, the Mental Toughness, and the Growth
And the thrill?
FINAL WORDS – Celebrate the Right Thrills
The thrill of trading isn’t about the quick wins, the big gains, or riding the market waves.
It’s about resilience. Mastery. Passion. Patience. And growth.
Well fall in love with what trading has offered and taught you, other than the money aspect.
It’s not just about making money; it’s about becoming better. Sharper. Wiser.
Every trade you take is a lesson.
Every loss is a learning opportunity.
And every time you wake up excited to face the market, that’s the thrill of passion.
Because trading isn’t just a job.
It’s a craft.
A skill.
A calling.
If you find yourself waking up early, excited to start your day, knowing full well there’s a challenge waiting for you—you’ve found the thrill.
If you find weekends are not ending early enough because you want to trade – that’s a thrill!
Let’s sum up some reasons to feel THRILL when trading.
THRILL #1: When you survive the drawdown
THRILL #2: Knowing your strategy works (through the good and bad)
THRILL #3: The Love for the Game and the benefits of trading
Do you agree and how has trading changed your life?
WHY Financial Markets Will Always ChangeChange is the only constant in the financial markets.
And that’s why it’s important to stay humble and grounded because everyday is a UNIQUE day to the markets and the pre market movers.
No matter how much experience you have, you can’t get too comfortable with the way things are.
Because we know they won’t stay that way for long.
The markets are like a living, breathing entity—constantly shifting, evolving, and transforming.
And now I want to explain why I believe the markets are ALWAYS changing.
REASON #1: The Fresh Faces of Trading
Continuous flow of new and old traders.
Every day, new traders enter the game while seasoned veterans continue to play.
This constant influx of fresh perspectives creates a dynamic market environment.
New traders bring innovative strategies, emotions, and decision-making processes into the market, while the veterans tweak their systems to keep up with ever-evolving trends.
And so the demand and supply is constantly shifting in new ways – which changes the markets style, moves and algorithms.
End of the day, the market is one big AUCTION as I have told my members for the last 15 years.
They’re influenced by the people who trade in them.
REASON #2: The Never-Ending Stream of New Information
New information – shining on the market
Here’s the thing: the financial markets thrive on information.
New data points, news reports, earnings releases, and economic indicators flow in non-stop, impacting prices and trends at every turn.
Sometimes there is good days with amazing news coming out.
Other days there is catastrophic news.
And then you get the mundane boring days with no reaction.
If a central bank announces an unexpected interest rate cut, or if a company releases disappointing earnings, the market is going to react swiftly.
Even geopolitical events and natural disasters play their part in shaping the direction of markets.
So no matter how much analysis you’ve done, be prepared for the fact that new info can change the game in an instant.
REASON #3: Micro, Macro, and Inner Fundamentals
New micro, macro and inner fundamentals
The fundamentals that underpin market movements are far from static.
On the micro level, individual companies are constantly evolving.
New product launches
Mergers and acquisitions
News and earning reports
Prospects
Leadership changes can all affect a stock’s price.
Zoom out a little, and you’ve got macro fundamentals.
These show the big-picture factors like:
Interest rates
inflation, and
unemployment rates,
All of which influence the broader economy.
REASON #4: Global Economies and World Events
World info from the economies
The financial markets are more interconnected than ever.
What happens in one part of the world now ripples through the rest of the global economy in minutes, not weeks.
A change in China’s trade policy can directly impact European markets.
An unexpected election result in America could influence the South African or UK equities.
REASON #5: The Endless Actions of Traders
Constant actions of traders around the world
Then, of course, we have the daily actions of traders around the world.
Every time a buy or sell order is placed, the market shifts.
I like to think of it as the Stock Market’s Butterfly-Effect.
These actions are a direct result of human behavior—our emotions, analysis, strategies, and even fear and greed.
When traders believe in a trend, they pile on, creating momentum.
But when panic strikes, markets can spiral down in a blink of an eye.
Since traders are constantly reacting to new information, the market flows like an ever-shifting river.
Conclusion
The financial markets are in a constant state of flux.
They will forever change and we need to learn how to evolve, adapt or die trying.
But there is one thing that is inevitable.
The markets will KEEP moving and trending. And for that, we will always be profiting in the medium to long term.
Let’s sum up why the markets will always change…
REASON #1: The Fresh Faces of Trading
Continuous flow of new and old traders.
REASON #2: The Never-Ending Stream of New Information
New information – shining on the market
REASON #3: Micro, Macro, and Inner Fundamentals
New micro, macro and inner fundamentals
REASON #4: Global Economies and World Events
World info from the economies
REASON #5: The Endless Actions of Traders
Constant actions of traders around the world

Causes of Global CrashesEconomic, Political, and Psychological Factors.
Global financial crashes have been recurring phenomena throughout modern economic history. From the Great Depression of 1929, the Dot-Com Bubble of 2000, the Global Financial Crisis of 2008, to the COVID-19 market crash of 2020, each episode has revealed vulnerabilities in the global financial system. Despite different triggers, all share underlying causes linked to economic imbalances, political decisions, and collective psychological behavior. Understanding these factors is crucial for policymakers, investors, and economists to anticipate and mitigate future crises.
1. Economic Factors: The Foundation of Market Instability
Economic factors form the backbone of most global crashes. They often arise from systemic imbalances, over-leverage, speculative bubbles, and policy missteps that distort market efficiency.
a) Asset Bubbles and Overvaluation
One of the most common precursors to a crash is the formation of asset bubbles—situations where asset prices rise far beyond their intrinsic value due to excessive speculation. Investors, driven by the belief that prices will continue to climb, pour money into overvalued assets. When reality strikes and prices begin to fall, panic selling ensues, leading to a sharp market correction.
Examples include:
The Dot-Com Bubble (2000): Exuberance over internet startups drove technology stocks to irrational valuations, with companies having minimal profits being valued in billions.
U.S. Housing Bubble (2008): Excessive lending and subprime mortgages inflated real estate prices until defaults triggered a collapse, spreading through global financial markets via securitized mortgage products.
These bubbles illustrate how the combination of easy credit, speculative mania, and weak regulation can inflate asset values to unsustainable levels.
b) Excessive Debt and Leverage
High levels of debt—whether by households, corporations, or governments—create systemic vulnerability. When asset prices fall, overleveraged entities struggle to meet obligations, leading to a chain reaction of defaults and bankruptcies. Leverage amplifies both gains and losses; thus, when confidence erodes, deleveraging occurs rapidly, deepening the crisis.
The 2008 Financial Crisis serves as a textbook example, where banks and financial institutions had high exposure to mortgage-backed securities financed through short-term debt. Once the housing market declined, the inability to refinance debt led to liquidity freezes and institutional failures such as Lehman Brothers.
c) Monetary Policy and Interest Rate Mismanagement
Central banks play a crucial role in maintaining economic stability. However, prolonged periods of low interest rates and quantitative easing can encourage speculative behavior and excessive borrowing. Conversely, sudden tightening of monetary policy can burst bubbles and reduce liquidity.
For instance:
The U.S. Federal Reserve’s tightening before the 1929 crash is believed to have reduced liquidity, accelerating the market collapse.
Similarly, the rate hikes of 2022–2023 to combat inflation led to a correction in tech stocks and cryptocurrencies that had benefited from years of cheap money.
d) Global Trade Imbalances
Trade imbalances between major economies—such as the U.S. and China—can lead to distortions in capital flows and currency valuations. Persistent current account deficits or surpluses create dependency and volatility. When these imbalances adjust abruptly, global financial markets experience turbulence, as seen during the Asian Financial Crisis of 1997, when capital flight led to currency collapses and regional recessions.
e) Banking System Fragility
Weak regulation, risky lending practices, and insufficient capital buffers make banking systems vulnerable. The interconnectedness of global finance means that the failure of one major institution can cascade across borders, as seen in 2008 when the collapse of Lehman Brothers triggered a global credit crunch.
2. Political Factors: The Role of Governance and Geopolitics
While economic indicators often signal a crash, political factors can act as both catalysts and amplifiers. Governments influence markets through fiscal policies, regulation, and geopolitical actions.
a) Policy Uncertainty and Mismanagement
Political instability and inconsistent economic policies create uncertainty that undermines investor confidence. Sudden tax reforms, nationalization, or trade restrictions can shock markets. For instance:
The Brexit referendum (2016) caused massive volatility in global markets due to uncertainty about trade and investment flows.
The U.S.-China trade war (2018–2019) disrupted global supply chains, leading to stock market fluctuations and slower growth.
In emerging markets, policy mismanagement, corruption, and lack of transparency can drive capital flight, devalue currencies, and cause inflationary spirals—factors often preceding financial crises.
b) Geopolitical Conflicts and Wars
Wars and geopolitical tensions disrupt trade routes, increase commodity prices, and trigger risk aversion in investors. The Russia-Ukraine war (2022), for instance, caused spikes in energy and food prices, contributing to global inflation and slowing growth. Similarly, the Oil Crisis of 1973—triggered by OPEC’s embargo—plunged Western economies into stagflation, demonstrating how political decisions in one region can create worldwide economic turmoil.
c) Regulatory Failures and Deregulation
Governments and financial regulators are tasked with maintaining market integrity. However, deregulation or lax oversight can allow risky practices to proliferate.
The U.S. financial deregulation in the 1980s and 1990s encouraged complex derivatives and speculative trading, setting the stage for the 2008 crash.
In developing economies, weak regulatory frameworks have allowed unmonitored capital inflows that later reversed abruptly, causing crises.
d) Globalization and Policy Interdependence
Globalization has tightly interlinked economies, but it also means that crises can spread faster. The collapse of one major economy now has ripple effects through trade, finance, and investment channels. When political decisions—like sanctions, tariffs, or capital controls—are implemented by major powers, they can unintentionally trigger market dislocations worldwide.
e) Fiscal Deficits and Unsustainable Public Debt
Governments running persistent fiscal deficits often resort to excessive borrowing. When investors lose confidence in a government’s ability to service its debt, bond yields rise sharply, leading to a debt crisis.
Examples include:
The Eurozone Sovereign Debt Crisis (2010–2012), where Greece, Spain, and Italy faced massive sell-offs in government bonds due to high debt-to-GDP ratios.
Argentina’s repeated debt defaults illustrate how fiscal indiscipline can repeatedly destabilize markets and economies.
3. Psychological Factors: The Human Element in Market Crashes
While economic and political factors lay the groundwork for crashes, psychology drives the timing and intensity of market collapses. Investor sentiment, herd behavior, and cognitive biases play central roles in shaping market dynamics.
a) Herd Behavior and Speculative Mania
Markets are not purely rational systems—they are deeply influenced by crowd psychology. When prices rise, investors fear missing out, leading to herd behavior where everyone buys simply because others are buying. This collective optimism inflates bubbles beyond fundamental values.
Historical examples include:
Tulip Mania (1637) in the Netherlands, where tulip bulbs sold for the price of houses before crashing overnight.
Bitcoin and crypto booms (2017 and 2021), where social media hype and retail participation drove valuations to extreme levels before sharp corrections.
b) Overconfidence and Illusion of Control
Investors often overestimate their ability to predict markets. During bull markets, this overconfidence bias leads to risk-taking and neglect of fundamentals. Financial analysts, fund managers, and even policymakers may believe “this time is different,” ignoring signs of overheating.
Before the 2008 crash, many economists and bankers genuinely believed that new financial innovations had made the system more resilient—an illusion that collapsed once subprime defaults surged.
c) Panic and Loss Aversion
Once asset prices start falling, fear takes over. Loss aversion, the psychological principle that people feel losses more intensely than gains, causes panic selling. The speed of modern digital trading and algorithmic systems amplifies this panic, leading to rapid market declines.
During the COVID-19 crash of March 2020, stock markets fell over 30% within weeks as investors rushed to liquidate positions amid uncertainty, demonstrating how fear can drive faster collapses than fundamentals alone would justify.
d) Media Influence and Narrative Contagion
Media and social networks can accelerate both optimism and fear. Positive stories during bubbles and alarmist headlines during downturns amplify collective emotions. Economist Robert Shiller’s concept of “narrative economics” highlights how viral stories—such as “housing prices never fall” or “AI will revolutionize everything”—fuel speculative behavior detached from reality.
e) Behavioral Finance and Feedback Loops
Modern behavioral finance explains how psychological feedback loops amplify volatility. Rising prices attract attention, which draws more investors, pushing prices even higher—a self-reinforcing cycle. When this reverses, selling pressure creates a downward spiral, often far exceeding what fundamentals justify.
4. Interconnection Between Economic, Political, and Psychological Forces
Global crashes rarely result from a single cause—they emerge from a complex interaction of economic misalignments, political actions, and psychological dynamics.
For instance:
The 2008 crisis combined excessive leverage (economic), weak regulation (political), and investor complacency (psychological).
The COVID-19 crash reflected a sudden geopolitical shock (pandemic response), economic slowdown, and psychological panic selling.
The Asian Financial Crisis (1997) arose from overborrowing (economic), weak policy responses (political), and investor herd behavior (psychological).
This interconnectedness makes prediction and prevention challenging, as policymakers must manage not only economic fundamentals but also public sentiment and political realities.
5. Lessons and Preventive Measures
To prevent or mitigate global crashes, lessons from past crises must be applied systematically:
Stronger Financial Regulation:
Transparent accounting, capital adequacy norms, and limits on leverage can reduce systemic risks.
Balanced Monetary Policy:
Central banks should avoid prolonged ultra-low interest rates that encourage asset bubbles, while managing liquidity during downturns.
International Coordination:
Global financial stability requires coordination among central banks, governments, and institutions like the IMF to manage cross-border capital flows and crises.
Investor Education and Behavioral Awareness:
Educating investors about cognitive biases, speculative risks, and market psychology can foster more rational decision-making.
Crisis Communication and Transparency:
Governments and regulators should maintain clear, transparent communication to prevent misinformation and panic during economic shocks.
Conclusion
Global crashes are inevitable episodes in the cyclical nature of financial markets, driven by a combination of economic imbalances, political misjudgments, and psychological dynamics. While the specific triggers may vary—be it a housing bubble, a war, or a pandemic—the underlying patterns remain strikingly similar. Understanding these causes not only helps explain past collapses but also equips policymakers and investors to build more resilient financial systems. Ultimately, preventing future crashes requires recognizing that markets are not just machines of numbers—they are reflections of human behavior, confidence, and collective decision-making in an ever-interconnected world.

US500 Actionable Long Bullish 5 stack fundamental 6 stacks TechCMCMARKETS:SPX500Z2025
Fundamental: Bullish (5 stacks).
Technical: Bullish (6 stacks, Actionable 6+).
20-word summary: Earnings resilience and easing expectations support bids. EMAs aligned, RSI constructive. Dips bought while above 6675; trend continuation favored highs.
Trade plan (LONG): SL 107.768, TP 280.1968 (ATR method).
All stars align however stay sharp, stay nimble as tariffs loom.

S&P500 expected to open on a cautious note- earnings in focusUS equities lost momentum yesterday, with the S&P 500 falling -0.53%, snapping a three-day winning streak as renewed US-China trade tensions, weak corporate earnings, and continued government shutdown worries weighed on sentiment.
Key Drivers:
Trade concerns dominated after reports that the Trump administration is considering export restrictions to China on products containing or developed with US software, in retaliation for China’s rare earth export limits. This escalation hit semiconductor and tech stocks, with the Philadelphia Semiconductor Index down -2.36%.
Later, more conciliatory comments from Trump—suggesting a deal with China was still possible—helped stem deeper losses but failed to lift markets meaningfully.
Oil prices were the exception, with Brent Crude rising above $64/bbl after the US imposed new sanctions on Russia’s largest oil producers, intensifying pressure on global energy markets.
Gold continued its slide, falling another -0.65%, following Wednesday’s sharp selloff.
Corporate News:
Tesla shares came under pressure after profits plunged despite record sales, as rising costs hit margins. CEO Elon Musk used the earnings call to defend his proposed $1 trillion pay package.
Broader earnings sentiment weakened amid several disappointing results, adding to the cautious tone.
Global Developments:
In Canada, Prime Minister Mark Carney announced a plan to diversify exports away from the US and attract skilled immigration, signaling shifting trade dynamics in North America.
Outlook for Today:
Markets are expected to open on a cautious note, with traders monitoring fresh earnings releases and US data for signs of resilience. The S&P 500’s near-term direction will likely hinge on whether confidence improves around trade and earnings, or if risk aversion continues to build into the weekend.
Key Support and Resistance Levels
Resistance Level 1: 6720
Resistance Level 2: 6755
Resistance Level 3: 6765
Support Level 1: 6645
Support Level 2: 6590
Support Level 3: 6560
This communication is for informational purposes only and should not be viewed as any form of recommendation as to a particular course of action or as investment advice. It is not intended as an offer or solicitation for the purchase or sale of any financial instrument or as an official confirmation of any transaction. Opinions, estimates and assumptions expressed herein are made as of the date of this communication and are subject to change without notice. This communication has been prepared based upon information, including market prices, data and other information, believed to be reliable; however, Trade Nation does not warrant its completeness or accuracy. All market prices and market data contained in or attached to this communication are indicative and subject to change without notice.

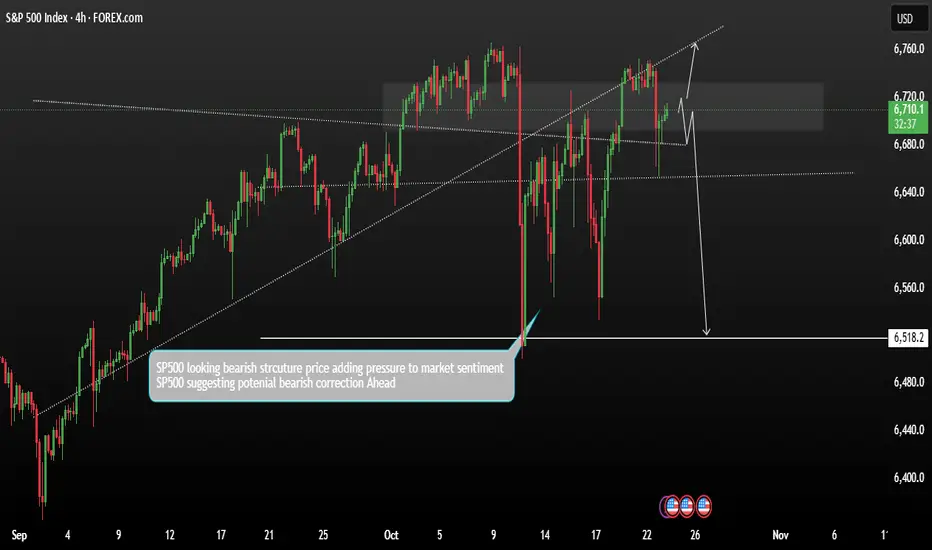
SP500 currently showing bearish trend structureThe NASDAQ 100 is currently showing signs of price consolidation within a bearish trend structure. Selling pressure continues to build as price action remains capped below key resistance levels.
While short-term fluctuations may occur during earnings releases, technical indicators suggest that the bearish bias remains intact unless the price breaks decisively above resistance. Traders should watch for reversal signals around current resistance before considering short positions.
A Price is testing the upper resistance, suggesting that momentum may be losing steam The broader bias remains bearish, with sellers likely to regain control if the resistance holds a potential downside move could target the 6518 level, provided the market confirms rejection from resistance.
You may find more details in the chart.
Trade wisely best of Luck Buddies.
Ps; Support with like and comments for better analysis Thanks for Supporting.
SPX for Thursday October 23rdSimilar pattern to Dax.There is now an uptrend.Running into resistance.Lets see what happens

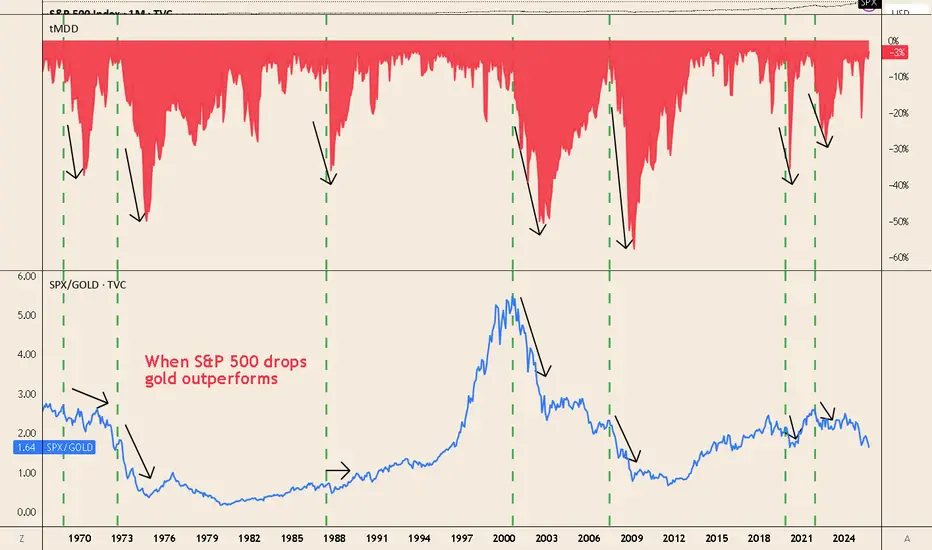
When Equities Fall, Gold Outperforms — SPX/Gold Says It All📊 Key insight
-Every major equity drawdown coincides with a drop in the SPX/Gold ratio — meaning gold outperforms stocks.
📉 What the chart shows
-1973–74 (stagflation): deep S&P 500 drawdown, SPX/Gold collapses.
-2000–02 (tech bust): ratio peaks ~5, then trends lower as gold rises and equities fall.
-2008–11 (GFC): brief liquidity hit to gold, then SPX/Gold plunges as gold rallies.
-2020 (COVID shock): rapid drop in SPX/Gold during equity sell-off.
-2022 bear market: ratio turns down again with inflation and rate stress.
Why it happens
-During market stress, investors seek safe collateral → gold demand spikes.
-Real rates and recession fears hurt equities more than gold.
-Silver carries industrial exposure, gold acts as a true safe haven.
🛡️ How to use it
-A gold allocation helps hedge against equity drawdowns.
-Long TVC:GOLD / short TVC:SPX (ratio trade) historically reduces portfolio volatility.
-Note: gold can dip during initial liquidity shocks (e.g., 2008, Mar 2020) — but recovers faster than equities.
US500 BREAKS 6,740:Bull Market Roars, But Inflation Shadows PeakUS500 Snapshot
US500 is exhibiting a clear bullish trend, pushing to new all time highs above 6,740. Strong momentum is driven by robust corporate earnings, particularly from large cap technology stocks, and prevailing bullish investor sentiment.
Key Drivers and Catalysts:
Earnings Strength: Resilient corporate earnings, particularly within the "Magnificent 7" mega cap technology stocks, remain the primary engine for the index's upside.
Sticky Inflation & Fed Policy : Persistent inflation in the services sector is injecting selective caution but reinforcing the appeal of strong, high growth companies. With expectations elevated for the US Fed to cut rates to protect a weakening US Jobs market further supporting the index.
Political Policy Influence: The forward outlook is being shaped by economic policy prospects, notably potential tariffs and tax changes under President Trump's administration.
Outlook: Key Risks & Levels:
The general consensus among major financial institutions is for further growth towards year end, with targets ranging from the conservative 5,700 to the bullish 7,100.
The prevailing scenario is a continuation of the upside toward the next major resistance level near 6,800.
While continued earnings expansion and a relatively stable macro backdrop support single digit growth expectations, the outlook is tempered by key risks:
High Valuations: Elevated index valuations could limit aggressive buying.
Macro/Policy Risks: Moderate volatility is expected around upcoming inflation and interest rate data. Furthermore, ongoing uncertainties related to trade and policy (e.g., the tariff debate) pose a risk to sentiment.
Analysis by Terence Hove, Senior Financial Markets Strategist at Exness

W Pattern In SPX/USD Good day or night fellow traders and followers!
I see a W pattern on the 4hr chart in SPX/USD. Who wants to make around 176 points? I know I do so if price can break out over the break-line @ 6,691.6 then it's going to 6868.9 area like it or not, as it looks like Institutional buying coming in.
Follow the rules wait for 4hr chart to show price clearing the break-line on a 4hr candle close before going long. Don't bother with chop if it occurs. Waiting is the stress free way to insure direction.
Best of luck in all your trades $$$

Gold vs Silver – Which is the true safe haven?While everyone debates whether to buy gold or silver, this chart shows something often overlooked:
When markets crash, the Gold/Silver ratio spikes — meaning gold strongly outperforms silver.
That’s because:
TVC:GOLD behaves as a true safe-haven asset during drawdowns.
TVC:SILVER , with heavier industrial exposure, tends to fall alongside risk assets.
Historically, every major market correction (2000, 2008, 2020, 2022…) was followed by a sharp rise in the ratio.
👉 If you want protection during equity sell-offs, gold > silver — or even consider long Gold/Silver as a hedge.

S&P 500: Signs of a Short-Term Bearish Pullback?The TVC:SPX continues to trade within a well-defined ascending channel that has guided price action since early August. However, recent market behavior suggests potential exhaustion as the index approaches the upper boundary of this structure.
After sweeping into the 6,750–6,770 supply zone, price showed rejection with long upper wicks, indicating that buyers are losing momentum near this resistance. The level also aligns with the upper limit of the ascending channel, reinforcing it as a strong confluence zone.
From a structural standpoint, the market has failed to establish a new higher high, suggesting that bullish momentum could be weakening. If sellers maintain control below this supply area, a corrective move toward the 6,560 region — near the channel’s midline — becomes likely.
A decisive close below 6,640 would further confirm bearish intent, potentially opening room for a deeper retracement toward the lower boundary of the channel around 6,500.
Overall, while the broader trend remains technically bullish, the short-term setup favors a bearish pullback before any potential continuation.

Sovereign Debt Explained in the Global MarketIntroduction
Sovereign debt, also known as government debt or public debt, represents the money that a national government borrows to finance its expenditures and obligations. It is one of the most significant pillars of the global financial system, influencing everything from international trade and exchange rates to global market stability and development. Governments borrow to cover budget deficits, fund infrastructure, respond to crises, or stimulate economic growth. The management, structure, and sustainability of sovereign debt play a crucial role in determining a country's economic credibility and its integration into the global market.
In today’s interconnected world, sovereign debt is not an isolated national issue—it has far-reaching implications across borders. When a country defaults or faces a debt crisis, the ripple effects can be felt throughout the international financial system. Therefore, understanding sovereign debt in the context of the global market is essential to comprehend global economic dynamics, investor confidence, and long-term growth prospects.
1. Concept and Nature of Sovereign Debt
Sovereign debt is the total amount of money a government owes to external and internal creditors. It can take the form of bonds, loans, or other financial instruments issued by the government to domestic investors or foreign entities. Governments typically issue sovereign bonds—long-term or short-term securities that promise repayment of principal plus interest—to finance their fiscal needs.
There are two main categories of sovereign debt:
Domestic Debt:
Borrowed in the country’s own currency and often from local financial institutions or citizens. Domestic debt reduces exposure to foreign exchange risks but can crowd out private investment if excessive.
External Debt:
Borrowed from foreign creditors, including international organizations, foreign governments, and investors. It is often denominated in foreign currencies such as the U.S. dollar, euro, or yen. External debt exposes a country to exchange rate risks and global financial fluctuations.
Sovereign debt differs from corporate or personal debt because governments have unique powers—they can print money, tax citizens, and control monetary policy. However, these powers are not limitless, and excessive borrowing can lead to inflation, devaluation, or default.
2. Importance of Sovereign Debt in the Global Market
Sovereign debt plays several crucial roles in the global financial system:
Financing Government Expenditure:
Governments use debt to fund projects that stimulate economic growth—such as infrastructure, education, defense, and social welfare. This borrowing supports public services and long-term development.
Macroeconomic Stability and Fiscal Policy:
Borrowing helps smooth economic cycles. During recessions, governments may borrow more to stimulate demand and reduce unemployment. During booms, they may pay down debt to avoid overheating the economy.
Benchmark for Global Financial Markets:
Sovereign bonds, especially those issued by stable economies (like U.S. Treasury bonds), act as benchmarks for global interest rates. Investors worldwide use these as reference points to assess risk premiums on other assets.
Investment and Safe Haven Asset:
Many institutional investors, including central banks and pension funds, hold sovereign bonds as low-risk investments. U.S., Japanese, and German government bonds are considered “safe haven” assets during global uncertainty.
Indicator of Economic Health:
The level and sustainability of sovereign debt indicate a country’s fiscal health. A high debt-to-GDP ratio may raise concerns about solvency, while moderate debt can signal sound economic management.
3. Globalization and the Expansion of Sovereign Debt Markets
The globalization of finance has transformed sovereign debt markets dramatically. In the 20th and 21st centuries, capital mobility increased, allowing investors to buy foreign government bonds easily. Emerging markets also gained access to international borrowing, leading to a global expansion of sovereign debt.
Some key drivers of this trend include:
Financial Liberalization: Many developing countries opened their capital markets, allowing foreign investors to purchase local government bonds.
Technological Advancements: Digital trading platforms and global financial networks facilitated cross-border investment.
Global Savings Glut: High savings in developed nations, such as Japan and China, increased the demand for sovereign debt from other countries.
Monetary Policy in Advanced Economies: Low interest rates in developed countries pushed investors to seek higher yields in emerging markets, expanding their sovereign bond markets.
As a result, sovereign debt has become deeply intertwined with global capital flows. Investors in one country routinely hold the debt of others, linking their financial fortunes. This interdependence strengthens global economic cooperation but also amplifies systemic risks.
4. Determinants of Sovereign Debt Sustainability
The sustainability of sovereign debt depends on whether a government can service its obligations without resorting to excessive borrowing or risking default. Key determinants include:
Debt-to-GDP Ratio:
A widely used measure of a country’s debt burden. A high ratio may indicate financial strain, but the threshold varies across countries depending on growth rates and interest costs.
Interest Rate and Growth Differential:
If economic growth exceeds the interest rate on debt, the debt ratio tends to stabilize or decline over time. Conversely, if interest rates rise faster than growth, debt can become unsustainable.
Fiscal Balance:
Governments with persistent fiscal deficits (spending exceeding revenue) may accumulate unsustainable debt levels.
Exchange Rate Stability:
For countries with large external debt denominated in foreign currencies, exchange rate depreciation can inflate the debt burden.
Investor Confidence:
Global investors’ perception of a country’s economic management directly affects borrowing costs. Confidence can be influenced by political stability, monetary policy, and institutional credibility.
Debt Structure and Maturity Profile:
Short-term or variable-rate debt poses higher rollover and interest rate risks than long-term, fixed-rate debt.
5. Sovereign Debt Crises: Causes and Consequences
Sovereign debt crises occur when governments cannot meet their debt obligations, either through repayment or servicing interest. Such crises can arise due to poor fiscal management, external shocks, or global financial contagion.
Major Causes:
Excessive borrowing during boom periods followed by economic downturns.
Currency mismatches between debt and revenue.
Sudden stops in capital inflows or rising global interest rates.
Political instability and policy mismanagement.
Consequences:
Default and Restructuring: Governments may renegotiate terms with creditors or suspend payments temporarily.
Economic Recession: Austerity measures to reduce debt often suppress growth and increase unemployment.
Inflation and Currency Collapse: If debt is monetized (financed by printing money), it can lead to hyperinflation.
Loss of Credibility: A country’s access to international markets diminishes, raising borrowing costs for years.
Historical Examples:
Latin American Debt Crisis (1980s): Triggered by rising U.S. interest rates and oil price shocks.
Asian Financial Crisis (1997): Currency collapses led to debt defaults in several Asian economies.
Greek Debt Crisis (2010s): Excessive government spending and structural inefficiencies led to massive bailouts from the EU and IMF.
Argentina (multiple defaults): Chronic fiscal mismanagement and political instability have caused repeated sovereign defaults.
6. Role of International Institutions in Sovereign Debt Management
Institutions such as the International Monetary Fund (IMF), World Bank, and regional development banks play vital roles in managing sovereign debt crises and promoting fiscal stability.
IMF: Provides financial assistance and policy advice to countries facing balance-of-payments or debt crises. Its programs often come with fiscal and structural reform conditions.
World Bank: Focuses on long-term development financing and helps countries design sustainable debt management strategies.
Paris Club and London Club: Groups of official and private creditors that coordinate debt restructuring efforts for distressed sovereign borrowers.
Credit Rating Agencies (CRAs): Agencies like Moody’s, S&P, and Fitch assess sovereign creditworthiness, influencing borrowing costs in the global market.
These institutions aim to ensure that countries maintain fiscal discipline while providing relief during crises. However, critics argue that their policies sometimes prioritize creditor interests over social welfare, especially through austerity measures.
7. Sovereign Debt and Emerging Markets
Emerging markets have become significant participants in the global sovereign debt landscape. Countries like India, Brazil, Indonesia, and South Africa issue bonds in both domestic and international markets. While this enhances their access to capital, it also exposes them to global volatility.
Challenges Faced by Emerging Economies:
Currency risk due to foreign-denominated debt.
Limited investor confidence compared to developed nations.
Higher borrowing costs and vulnerability to global interest rate changes.
Political and policy uncertainties affecting credit ratings.
Despite these challenges, emerging market sovereign bonds attract global investors seeking higher yields, contributing to portfolio diversification.
8. The Future of Sovereign Debt in the Global Market
As the global economy evolves, the nature of sovereign debt is also transforming. Several trends are shaping its future:
Rising Global Debt Levels:
The COVID-19 pandemic and subsequent fiscal stimulus programs have driven global public debt to record highs, surpassing 100% of global GDP in many advanced economies.
Green and Sustainable Bonds:
Many governments now issue green bonds to finance environmentally sustainable projects. These instruments align debt issuance with climate goals and attract ESG-focused investors.
Digitalization and Transparency:
Blockchain technology and digital platforms are enhancing debt transparency, improving trust and efficiency in bond markets.
Geopolitical Shifts:
Rivalries among major economies, such as the U.S. and China, are influencing global debt markets through changes in capital flows and currency alignments.
Debt Relief and Restructuring Mechanisms:
Post-pandemic, international cooperation has increased to support low-income countries through debt relief initiatives like the G20 Common Framework.
Conclusion
Sovereign debt is both a tool of economic development and a potential source of financial instability. In the global market, it functions as a key instrument for investment, fiscal policy, and international cooperation. Properly managed, it enables nations to build infrastructure, stimulate growth, and enhance welfare. Mismanaged, it can trigger crises that ripple across the world economy.
The challenge for policymakers is to maintain a balance—borrowing enough to foster development while ensuring sustainability and market confidence. As the global financial landscape evolves, transparency, innovation, and prudent fiscal governance will determine how effectively sovereign debt continues to serve as a cornerstone of the global economy.
