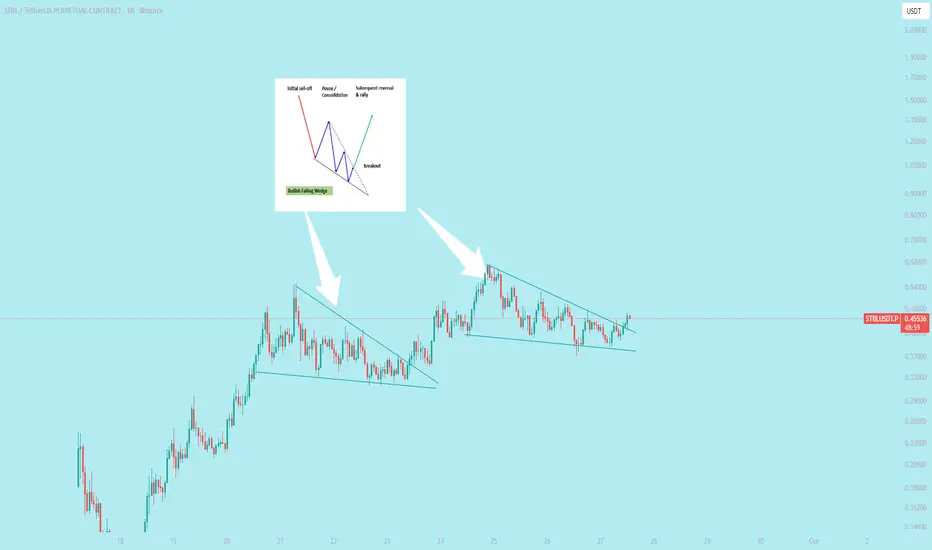
$STBL Breakout falling wedge pattern
`A falling wedge breakout is a bullish signal in technical analysis, occurring when the price of an asset, which has been trending downward in a tightening range, pushes decisively above the upper resistance line of the wedge formation. This indicates that selling pressure is weakening and a potent
STBLUSDT.P - September 30, 2025The chart shows a strong impulsive rally from the $0.11 lows with price now consolidating in the mid-$0.40s; the best DCA zones sit around $0.36–0.38 as the prior breakout floor, $0.28–0.30 as the next major demand pocket, and $0.22–0.24 for a deeper retest — each likely to provide solid bounce poin

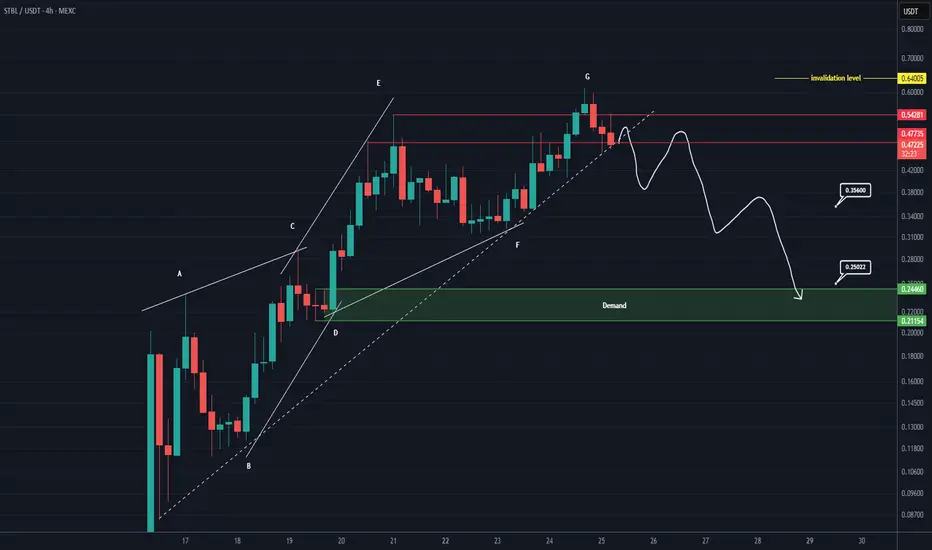
STBL Analysis (4H)Before anything else, you should know that this is a new coin and the sentiment around it is still highly emotional. Therefore, it’s better to control your position size and leverage, and set a stop-loss for yourself.
The recent upward movements and the bullish phase seem to have formed a diametric
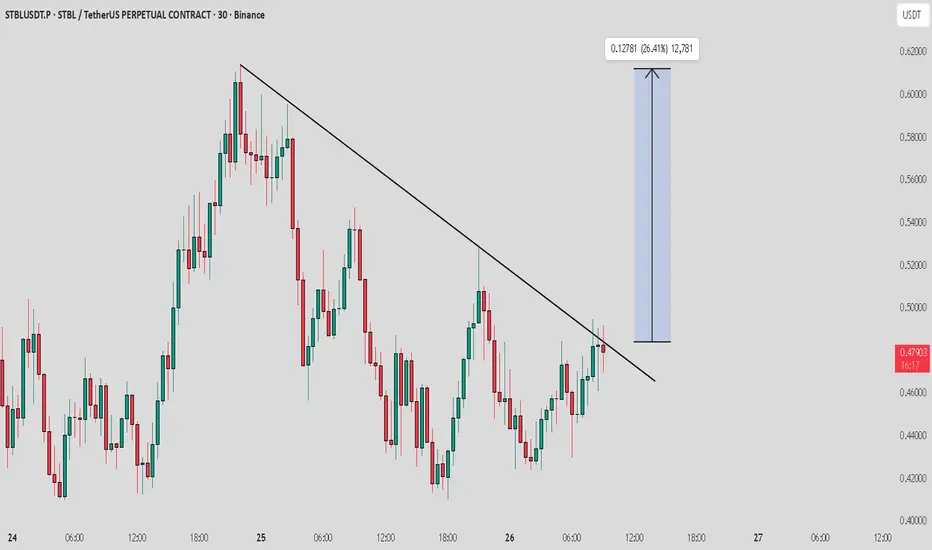
STBL / USDT : Short term rally expected if breakout doneSTBL / USDT is attempting to break out from trend line resistance. Keep it on your watchlist—if the breakout confirms, we can expect a strong short-term rally.
Always wait for confirmation before entering and manage risk properly.
UPDATE ON STBL SHORTS Added more shorts from $0.47UPDATE ON STBL SHORTS
Added more shorts from $0.47
Targeting $0.32400 0r Down
Stop loss $0.76
Not a Financial advice

STBL PERPETUAL TRADE SELL SETUP Short from $0.33400STBL PERPETUAL TRADE
SELL SETUP
Short from $0.33400
Currently $0.33400
Targeting $0.30600 or Down
(Trading plan IF STBL
go up to $0.36
will add more shorts)
Follow the notes for updates
In the event of an early exit,
this analysis will be updated.
Its not a Financial advice

STBL Prepares for Reversal After Blow-Off TopAfter a parabolic rally, STBL has entered a corrective phase. Price has rotated down toward the value area low, which aligns with both the 0.618 Fibonacci retracement and a significant swing low. An impulsive bounce has occurred, but the market may revisit this zone to clean liquidity before continu

STBL Analysis – Watching the 0.3 Support ZoneI’m currently keeping an eye on STBL around the 0.3 level, which looks to be acting as a strong support zone. Price has reacted here multiple times in the past, showing signs of demand picking up whenever it dips into this area.
If buyers manage to defend this level again, we could see a potential

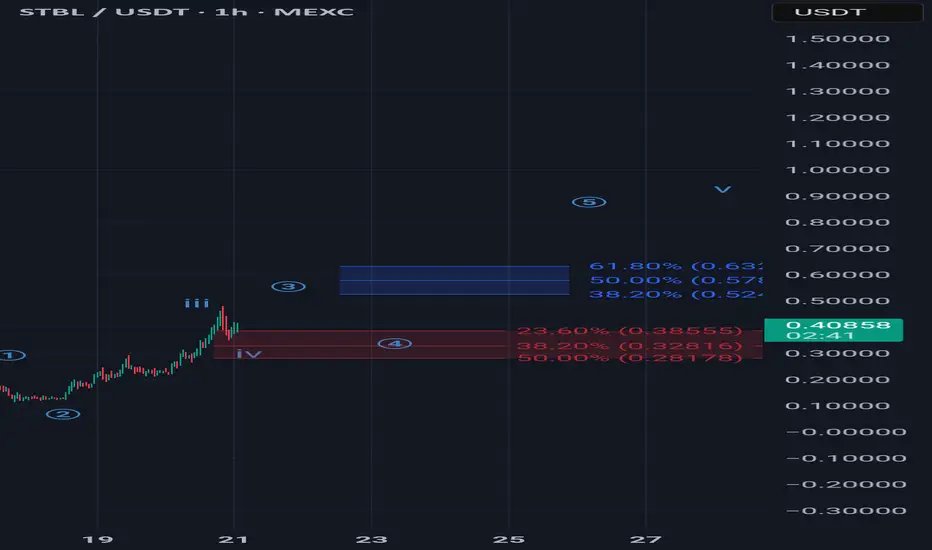
SBTL ELLIOTT WAVE ANALYSISLooking at current top at 0.48 as a possible wave 3 top with a possible extension in wave 3. Current support for wave 4 is between 0.385 - 0.281 and from there im looking if price can attack blue zone in awave 5 before larger correction. Invalidation point is under 0.281.
STBL/USDT – 4HOn the 4H timeframe, we can see a bearish hidden divergence forming. The recent pump from 0.39 to 0.49 was not supported by strong volume, indicating limited momentum.
There is a potential retracement towards the $0.408 level, with the next support area around $0.38. If the support holds and price

See all ideas