Somi might have same scenario case like steemSteem having same similar pattern like somi on last year.
Looks like same operator.
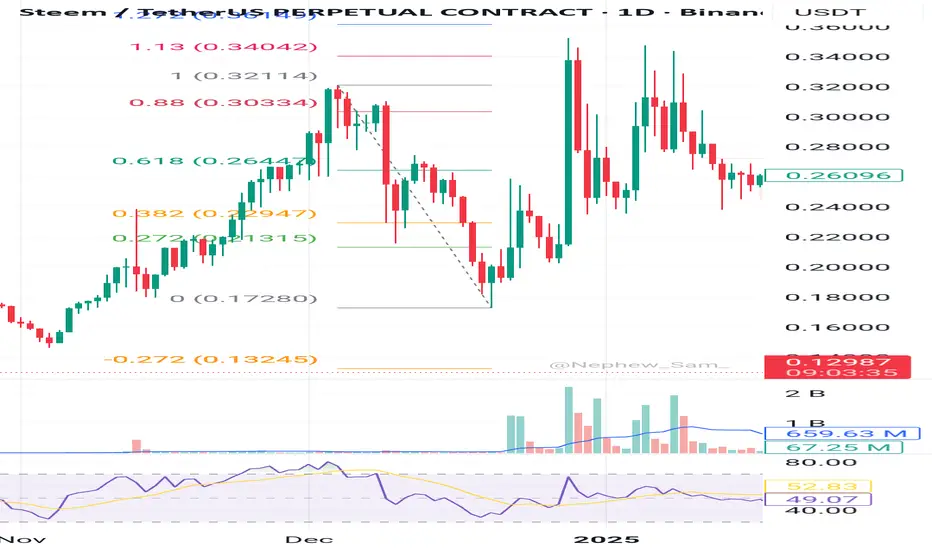
There is bottom high volume.
When the price pump.. daily chart close below fibo 1.13 and start to do fake out pattern..
The most realistic for somi price target will be 1.13..
If daily chart close below 1.13b at
$STEEM Analysis📊 SEED_DONKEYDAN_MARKET_CAP:STEEM Analysis 📊
#STEEM broke the 4H diagonal trendline and is now retesting it 👀
Daily FVG sits just below — a solid confluence for potential bounce 📈
⚠️ Waiting for the retest + bounce before jumping in long
Let price confirm — don’t guess the move 🎯

"STEEM Long Opportunity from Support"STEEM/USDT is showing signs of a bullish reversal after testing a key demand zone around 0.1392–0.1473. Price has respected the 0.705 Fibonacci level and formed support at 0.1485, suggesting potential for an upward move.
Trade Setup:
Entry: 0.1485
Stop-Loss: 0.1392 (below demand zone)
Target: 0.

Golden Cross means Golden Opportunity?Here's What You Need to Know About Moving Averages
One of the signs of the beginning of a bullish trend is the golden cross — a crossover between two moving averages. The shorter-period moving average (closer to the price) crosses above the longer-period moving average (farther from the price).
Whe

STEEMUSDT 1WSTEEM ~ 1W Analysis
#STEEM This is the lowest support block for now. Buy from here with a minimum target of 20%++.

STEEM USDT⚪️ SEED_DONKEYDAN_MARKET_CAP:STEEM 4D Timeframe
Simple & Bullish structure 🐃
Accumulation within key support → breakout → potential re-accumulation for the next leg up
SEED_DONKEYDAN_MARKET_CAP:STEEM heading toward $0.5474 looks inevitable ✈️
🎯 Target 1: $0.4105
🎯 Target 2: $0.5474

Prepare to BUY Spot STEEM for the Next Wave (D1-W Cycle)
🌟 Seize the Short-Term Opportunity with STEEM! 🌟
🌍 Market Overview:
STEEM is positioned for its next wave on the D1-W timeframes, offering a promising setup for short-term gains.
📊 Trade Plan:
📌 Entry Point: Below $0.27 – Accumulate at this level for an optimal position.
🎯 Target: +20% – Aiming

STEEMUSDT (STEEM) Updated till 04-01-25STEEMUSDT (STEEM) Daily timeframe range. stuck between 0.3177-0.2071 for a while now. there are not much of hold up till 0.3177 but lack of retail interest keeping it down. if it can get a valid close over 0.3177 than 0.4019 next to look into.

$Steem prediction on weekly ch. Possible Cup and Handle pattern!Hello Traders,
I have been observing a solid Cup and Handle pattern on the weekly chart. As a general rule, cup and handle patterns are considered bullish price formations. Pay close attention to the $0.30 level. If we can close the weekly candle above this level, it will confirm the pattern

STEEM/USDT BREAK Possibility STEEM/USDT BREAK Possibility
The coin has a high chance of breaking in the coming time.
We will follow this coin to see if it can gain new levels.
Normally this coin is not standard for trading, but it shows a new volume trending view.

See all ideas
Summarizing what the indicators are suggesting.
Oscillators
Neutral
SellBuy
Strong sellStrong buy
Strong sellSellNeutralBuyStrong buy
Oscillators
Neutral
SellBuy
Strong sellStrong buy
Strong sellSellNeutralBuyStrong buy
Summary
Neutral
SellBuy
Strong sellStrong buy
Strong sellSellNeutralBuyStrong buy
Summary
Neutral
SellBuy
Strong sellStrong buy
Strong sellSellNeutralBuyStrong buy
Summary
Neutral
SellBuy
Strong sellStrong buy
Strong sellSellNeutralBuyStrong buy
Moving Averages
Neutral
SellBuy
Strong sellStrong buy
Strong sellSellNeutralBuyStrong buy
Moving Averages
Neutral
SellBuy
Strong sellStrong buy
Strong sellSellNeutralBuyStrong buy
Displays a symbol's price movements over previous years to identify recurring trends.