SIGNUSDT Forming Falling WedgeSIGNUSDT is currently forming a falling wedge pattern, which is considered one of the strongest bullish reversal setups in technical analysis. This structure suggests that sellers are losing strength while buyers are quietly stepping in, preparing for an upside breakout. With strong support levels h

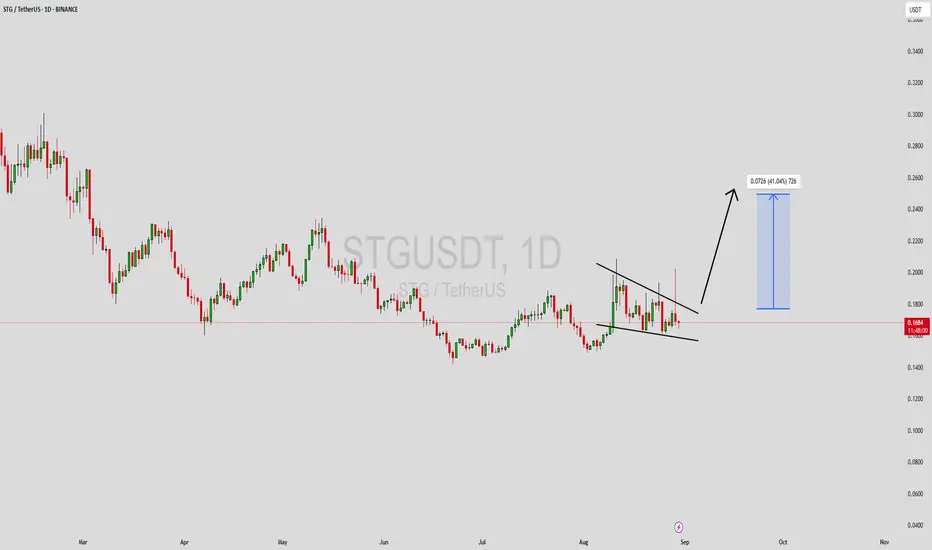
STGUSDT 1D#STG has broken above the symmetrical triangle resistance on the daily chart. A retest of the triangle and the daily EMA100 is possible before the next leg up. In case of a successful bounce, the potential targets are:
🎯 $0.2151
🎯 $0.2324
🎯 $0.2571
🎯 $0.2885
⚠️ Always remember to use a tight stop-

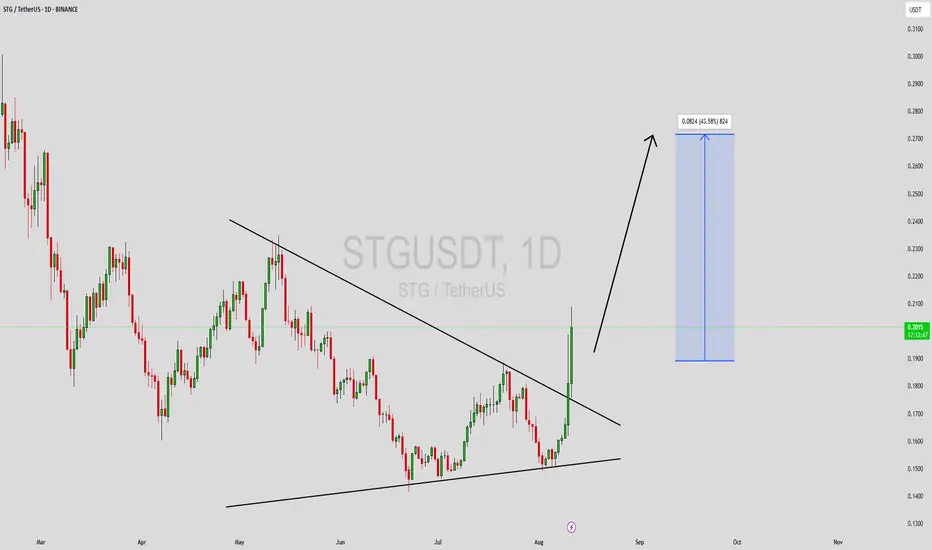
STGUSDT UPDATE#STG
UPDATE
STG Technical Setup
Pattern: Bullish falling wedge breakout
Current Price: $0.1916
Target Price: $0.318
Target % Gain: 70.80%
STG has confirmed a breakout from a falling wedge on the 1D timeframe, signaling strong bullish momentum with upside potential toward $0.318. Always use prope

STGUSDT Forming Symmetrical TriangleSTGUSDT is currently consolidating within a Symmetrical Triangle pattern, a formation that often signals a potential breakout. This type of structure generally represents a period of indecision in the market where buyers and sellers are in balance, but as the range narrows, a strong move is usually
STGUSDT Forming Descending WedgeSTGUSDT is currently caught in a well-defined descending wedge pattern, which most traders recognize as one of the more reliable bullish reversal setups. The price action has been narrowing between descending resistance and a rising support line, signaling a potential shift in momentum. Now that STG
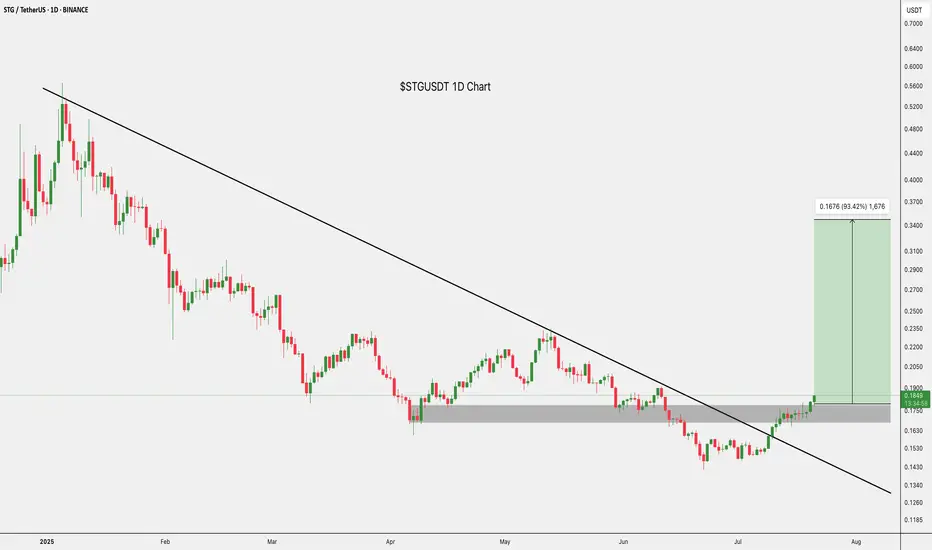
$STG Breakout 93% Move Ahead?NYSE:STG just broke out of a long-term downtrend and flipped the $0.1644–$0.1786 zone into support.
If this level holds, it could rally toward $0.3480, nearly 93% upside.
Momentum looks strong, and the breakout is clean.
One to watch closely.
DYOR, NFA

STG/USDTKey Level Zone : 0.4380 - 0.4420
HMT v4.1 detected. The setup looks promising, supported by a previous upward/downward trend with increasing volume and momentum, presenting an excellent reward-to-risk opportunity.
HMT (High Momentum Trending):
HMT is based on trend, momentum, volume, and market st

Stargate Finance 500% Easy Target (Withdrawals)It will be easy... Do you remember why I label this as an 'easy target'?
I use the term 'easy' when the pair in question can go beyond what is shown on the chart. STGUSDT (Stargate Finance) can grow much more than 500% in the coming months, making this target an easy one.
Good evening my fellow Cry

"STG/USDT targets $2-$5 amid bullish momentum and Vitalik buzz!
Chart Analysis:
1. Current Price: STG is trading at $0.4167, above the 50-day EMA ($0.3561) and the 200-day EMA ($0.3695), indicating a short-term bullish trend.
2. Key Resistance Levels:
- $0.5662: Immediate resistance, as it marks a previous price reaction zone.
- $0.7293: A critical leve

See all ideas
Summarizing what the indicators are suggesting.
Oscillators
Neutral
SellBuy
Strong sellStrong buy
Strong sellSellNeutralBuyStrong buy
Oscillators
Neutral
SellBuy
Strong sellStrong buy
Strong sellSellNeutralBuyStrong buy
Summary
Neutral
SellBuy
Strong sellStrong buy
Strong sellSellNeutralBuyStrong buy
Summary
Neutral
SellBuy
Strong sellStrong buy
Strong sellSellNeutralBuyStrong buy
Summary
Neutral
SellBuy
Strong sellStrong buy
Strong sellSellNeutralBuyStrong buy
Moving Averages
Neutral
SellBuy
Strong sellStrong buy
Strong sellSellNeutralBuyStrong buy
Moving Averages
Neutral
SellBuy
Strong sellStrong buy
Strong sellSellNeutralBuyStrong buy
Displays a symbol's price movements over previous years to identify recurring trends.