SIGNUSDT Forming Falling WedgeSIGNUSDT is currently forming a falling wedge pattern, which is considered one of the strongest bullish reversal setups in technical analysis. This structure suggests that sellers are losing strength while buyers are quietly stepping in, preparing for an upside breakout. With strong support levels holding well, the chart points toward an upcoming move that could generate gains in the range of 30% to 40%+.
Trading volume has remained steady, reflecting consistent interest from market participants. If volume increases alongside a breakout, it would add significant confirmation to the bullish outlook. This could pave the way for a strong rally, making SIGNUSDT an attractive opportunity for both short-term traders and long-term investors.
Market sentiment is showing improvement as investors increasingly recognize the potential of this project. The technical setup, combined with growing community attention, signals that SIGNUSDT could soon be poised for a breakout-driven rally that aligns well with current bullish momentum in the crypto space.
✅ Show your support by hitting the like button and
✅ Leaving a comment below! (What is You opinion about this Coin)
Your feedback and engagement keep me inspired to share more insightful market analysis with you!
Trade ideas

STGUSDT 1D#STG has broken above the symmetrical triangle resistance on the daily chart. A retest of the triangle and the daily EMA100 is possible before the next leg up. In case of a successful bounce, the potential targets are:
🎯 $0.2151
🎯 $0.2324
🎯 $0.2571
🎯 $0.2885
⚠️ Always remember to use a tight stop-loss and follow proper risk management.

STGUSDT UPDATE#STG
UPDATE
STG Technical Setup
Pattern: Bullish falling wedge breakout
Current Price: $0.1916
Target Price: $0.318
Target % Gain: 70.80%
STG has confirmed a breakout from a falling wedge on the 1D timeframe, signaling strong bullish momentum with upside potential toward $0.318. Always use proper risk management when trading.

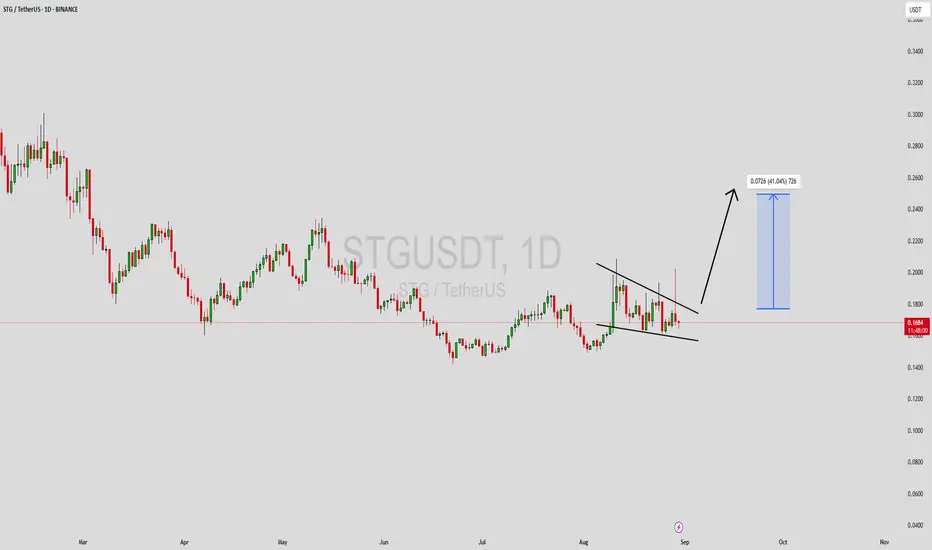
STGUSDT Forming Symmetrical TriangleSTGUSDT is currently consolidating within a Symmetrical Triangle pattern, a formation that often signals a potential breakout. This type of structure generally represents a period of indecision in the market where buyers and sellers are in balance, but as the range narrows, a strong move is usually triggered. With volume showing signs of strength, the probability of an upward breakout increases, opening the door for a solid bullish continuation.
Traders are eyeing a potential 30% to 40% gain from the current levels if the breakout confirms to the upside. The contracting price action inside the triangle suggests that market participants are building positions, and once the breakout occurs, volatility is expected to rise. Such setups are considered reliable when paired with good volume, making STGUSDT a coin of interest at the moment.
Investor confidence is also growing as more attention shifts toward this project, adding further support to the bullish outlook. The increasing participation shows that traders are preparing for possible momentum that could push STGUSDT into a new price zone. Holding above key support levels will be crucial to maintaining this bullish structure.
✅ Show your support by hitting the like button and
✅ Leaving a comment below! (What is You opinion about this Coin)
Your feedback and engagement keep me inspired to share more insightful market analysis with you!
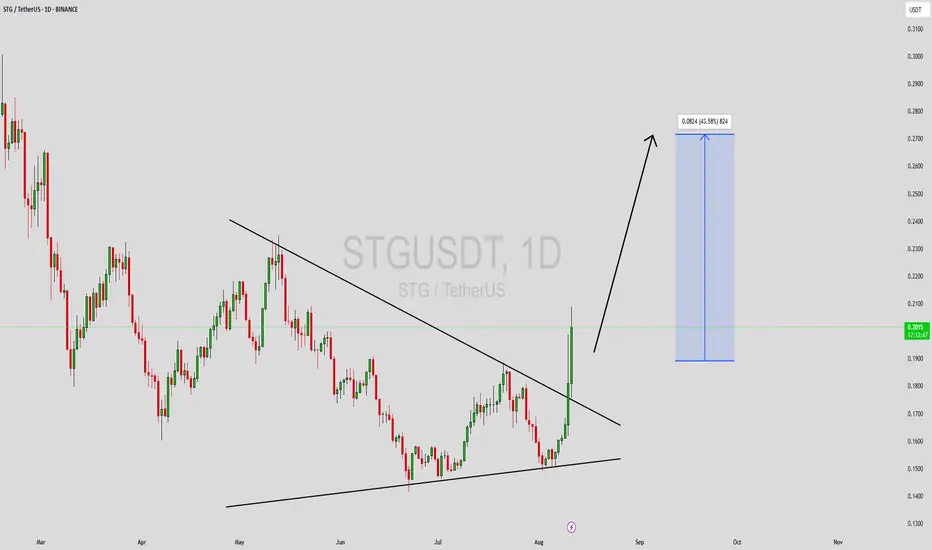
STGUSDT Forming Descending WedgeSTGUSDT is currently caught in a well-defined descending wedge pattern, which most traders recognize as one of the more reliable bullish reversal setups. The price action has been narrowing between descending resistance and a rising support line, signaling a potential shift in momentum. Now that STG has broken decisively above the upper trendline, it's flashing bullish intent, and with healthy volume backing the move, the stage is set for a 30%–40%+ rally once upside targets are met.
Technical indicators are lining up in STG’s favor. The token recently traded above its 200-period EMA, a sign of strengthening trend direction. Momentum indicators like RSI and MACD are climbing, providing further confidence in the breakout's validity. The rising volume adds more weight to the move — showing that buyers are stepping in with conviction.
From a narrative perspective, STG is back in the spotlight thanks to heightened investor interest and industry chatter. Most recently, a high-impact news development—LayerZero's proposal to acquire Stargate Bridge—acted as a powerful price catalyst. That news sparked a resurgence of momentum and renewed speculation, fueling upside moves across crypto communities.
If you're looking for a technical setup with a clear structure, strong volume, and narrative tailwinds, STGUSDT is delivering just that. Watch for powerful breakout dynamics and keep an eye on resistance zones; this chart has many of the traits of a breakout-ready setup.
✅ Show your support by hitting the like button and
✅ Leaving a comment below! (What is your opinion about this Coin)
Your feedback and engagement keep me inspired to share more insightful market analysis with you!
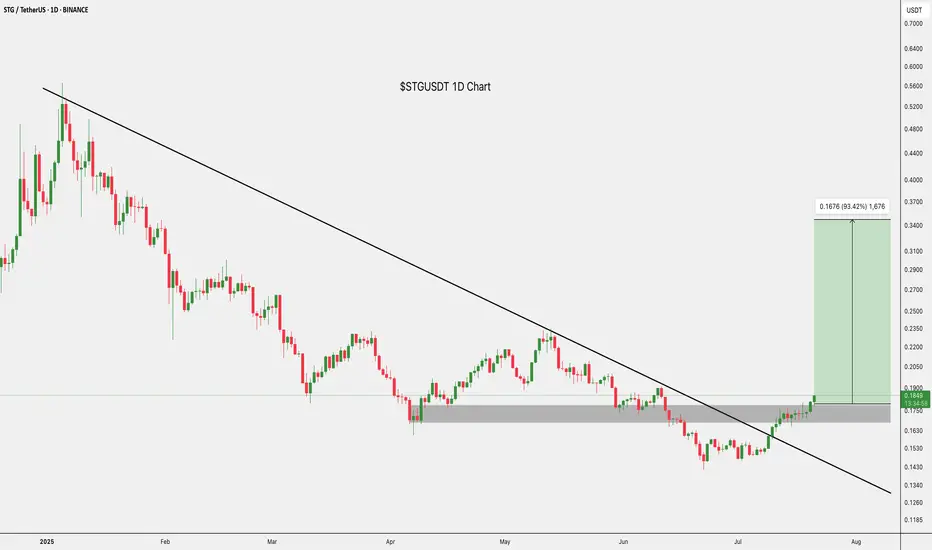
$STG Breakout 93% Move Ahead?NYSE:STG just broke out of a long-term downtrend and flipped the $0.1644–$0.1786 zone into support.
If this level holds, it could rally toward $0.3480, nearly 93% upside.
Momentum looks strong, and the breakout is clean.
One to watch closely.
DYOR, NFA

STG/USDTKey Level Zone : 0.4380 - 0.4420
HMT v4.1 detected. The setup looks promising, supported by a previous upward/downward trend with increasing volume and momentum, presenting an excellent reward-to-risk opportunity.
HMT (High Momentum Trending):
HMT is based on trend, momentum, volume, and market structure across multiple timeframes. It highlights setups with strong potential for upward movement and higher rewards.
Whenever I spot a signal for my own trading, I’ll share it. Please note that conducting a comprehensive analysis on a single timeframe chart can be quite challenging and sometimes confusing. I appreciate your understanding of the effort involved.
Important Note :
Role of Key Levels:
- These zones are critical for analyzing price trends. If the key level zone holds, the price may continue trending in the expected direction. However, momentum may increase or decrease based on subsequent patterns.
- Breakouts: If the key level zone breaks, it signals a stop-out. For reversal traders, this presents an opportunity to consider switching direction, as the price often retests these zones, which may act as strong support-turned-resistance (or vice versa).
My Trading Rules
Risk Management
- Maximum risk per trade: 2.5%.
- Leverage: 5x.
Exit Strategy
Profit-Taking:
- Sell at least 70% on the 3rd wave up (LTF Wave 5).
- Typically, sell 50% during a high-volume spike.
- Adjust stop-loss to breakeven once the trade achieves a 1.5:1 reward-to-risk ratio.
- If the market shows signs of losing momentum or divergence, ill will exit at breakeven.
The market is highly dynamic and constantly changing. HMT signals and target profit (TP) levels are based on the current price and movement, but market conditions can shift instantly, so it is crucial to remain adaptable and follow the market's movement.
If you find this signal/analysis meaningful, kindly like and share it.
Thank you for your support~
Sharing this with love!
HMT v2.0:
- Major update to the Momentum indicator
- Reduced false signals from inaccurate momentum detection
- New screener with improved accuracy and fewer signals
HMT v3.0:
- Added liquidity factor to enhance trend continuation
- Improved potential for momentum-based plays
- Increased winning probability by reducing entries during peaks
HMT v3.1:
- Enhanced entry confirmation for improved reward-to-risk ratios
HMT v4.0:
- Incorporated buying and selling pressure in lower timeframes to enhance the probability of trending moves while optimizing entry timing and scaling
HMT v4.1:
- Enhanced take-profit (TP) target by incorporating market structure analysis

Stargate Finance 500% Easy Target (Withdrawals)It will be easy... Do you remember why I label this as an 'easy target'?
I use the term 'easy' when the pair in question can go beyond what is shown on the chart. STGUSDT (Stargate Finance) can grow much more than 500% in the coming months, making this target an easy one.
Good evening my fellow Cryptocurrency trader, we are about to start a new week now and this week will be positive and green for the Cryptocurrency market.
How are you feeling in this wonderful day?
Here is Sunday night, by the time you read this, it is likely to be Monday. A fresh week starts and the market will be full green. That's great.
Looking at STGUSDT on the weekly timeframe we can appreciate the highest buy volume since August 2022. This is happening after a new All-Time Low. It is early, this pair is now starting to recover and soon it will produce astonishing growth.
The great part is not the buying nor the holding, the best part is to see your volume rise, your capital as the market grows. The next best part is to collect and enjoy the profits you secure with your trades. Remember, you must sell in order to win. Holding is necessary but after buying, we have to sell.
Try it. Make a habit of withdrawing small amounts as the market grows. In this way you will be ready to withdraw big time when we reach the top. You don't have to do it now though, right now is the time for buying, buy and hold.
This pair looks great and I believe it will produce massive growth. We are LONG, up and ready.
Thanks a lot for your support.
Namaste.

"STG/USDT targets $2-$5 amid bullish momentum and Vitalik buzz!
Chart Analysis:
1. Current Price: STG is trading at $0.4167, above the 50-day EMA ($0.3561) and the 200-day EMA ($0.3695), indicating a short-term bullish trend.
2. Key Resistance Levels:
- $0.5662: Immediate resistance, as it marks a previous price reaction zone.
- $0.7293: A critical level to breach for bullish momentum continuation.
- $0.8782: Strong resistance zone before entering the $1 range.
3. Volume: Recent spikes in volume suggest increased buying interest.
4. Potential Upside Targets:
- $2: A significant psychological and technical resistance, requiring a breakout above $0.8782 and consistent volume.
- $3: Mid-term target, achievable if $2 holds as support.
- $5: A long-term target, contingent on a sustained macroeconomic and market-wide crypto rally.
Vitalik Buterin's Involvement:
Recent reports about Vitalik Buterin's mention or potential association with STG might fuel speculative interest, leading to increased buying pressure. His name often correlates with trust and excitement in the crypto community. However, without clear confirmation or significant utility driven by his involvement, this may remain speculative.
Conclusion:
- Short Term: Watch for a breakout above $0.5662 and sustained volume.
- Mid to Long Term: Achieving $2, $3, and $5 depends on broader market conditions, ecosystem development, and concrete news about Buterin's role.

STG/USDTKey Level Zone : 0.3581-0.3657
HMT v3.0 detected. The setup looks promising, supported by a previous upward/downward trend with increasing volume and momentum, presenting an excellent reward-to-risk opportunity.
HMT (High Momentum Trending):
HMT is based on trend, momentum, volume, and market structure across multiple timeframes. It highlights setups with strong potential for upward movement and higher rewards.
Whenever I spot a signal for my own trading, I’ll share it. Please note that conducting a comprehensive analysis on a single timeframe chart can be quite challenging and sometimes confusing. I appreciate your understanding of the effort involved.
If you find this signal/analysis meaningful, kindly like and share it.
Thank you for your support~
Sharing this with love!
HMT v2.0:
- Major update to the Momentum indicator
- Reduced false signals from inaccurate momentum detection
- New screener with improved accuracy and fewer signals
HMT v3.0:
- Added liquidity factor to enhance trend continuation
- Improved potential for momentum-based plays
- Increased winning probability by reducing entries during peaks

STG/USDT Bearish Outlook: Downtrend Confirmed - Watch Key Levels
📉 STG/USDT is showing a strong bearish trend across multiple timeframes. Following a pullback, the price is under pressure, indicating potential for further downside. This analysis highlights key support/resistance levels, trend directions, and potential trading scenarios.
Timeframe Analysis:
5min: 🐻 Price below 20 SMA, RSI < 50, Bearish MACD. Short-term selloff.
30min: 🐻 Price below 20 SMA, RSI < 50, Bearish MACD. Bearish continuation.
1H: 🐻 Price below 20 SMA, RSI < 50, Bearish MACD. Bearish continuation, possible consolidation.
Daily: 🐻 Price below 20 SMA, RSI < 50, Bearish MACD. Clear downtrend, potential for further downside.
Key Levels:
Support: $0.30 (psychological), $0.28, $0.25
Resistance: $0.33, $0.36
Indicators:
20 SMA: Price below on all TFs = Bearish.
RSI: < 50 across all TFs, indicating bearish momentum.
MACD: Bearish crossovers below zero line across all TFs.
Potential Scenarios:
Bearish Continuation: Price likely to test lower supports at $0.28 & $0.25.
Double Bottom Potential: 4H chart shows potential formation for double bottom, watch for confirmation and neckline breakout.
Consolidation: A period of sideways trading may also be seen.
Trading Strategy:
SELL/HOLD: Recommended to sell or hold positions with stop losses.
Short Positions: Consider shorts on rallies to $0.33, stop-loss above.
Take Profit: Target $0.28 initially, then $0.25.
Stop Loss: For shorts, consider a stop loss above $0.33. Move existing stop losses down to $0.32 or $0.31.
Avoid Buying: Downtrend is strong, avoid buying.
Risk Management:
Monitor for oversold conditions, which doesn't guarantee a reversal.
Be cautious of shifts in market sentiment.
Keep an eye on overall crypto market correlation.
#STG #STGUSDT #Crypto #Trading #TechnicalAnalysis #Bearish #Altcoin #TradingView

STGUSDT 4DSTG Update ~ 4D
#STG If you still have Conviction on this coin. Buy in increments from here with a short term target of at least 20%+

STGUSD Technical Analysis: Bulls taking charge?
STGUSDT is showing promising signs of a potential trend reversal, with several technical indicators aligning in favor of the bulls.
Evidence for a Bullish Reversal:
Strong Support: The recent bounce from the $0.33 support level demonstrates strong buying interest at this key level.
Resistance Breakout: The price has convincingly broken above the resistance zone of $0.37 - $0.38, signaling a potential shift in momentum.
MACD Confirmation: The MACD has crossed above the zero line and confirmed a bullish crossover, further supporting the bullish scenario.
Healthy Volume: The volume during the recent upward price action has been relatively healthy, indicating genuine buying conviction.
Potential Upside Targets:
Short-term Target: The descending trendline, currently around $0.40, represents the first major obstacle for the bulls. A break above this trendline could open the door for further gains.
Medium-term Target: If the bullish momentum continues, the next target could be the previous high around $0.43.
Risk Management:
Stop-loss: Traders can consider placing a stop-loss order below the recent swing low around $0.35 to protect against a potential reversal.
Trailing Stop: As the price moves higher, consider using a trailing stop-loss to lock in profits and manage risk.
Conclusion:
STGUSDT appears to be entering a bullish phase, with several technical indicators supporting this outlook. While some risks remain, the potential rewards for the bulls seem to outweigh the risks at this point.

STGUSDT 4DSTG ~ 1W
#STG If you still have Conviction on this coin. Buy in increments from here with a short term target of at least 20%+,, bulls will start pumping prices from here.

Stargate finance ( STG)Stg usdt Daily analysis
Time frame 4 hours
Risk rewards ratio >1.3 👈
Stg is an omnichain-native asset bridge designed to solve the blockchain trilemma , which says blockchain can be desensitized, secure and fast simultaneously.
STG is a good and promising currency in the crypto market. Given the strong team it has, I expect very good growth. Although STG has strong competitors in DeFi such as Polkadot. One of the advantages of StG over Dot is its speed of operation, and of course it has other advantages.
Technical analysis:
Stg is moving between 2 parallel line for 8 week. It's very good movement for traders.
Buy in down and sell in up. But I think in alt season STG will break this parallel and pump. But I have a short time analysis.
When STG break the upper side , I'll reach my target and start to another analysis to higher target

Skt (aka sktrgt)I am an amateur trader. I sometimes enter into trades. Other times it is only an analysis. Trade with your own risk awareness.
69%

STGUSDT 1WSTG ~ 1W
#STG If you still have Conviction on this coin. Buy in increments from here with a short term target of at least 20%+


STG Possible ScenarioSTG Possible Scenario
Breakout of main trendline
Retest of big Breakout
Breakout of MA

STGUSDT (StargateFinance) Updated till 09-11-24STGUSDT (StargateFinance) Daily timeframe range. we can see a nice move here now all it needs a clean close over 0.4177 that can push it further. for the pump not get invalid it needs to stay above 0.3147. re-entry is valid from recent support from a retrace candle.

Stargate Finance Bottom Pattern & Bullish ActionIt is very easy to spot a reversal pattern and long-term lower low on this chart. This is the so called bullish lower low.
It is bullish because everything is about to grow.
We have two give away signals on the chart, the 1,2 sequence and the Adam & Eve formation.
We see a long lower wick on #1 and then a cup pattern as #2. Pretty interesting.
More interesting is the fact that we have so many green sessions recently. Even with Bitcoin turning red right now, as I write this, this pair continues full green.
The lower low means that the market no longer needs to hunt for liquidity and is ready for a new and strong bullish phase.
This one looks good now. Allow time for it to grow.
Patience is key.
In 2025 with Crypto, we can all achieve success, we can all win.
If you are reading this now, you have great timing.
And timing is really important because getting a low entry price makes it so easy when everything becomes fuzzy when the action is already underway.
I know it is hard to buy low, but you will be happy with the results.
Think long-term.
➖ Buy at the bottom.
➖ Sell at the top.
Namaste.

STGUSDT 1D#STG has broken out of the falling wedge to the upside and is now encountering the daily MA50. In the event of a successful retest of the pattern and flipping above the MA50, the targets are:
🎯 $0.4066
🎯 $0.5000
🎯 $0.5756
🎯 $0.6511
🎯 $0.7586
