🔥 STG Breaking Out: High Risk Reward PotentialSTG has been trading bearish for almost all year. However, as of this morning the dotted purple resistance has been broken, giving way for more potential growth in the near future.
My target is the 2023 top, stop under the recent swing low. A more defensive trade would be to take partial profits around 0.72 and/or 0.95
Trade ideas

stgusdtEVERY CANDLE HAS LIQUIDITY.
PRICE ALWAYS NEED LIQUIDITY.
Nobody Knows Where is Price Going.
Hey traders, here is the analysi.
If you guys like my analysis please hit like?? and follow.
Thanks.
DISCLAIMER- This is not financial advice.
SMART MONEY CONCEPT.
identify Liquidity Or Become Liquidity

#STG🔰#STG - Crypto - Binance
🟩 BUY TRADE !
🛒 Good Entry Between : CP - 0.6780
🔸 Triangle pattern ABCD has founded
🔸 Above Support.
🔸 Profits 5%, 10%, 15% & 20%.
🔸 After Achieving 1st target (5%), Move stop lose to entry.
🔸 Stop Lose Mentioned in the drawing.
🔸 Stop loss after the close of the 4-hour candle.
—
TDAWLY ©

STG LOOKS BULLISHHi, dear traders. how are you ? Today we have a viewpoint to BUY/LONG the STG symbol.
For risk management, please don't forget stop loss and capital management
When we reach the first target, save some profit and then change the stop to entry
Comment if you have any questions
Thank You

AB=CD STGUSDT LONG Got my long entry for 6.24 RR ON stgusdt
My stop is breaking C point .
Expecting bullish move for this coin


STG ANALYSIS Hi, dear traders. how are you ? Today we have a viewpoint to BUY/SELL the STG symbol.
For risk management, please don't forget stop loss and capital management
When we reach the first target, save some profit and then change the stop to entry
Comment if you have any questions
Thank You

Stg It's Over Stgusdt
Losing Support / No Volume
Expecting Breakdown incase of successful breakdown it will drop 40-60%

stg targetthe major order block is 0.90 cents there is a trendline thats being respected with a break in that we go to the i0cent reject back to the trend for a retest

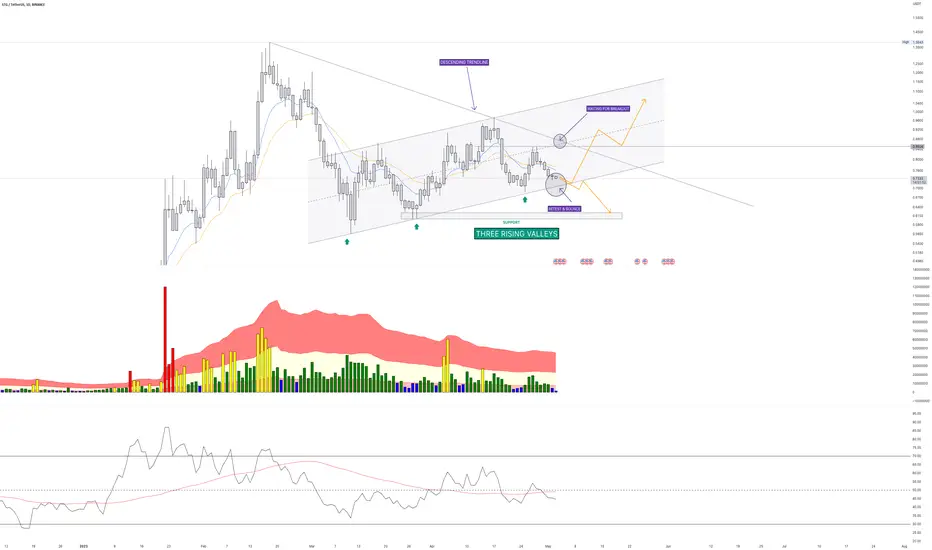
STGUSDT Bullish Scenario: Potential 34% Increase#STGUSDT continues to show a strong long-term uptrend, which has been validated by the recent bounce off the uptrend trendline. This is a bullish signal and indicates that the price of #StargateFinance is likely to continue its upward trajectory in the near future.
Additionally, the recent rejection of the 88.6% Fibonacci support level, which also corresponds to the VolumeProfile support, further strengthens the bullish scenario. This indicates that there is significant demand for #STG at this price level and that buyers are stepping in to support the market.
Overall, the $0.70 price level is a critical demand zone for #STG, and as long as it holds, we can expect the price to continue its upward momentum towards the April high. This presents a potential 34% price increase in the mid-term, making it an attractive opportunity for traders and investors alike.

STG Long ideaSTG is building massive symmetrical triangle on daily TF!
in case of bullish breakout we can expect 100% move

Waiting for a confirmation to open positionDaily TF
STG's going to support zone.
Just waiting for a confirmation for Long/Short Order in lower TF
Wait and see
STGUSDT LONG IDEAIt seems that STG has changed its trend from downtrend to uptrend by changing the character and making higher low and higher high.
⚠️ Disclaimer: This chart and analysis are not meant to be, and do not constitute financial, investment, trading, or other types of advice or recommendations. #DYOR

STGUSDT uptrend after Bullish DivergenceOn the recent strong pullback, STG has respected the previously formed demand area.
This validates the uptrend, and price is likely to continue rising towards the VP resistance.

STGUSDTHow do you do,
*Mars Signals Team wishes you high profits*
This is a one-day-time frame analysis for STGUSDT
Clearly, R4, R3, and R2 are the resistance areas in this chart with their presentation of the disability of the price to rise at several points. R1 used to be a support area. And S1 is our support area at the bottom that contains the support of price at some different points. As it is shown in the chart, the price experienced a severe fall down to S1 and by the time it was not able to rise above R3 at several points, it had a rejection and decline each time after touching the mentioned area. Then when it was rejected at R3 for the last time and by receiving support at S1, it rose again toward our first resistance area. Thus, it is fluctuating in R1 area now and we predict it to provide us two scenarios. One of them is breaking R1 upward and by giving us some fixation and fluctuation, more rise is there for it to touch higher amounts including R2 or R3. But by the time the price falls below R1 and loses the support, definitely more decline will happen then. According to the chart, we believe the price would have some correction and it is possible to fall toward S1 and then start another rise upward. Please consider the market situation in lower time frames and then decide what to do exactly. We suggest you to save your profits in the resistance areas due to the fact that in the decline of the price, you will not have so much loss. Keep moving with our updates and analyses to have multiple pieces of information and ideas.
Warning: This is just a suggestion and we do not guarantee profits. We advise you to analyze the chart before opening any positions.
Wish you luck

STGUSDT - Short Scalp- Price creates Buy Side Liquidity on the 1H TF, then clears this liquidity by taking out its highs
- Price then retraces back down with displacement (aggressive selling) on the 15m TF, taking out multiple lows on the way down
- Price moves back up to the 5m FVG that is in the premium zone (above the 50% FIB) and we go short here
- SL set a few ticks above the 5m FVG and TP set to 1H Sell Side Liquidity

STG levels >89c is the first major resistance in the current channel after that .96 is a resistance if we break free of that the top\ of the channel will probably throw is for a retest

STG LONGHi Traders, I'm looking at a potential long opportunity on STG, I'll be going in at 3% 30x for a 1:1 return

STG/USDT🔵🐇 #STG/USDT
📍as you can see we have a bullish divergence around a main liquidity and we have a Liquidity magnet zone as a resistance that not filled yet
🪄#Stargate Position Based On Fresh Liquidity and Order Blocks and Structures
#eth #btc #bitcoin #ethereum #cryptocurrency #crypto #Trade #trading #Invest #Trader #Signal #forex #Scalp #altcoins #chart #RTM #ICT
@aliceinmoneyland

Home work EWThe goal here is to chart Elliot waves and each wave has to be correlated with MA crosses. In addition the fibb retracement is used to confirm the corrections and reversals.


STG breaking from its structureSTG had a nice double bottom and its now breaking the neck of the structure. I would take profit at 0.965 and on 1.109 or play with moving SL and TP up to see how high can it go

STG/USDTDisclaimer: This chart and analysis are not meant to be, and do not constitute financial, investment, trading, or other types of advice or recommendations. Do your own due diligence before trading or investing in this.
