STRKUSDT — Critical Accumulation Zone Between $0.125–$0.11!
The Starknet/USDT (STRKUSDT) pair is currently moving in a mid-term consolidation phase after a prolonged downtrend since early 2025.
The chart shows a major support area (yellow block) between $0.125–$0.11, which has acted as a strong accumulation and reaction zone multiple times.
---
Structure
Related pairs

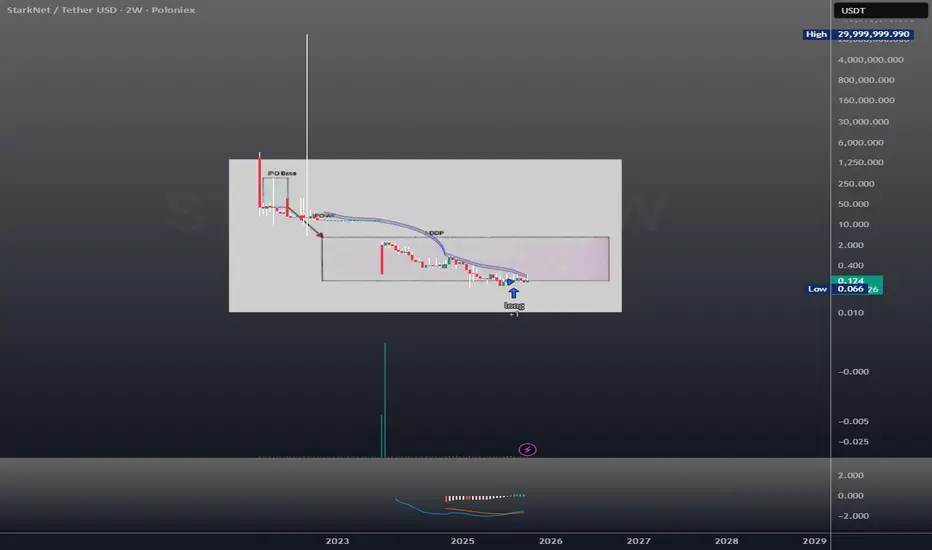
Starknet textbook Disappointment IPO Stakware/Staknet (STRK)
-------------------------------------------------------------
Textbook Disappointment IPO
The Bitcoin DeFi Layer
Supercharged by ZK Tech
DYOR
STRK (SPOT)BINANCE:STRKUSDT
#STRK/ USDT
Entry range (0.1450 - 0.1630)
SL 1D close below 0.1400
T1 0.2100
T2 0.2500
T3 0.3200
T4 0.5000
Extra Target is optional 0.6000
_______________________________________________________
Golden Advices.
********************
* collect the coin slowly in the entry range.

Base Built or Dead-Cat Drift? STRK’s Early-Cycle Make-or-Break📊 STRK Market Structure — Early-Cycle Reclaim
1W
• First potential reversal base after a 10-month decline.
• Exhaustion under $0.12–0.14; first HH attempt forming.
• $0.12 → $0.18 range expansion = first meaningful accumulation signal since early 2024.
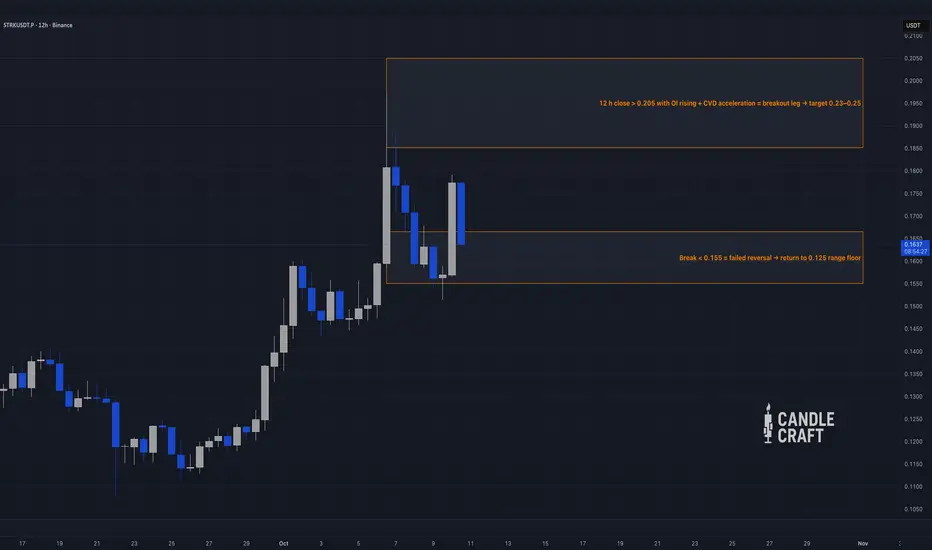
2D
• Breakout > $0.16 = minor bullish CHoCH w
STRKUSDT — Final Retest Before Liftoff or a False Breakout Trap?After months of sideways movement, STRK is finally showing signs of life. On the 2D timeframe, price action is shaping a classic breakout–retest structure, with a strong demand zone between 0.1434–0.1536, aligning perfectly with the Fibonacci golden pocket (0.5–0.618).
The story here is simple yet
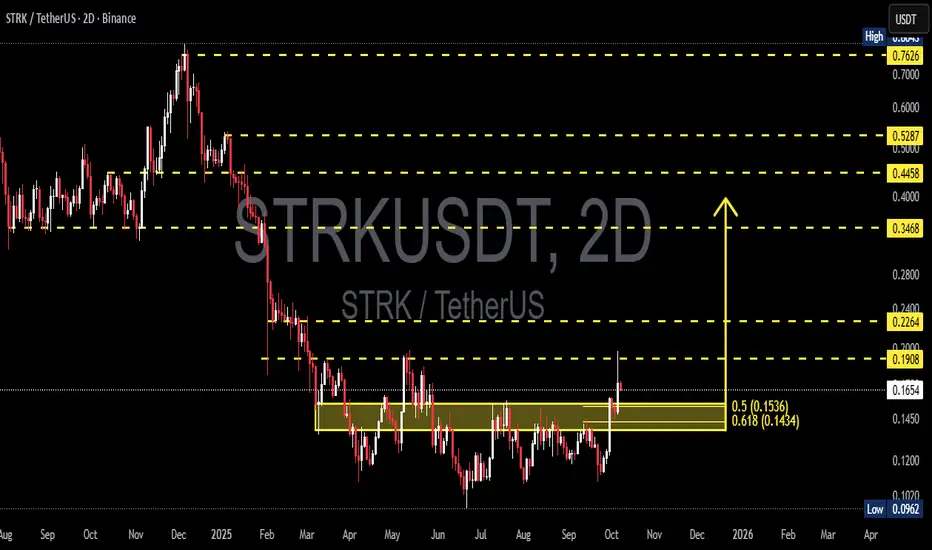
STRK / USDT : Showing strong moemtum for a bullish rallySTRK/USDT Analysis
STRK is showing strong momentum and has confirmed its breakout. If this move holds, a bullish rally towards $0.20 – $0.25 is likely in the short term.
Always manage risk wisely and avoid chasing entries without proper confirmation.
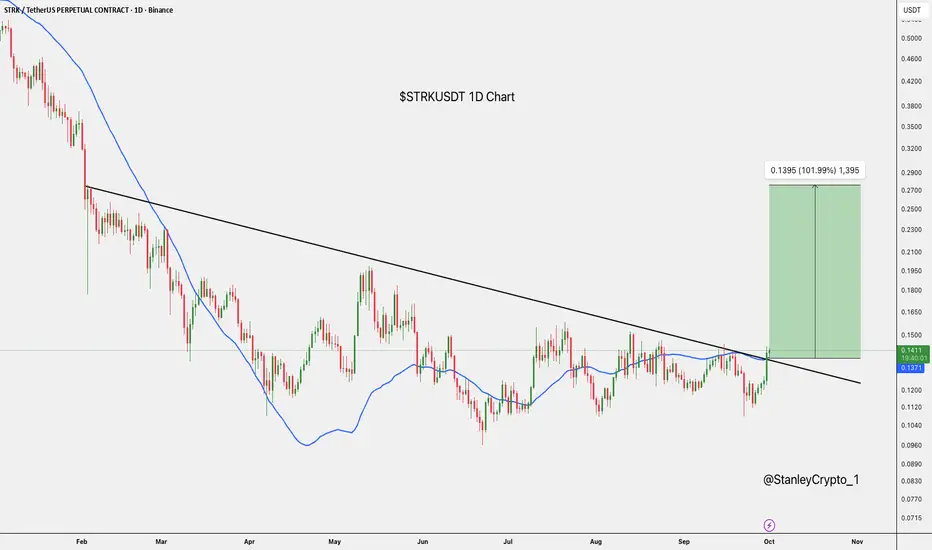
$STRKUSDT Breakout Targets 100% UpsideNASDAQ:STRK has broken out of its long-term downtrend and reclaimed the moving average.
Holding above 0.1411 could open the way toward 0.2823, nearly a 100% move, signalling a potential bullish shift after months of consolidation.
DYOR, NFA
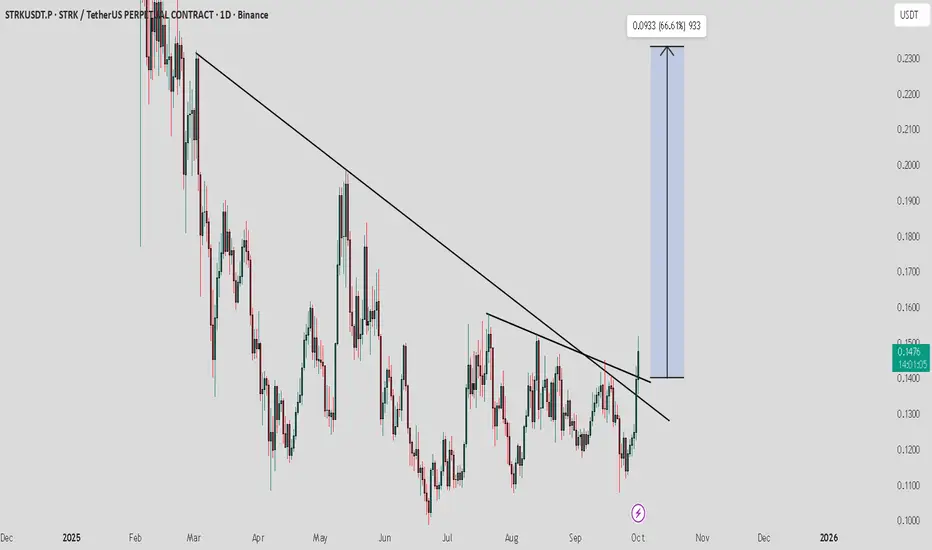
STRKUSDT Forming Descending WedgeSTRKUSDT has recently completed a breakout from a descending wedge structure, which is a bullish reversal pattern often signaling the end of prolonged consolidation. The chart shows that price action has broken above key resistance levels, supported by strong trading volume. This indicates that buyi

STRKUSDT UPDATE#STRK
UPDATE
STRK Technical Setup
Pattern: Bullish falling wedge breakout
Current Price: $0.138
Target Price: $0.205
Target % Gain: 50.75%
STRK is breaking out of a falling wedge pattern on the 1D timeframe. The move signals strong bullish momentum with potential upside toward $0.205. Continuati

$STRKPUMP Token Slumps, Leads Meme Coin Losses: Pump.fun’s native token, PUMP, recently slumped, leading losses among meme coins like Dogecoin, PEPE, and BONK, as the market stumbled.

See all ideas
Summarizing what the indicators are suggesting.
Oscillators
Neutral
SellBuy
Strong sellStrong buy
Strong sellSellNeutralBuyStrong buy
Oscillators
Neutral
SellBuy
Strong sellStrong buy
Strong sellSellNeutralBuyStrong buy
Summary
Neutral
SellBuy
Strong sellStrong buy
Strong sellSellNeutralBuyStrong buy
Summary
Neutral
SellBuy
Strong sellStrong buy
Strong sellSellNeutralBuyStrong buy
Summary
Neutral
SellBuy
Strong sellStrong buy
Strong sellSellNeutralBuyStrong buy
Moving Averages
Neutral
SellBuy
Strong sellStrong buy
Strong sellSellNeutralBuyStrong buy
Moving Averages
Neutral
SellBuy
Strong sellStrong buy
Strong sellSellNeutralBuyStrong buy
Displays a symbol's price movements over previous years to identify recurring trends.
Frequently Asked Questions
The current price of STRK3xShort/Tether (STRK) is 0.01703 USDT — it has risen 30.19% in the past 24 hours. Try placing this info into the context by checking out what coins are also gaining and losing at the moment and seeing STRK price chart.
STRK3xShort/Tether price has risen by 21.95% over the last week, its month performance shows a −93.50% decrease, and as for the last year, STRK3xShort/Tether has decreased by −99.24%. See more dynamics on STRK price chart.
Keep track of coins' changes with our Crypto Coins Heatmap.
Keep track of coins' changes with our Crypto Coins Heatmap.
STRK3xShort/Tether (STRK) reached its highest price on Aug 5, 2024 — it amounted to 8.04646 USDT. Find more insights on the STRK price chart.
See the list of crypto gainers and choose what best fits your strategy.
See the list of crypto gainers and choose what best fits your strategy.
STRK3xShort/Tether (STRK) reached the lowest price of 0.00950 USDT on Oct 20, 2025. View more STRK3xShort/Tether dynamics on the price chart.
See the list of crypto losers to find unexpected opportunities.
See the list of crypto losers to find unexpected opportunities.
The safest choice when buying STRK is to go to a well-known crypto exchange. Some of the popular names are Binance, Coinbase, Kraken. But you'll have to find a reliable broker and create an account first. You can trade STRK right from TradingView charts — just choose a broker and connect to your account.
Crypto markets are famous for their volatility, so one should study all the available stats before adding crypto assets to their portfolio. Very often it's technical analysis that comes in handy. We prepared technical ratings for STRK3xShort/Tether (STRK): today its technical analysis shows the sell signal, and according to the 1 week rating STRK shows the sell signal. And you'd better dig deeper and study 1 month rating too — it's sell. Find inspiration in STRK3xShort/Tether trading ideas and keep track of what's moving crypto markets with our crypto news feed.
STRK3xShort/Tether (STRK) is just as reliable as any other crypto asset — this corner of the world market is highly volatile. Today, for instance, STRK3xShort/Tether is estimated as 7.04% volatile. The only thing it means is that you must prepare and examine all available information before making a decision. And if you're not sure about STRK3xShort/Tether, you can find more inspiration in our curated watchlists.
You can discuss STRK3xShort/Tether (STRK) with other users in our public chats, Minds or in the comments to Ideas.