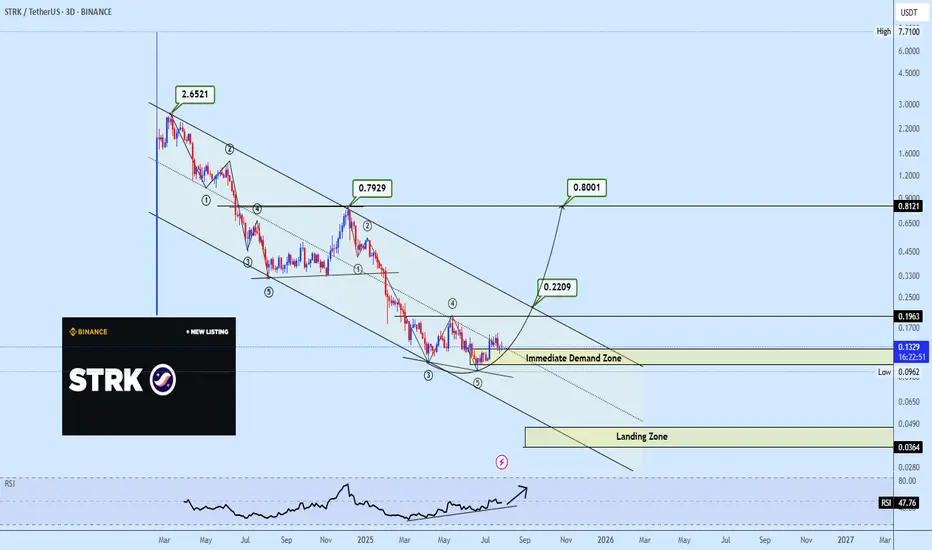
Descending Channel in Play STRK’s Next Move Could Be ExplosiveSTRKUSDT continues its decline within a well-defined descending channel, with the most recent bounce coming directly off the bottom boundary of the channel. This rebound aligns with a confirmed bullish divergence on the RSI, suggesting the current move may mark a key inflection point.
As price clim
Related pairs
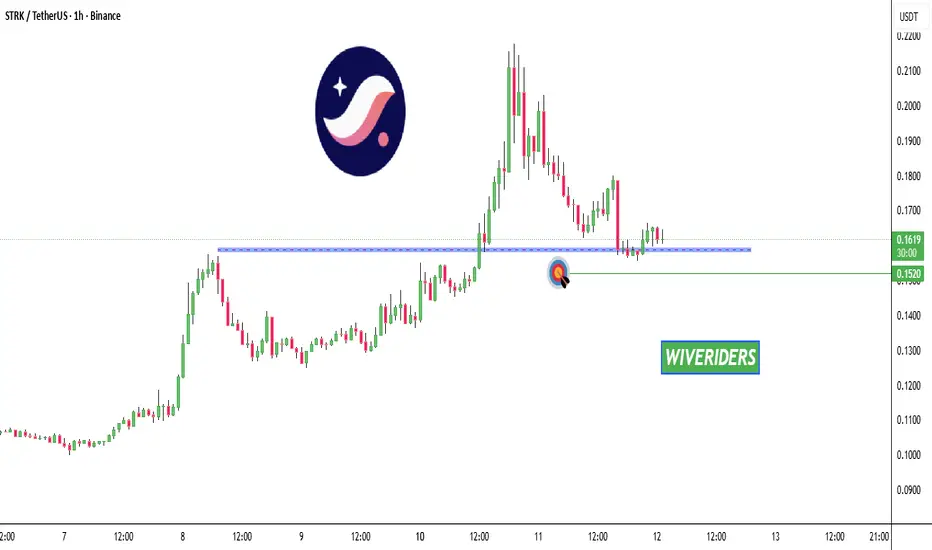
$STRK Update📊 NASDAQ:STRK Update
NASDAQ:STRK is testing the blue support level 🔵
If it breaks below, it could confirm a bearish setup 📉
The first short target would be the green line level 🟢
Scalp Short – STRK📉 Scalp Short – STRK
A strong bearish divergence has formed on the 1-hour timeframe. Selling volume is increasing and starting to dominate. After an extended overbought phase, a transition toward oversold conditions is likely.
🎯 Trade Setup:
Take Profit (TP): 0.1046
Stop Loss (SL): 0.2117
Risk/

STRK/USDT — The Calm Before the Storm: Trendline Decision Zone?For months, STRK has been trapped under a relentless downtrend, unable to escape the grip of the descending yellow line — a historical resistance wall that has rejected every rally attempt.
But this time feels different.
Price is once again testing the major descending trendline near the $0.18–$0.2

$STRK price — Testing the end of a long-term downtrendAfter months of pressure since early 2024, #STRK is attempting a breakout.
The next two daily candle closes for OKX:STRKUSDT will be crucial for confirming direction.
Above $0.17 — potential confirmation of reversal and continuation higher.
Below $0.17 — likely a stop-loss hunt before retesting s

STRK SPOT IDEA TRADEWe can see how STRK formed a range between $0.10 and $0.18 level, it was in accumulation phase for a long time and there was significant change of hands, weak holders who believed in the project but were sitting on 70-80% losses have already sold their bags. Bigger players accumulated that volume, a

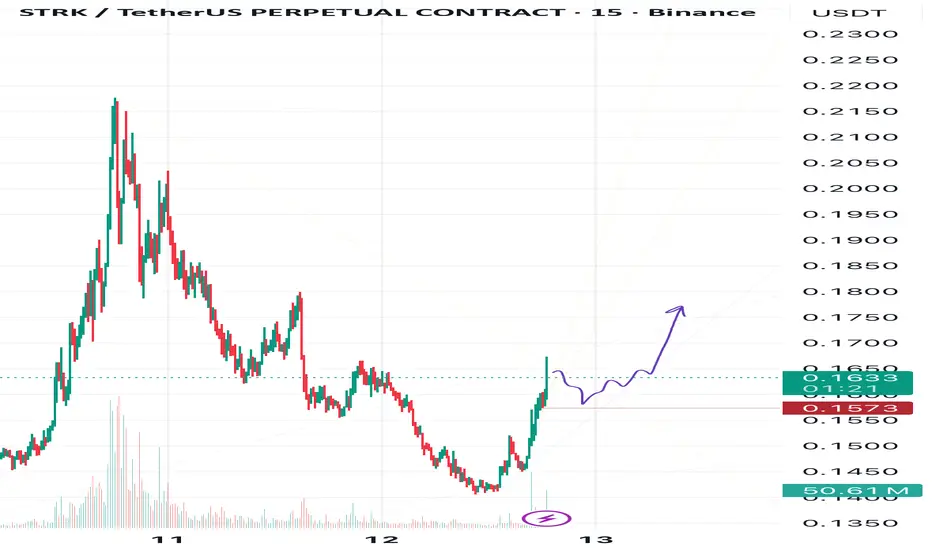
STRK About to Spark🧨STRK looks like it’s getting ready to take off.
🐂If the bullish pressure continues, we could see a strong move to the upside.
However, as always, I’ll stay cautious and watch how the price reacts near key resistance zones.
Targets:
🎯1 0.17,
🎯2— 0.176,
🎯3 — 0.182,
🚀and my global target remains at
Awaiting the Breakout Above Consolidation!Looking the daily chart, we can clearly see price has been stuck in a consolidation range for quite some time. This sideways movement indicates a battle between buyers and sellers, with neither side able to decisively take control.
The "bulls hunt" below the consolidation range, suggesting some liq

STRKUSDT 1D#STRK is currently trading within a descending channel on the daily chart. It has broken above the midline of the channel and the daily SMA200 — a bullish signal. Consider buying around the current level and near the support zones at:
💰 $0.1341
💰 $0.1215
The potential upside targets are:
🎯 $0.157

STRKUSDSTRKUSD bullish scenario.
In case of coming back to those levels, even if its a slight chance,
RR: 150 and more than 2000% up.
How much would you risk?

See all ideas
Summarizing what the indicators are suggesting.
Oscillators
Neutral
SellBuy
Strong sellStrong buy
Strong sellSellNeutralBuyStrong buy
Oscillators
Neutral
SellBuy
Strong sellStrong buy
Strong sellSellNeutralBuyStrong buy
Summary
Neutral
SellBuy
Strong sellStrong buy
Strong sellSellNeutralBuyStrong buy
Summary
Neutral
SellBuy
Strong sellStrong buy
Strong sellSellNeutralBuyStrong buy
Summary
Neutral
SellBuy
Strong sellStrong buy
Strong sellSellNeutralBuyStrong buy
Moving Averages
Neutral
SellBuy
Strong sellStrong buy
Strong sellSellNeutralBuyStrong buy
Moving Averages
Neutral
SellBuy
Strong sellStrong buy
Strong sellSellNeutralBuyStrong buy
Displays a symbol's price movements over previous years to identify recurring trends.
Frequently Asked Questions
The current price of STRK / UST (STRK) is 0.13817000 USDT — it has risen 0.63% in the past 24 hours. Try placing this info into the context by checking out what coins are also gaining and losing at the moment and seeing STRK price chart.
STRK / UST price has risen by 35.90% over the last week, its month performance shows a 8.75% increase, and as for the last year, STRK / UST has decreased by −70.75%. See more dynamics on STRK price chart.
Keep track of coins' changes with our Crypto Coins Heatmap.
Keep track of coins' changes with our Crypto Coins Heatmap.
STRK / UST (STRK) reached its highest price on Feb 20, 2024 — it amounted to 3.10890000 USDT. Find more insights on the STRK price chart.
See the list of crypto gainers and choose what best fits your strategy.
See the list of crypto gainers and choose what best fits your strategy.
STRK / UST (STRK) reached the lowest price of 0.08778200 USDT on Nov 3, 2025. View more STRK / UST dynamics on the price chart.
See the list of crypto losers to find unexpected opportunities.
See the list of crypto losers to find unexpected opportunities.
The safest choice when buying STRK is to go to a well-known crypto exchange. Some of the popular names are Binance, Coinbase, Kraken. But you'll have to find a reliable broker and create an account first. You can trade STRK right from TradingView charts — just choose a broker and connect to your account.
Crypto markets are famous for their volatility, so one should study all the available stats before adding crypto assets to their portfolio. Very often it's technical analysis that comes in handy. We prepared technical ratings for STRK / UST (STRK): today its technical analysis shows the buy signal, and according to the 1 week rating STRK shows the neutral signal. And you'd better dig deeper and study 1 month rating too — it's sell. Find inspiration in STRK / UST trading ideas and keep track of what's moving crypto markets with our crypto news feed.
STRK / UST (STRK) is just as reliable as any other crypto asset — this corner of the world market is highly volatile. Today, for instance, STRK / UST is estimated as 10.02% volatile. The only thing it means is that you must prepare and examine all available information before making a decision. And if you're not sure about STRK / UST, you can find more inspiration in our curated watchlists.
You can discuss STRK / UST (STRK) with other users in our public chats, Minds or in the comments to Ideas.