$STRKPUMP Token Slumps, Leads Meme Coin Losses: Pump.fun’s native token, PUMP, recently slumped, leading losses among meme coins like Dogecoin, PEPE, and BONK, as the market stumbled.
STRKUST trade ideas

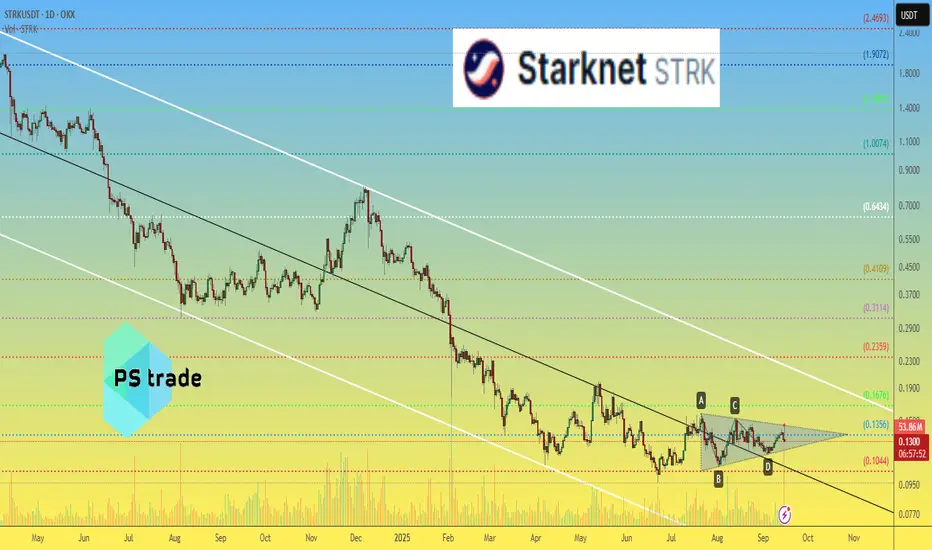
STRKUSDT 1D#STRK is moving within a symmetrical triangle on the daily chart. Enter this coin only if it breaks out above the triangle and the daily SMA200. If that happens, the potential targets are:
🎯 $0.1571
🎯 $0.1759
🎯 $0.1946
🎯 $0.2214
🎯 $0.2555
If the triangle breaks to the downside, it could retest the support level at $0.0962.
⚠️ Always remember to use a tight stop-loss and follow proper risk management.

StarkNet STRK price analysisWe have to admit, the “disappointment” price of #STRK is now stuck in consolidation — but this looks like it’s heating up for a breakout 📈
Today we even saw an attempt to push higher, but it got stopped right at the upper edge of the triangle ⛔️
Let’s make it interactive: looking at this chart, what’s your scenario for OKX:STRKUSDT 👇
▫️ Drop to $0.10 ?
▫️ Pump to $0.20 ?
▫️ Or maybe even $0.40–0.50 ?
🔥 If we see good engagement around #Starknet, we’ll share our own forecast for the move of this asset… which we don’t even care about that much 😅
❓ So, which direction do you personally expect for #STRK? Comment below 👇
______________
◆ Follow us ❤️ for daily crypto insights & updates!
🚀 Don’t miss out on important market moves
🧠 DYOR | This is not financial advice, just thinking out loud.
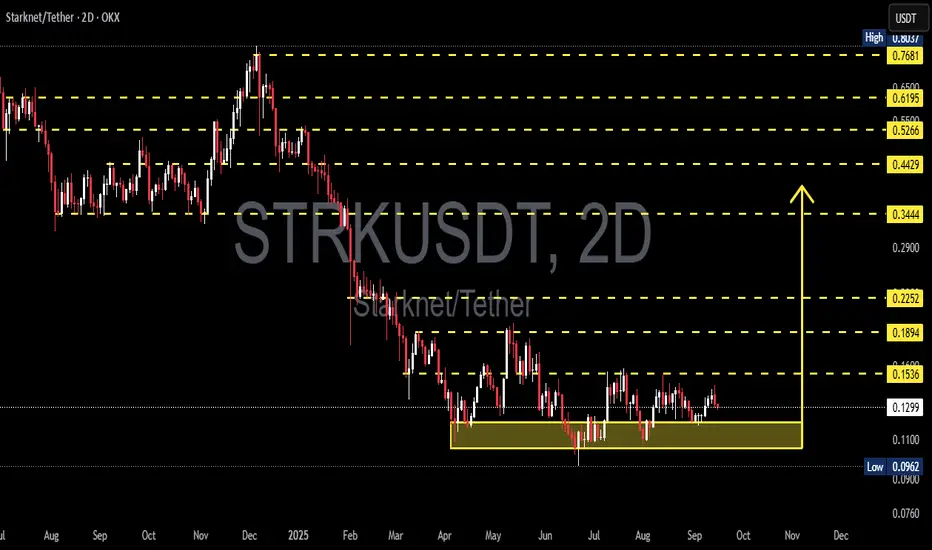
STRK/USDT — Bottom Accumulation: Beginning of a Major Reversal?
🔎 Overview
The STRK/USDT (2D) chart is showing a consolidation phase after a heavy downtrend since early 2025. Price is currently trading around 0.1299, hovering just above a key support zone at 0.096–0.11 (yellow box) which has been tested multiple times and continues to hold.
This structure resembles a rectangle accumulation pattern, often seen when buyers quietly build positions after a long selloff. If this base holds, it could mark the foundation for a mid-term reversal. If it fails, however, the broader downtrend is likely to continue.
---
📊 Key Technical Levels
Major Support:
0.1100 → upper bound of accumulation zone
0.0962 → critical low (must hold)
Key Resistances:
R1 = 0.1536 (immediate breakout trigger)
R2 = 0.1894
R3 = 0.2252
R4 = 0.3444 (potential swing target if reversal is confirmed)
---
🟢 Bullish Scenario
1. Breakout of 0.1536:
A strong 2D close above 0.1536, ideally backed by volume, would signal a bullish reversal. First target sits at 0.1894, followed by 0.2252.
2. Accumulation at Support (0.096–0.11):
Gradual accumulation near this zone offers favorable risk/reward for mid-term traders. Stop-loss should be placed just below 0.0962. If successful, upside targets range from +45% to over +150% depending on how far momentum extends.
3. Bullish Confirmation Signals:
RSI/MACD bullish divergence
Rising volume on breakout
Bullish reversal candlestick patterns at support
---
🔴 Bearish Scenario
1. Breakdown Below 0.11:
A decisive close below 0.11 — and especially below 0.0962 — would invalidate the bullish accumulation setup. This would expose STRK to further downside, potentially targeting the 0.076 zone (previous structural low).
2. False Breakout Risk:
Traders should be cautious of bull traps — where price breaks above 0.1536 but quickly falls back into the range. Such moves often occur in weak markets.
---
📐 Pattern & Market Sentiment
Pattern: Rectangle Accumulation at bottom trend
Sentiment: Neutral → turning bullish if breakout above 0.1536 is confirmed
Key Triggers:
Bullish trigger → 0.1536
Bearish trigger → 0.0962
---
⚠️ Notes
Always wait for volume confirmation on breakouts/breakdowns.
Use strict risk management and place stop-losses below/above structural levels.
Watch Bitcoin’s trend as overall market sentiment often drives altcoins.
---
🎯 Conclusion
STRK is currently sitting at a make-or-break zone. This could either be the start of a strong mid-term reversal or just a pause before further decline.
Bullish path: Break & hold above 0.1536 → targets at 0.1894 – 0.2252.
Bearish path: Break below 0.11 → retest of 0.0962 and possibly down to 0.076.
Patience and confirmation will be key.
---
#STRK #STRKUSDT #Starknet #CryptoAnalysis #CryptoTrading #PriceAction #Breakout #Accumulation #SupportResistance
STRKUSDTAccording to the previous analysis and the density and floor formation visible on the chart,
With the trend break and consolidation above it, the entry trigger is activated and we can expect at least 50 to 70 percent growth for this currency.
If you have any comments and views, please share them with us.

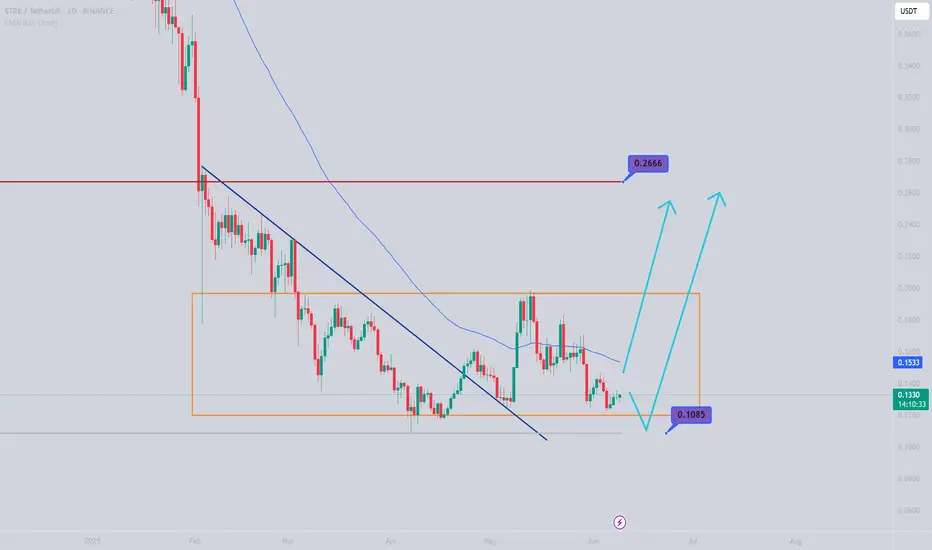
STRK /USDT : Holding support and bouncing to approach resistanceSTRK/USDT is holding strong support and climbing toward the $0.13 resistance.
A breakout above this resistance could open the way for a bullish rally toward $0.20. Keep a close watch for confirmation.
STRK / USDT : Near to support of symmetrical triangleSTRK/USDT is trading near the support of the symmetrical triangle.
Bullish scenario: If support holds, price could bounce toward the resistance at $0.13.
Bearish scenario: A breakdown from this support may drag price toward $0.096.
Always wait for confirmation before entering. Manage risk properly and trade according to market conditions.
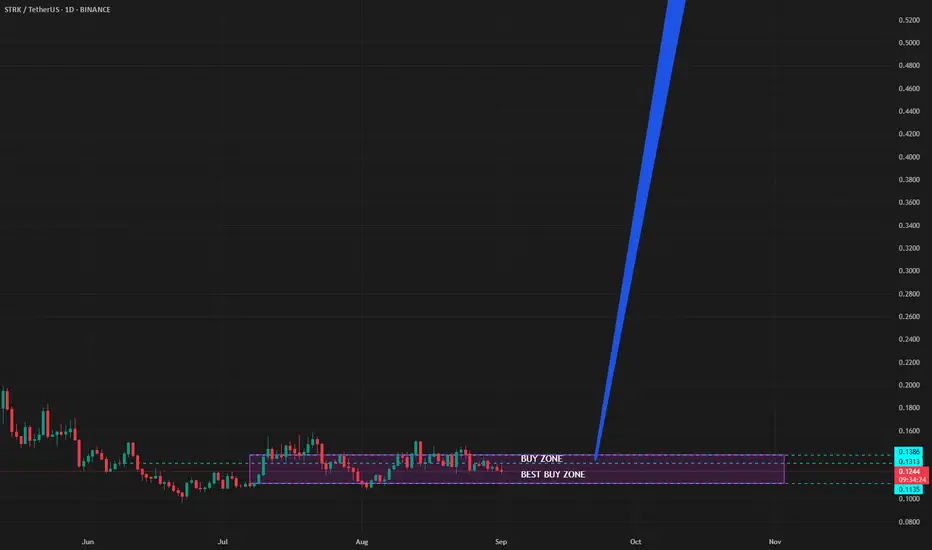
STRK/USDT – Key Buy Area & AccumulationSTRK is currently in an accumulation phase within a strategic Buy Zone, showing clear absorption after the recent correction.
Within this range, a Best Buy Zone is identified, representing the most efficient point to enter before the next bullish impulse.
The technical structure suggests that the next wave could reach the 1.23 target, with the bullish bias remaining intact as long as price holds these key zones.
STRK / STRKUSDTSAY Hiii...
GOOD LUCK >>>
• Warning •
Any deal I share does not mean that I am forcing you to enter into it, you enter in with your full risk, because I'll not gain any profits with you in the end.
The risk management of the position must comply with the stop loss.
(I am not sharing financial or investment advice, you should do your own research for your money.)

STRK Main Trend 12 04 2025Time frame 1 week for clarity.
Descending channel is the main trend.
Descending wedge is a secondary trend.
Showed the mid-term percentage for targeting potential profit within the channel after breaking through the wedge.
The price reached the lower zone of the descending channel of the main trend -96%.
This is conditionally the bottom for similar assets of such liquidity -95-98% . You can even say the minimums of minimums, beyond which there is only a complete scam, which is probably not distributed as an asset. Throughout the history of the formation of the descending channel, the trading volume was supported, many buybacks. The same volume is also pressuring to buy with “discounts”, what was previously poured "investments for billions of dollars" on Twitter during the listing.
Secondary trend, descending wedge and bearish trend break zone.
Time frame 3 days.

STRKUSDT UPDATE#STRK
UPDATE
STRK Technical Setup
Pattern: Bullish Wave Pattern
Current Price: $0.1335
Target Price: $0.22
Target % Gain: 65.66%
Technical Analysis: STRK has broken out of a falling wedge on the 1D chart and is now retesting the breakout zone around $0.13–$0.14 as support. If this zone holds, the bullish wave continuation could push price toward the $0.22 target with strong upward momentum.
Time Frame: 1D
Risk Management Tip: Always use proper risk management.

Descending Channel in Play STRK’s Next Move Could Be ExplosiveSTRKUSDT continues its decline within a well-defined descending channel, with the most recent bounce coming directly off the bottom boundary of the channel. This rebound aligns with a confirmed bullish divergence on the RSI, suggesting the current move may mark a key inflection point.
As price climbs, attention now shifts to the upper boundary of the channel, which serves as a key structural resistance. A break above this upper trendline would signify a reversal from the prevailing downtrend, validating the first higher high in the micro to mid-term, with upside potential toward $0.2422 and $0.7856, as shown on the chart.
However, failure to clear the upper boundary could trigger a sharp rejection and initiate another round of sell-off, potentially dragging price into a deeper landing zone below the demand level.
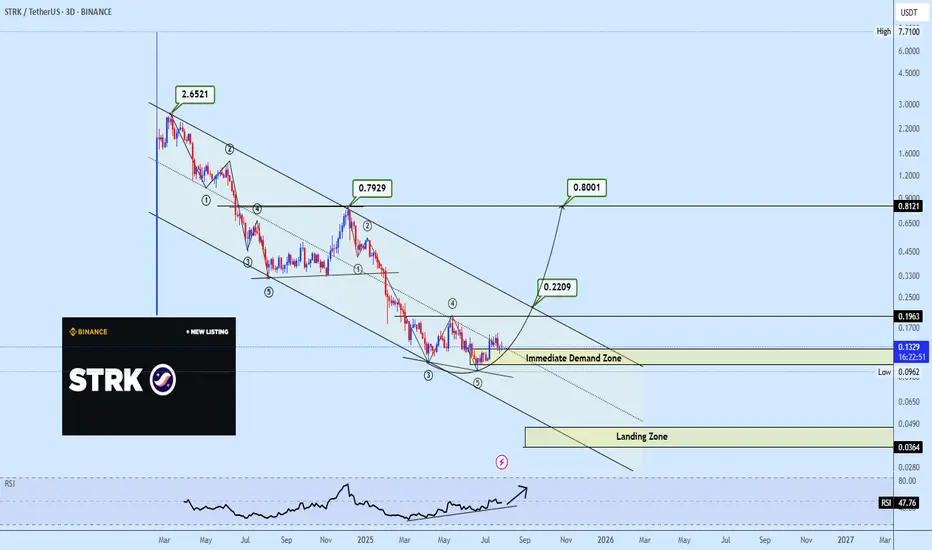
Starknet (STRK) 800% move to print? April 5th, 2025** for the months ahead **
On the above 2 day chart price action has corrected 80% since late 2024. A number of reasons now exist to consider a long position. They include:
1. Price action and RSI resistance breakouts.
2. RSI trend reversal.
3. Regular bullish divergence.
4. There are two resistance levels to consider look out for, one at 400% and the next at 800%
Is it possible price action continues to correct? Sure.
Is it probable? No.
Ww

#STRK/USDT - SHORTI expect a decrease in the asset within a month.
(Not an investment recommendation).
"Pain Point = Reversal Point? STRK Setup at the Bottom"Price has dropped over –96% from its peak — a typical altcoin story: the project is forgotten, but technically still alive.
The line between a bottom and a total collapse is thin here, yet the structure remains intact for now.
🔻 Technical Outlook:
▪️ Price is moving within a descending channel
▪️ The recent inverted head and shoulders pattern failed to play out
▪️ A potential double bottom or dragon pattern may be forming
▪️ A repeating fractal structure is visible — another rounded, concave base developing
📌 What’s next:
Summer often brings slow, choppy action. Price could remain stuck near the lower channel zone for a while.
🚨 Key trigger going forward:
The next real momentum in alts — including STRK — is likely to come when #ETH enters its distribution zone and gains strategic interest at the institutional or even state level.

STRKUSDT 1D AnalysisSTRK ~ 1D Analysis
#STRK This is the lowest support for now. Buy if you still have faith in this coin with a short term target of at least 15%+ from here.

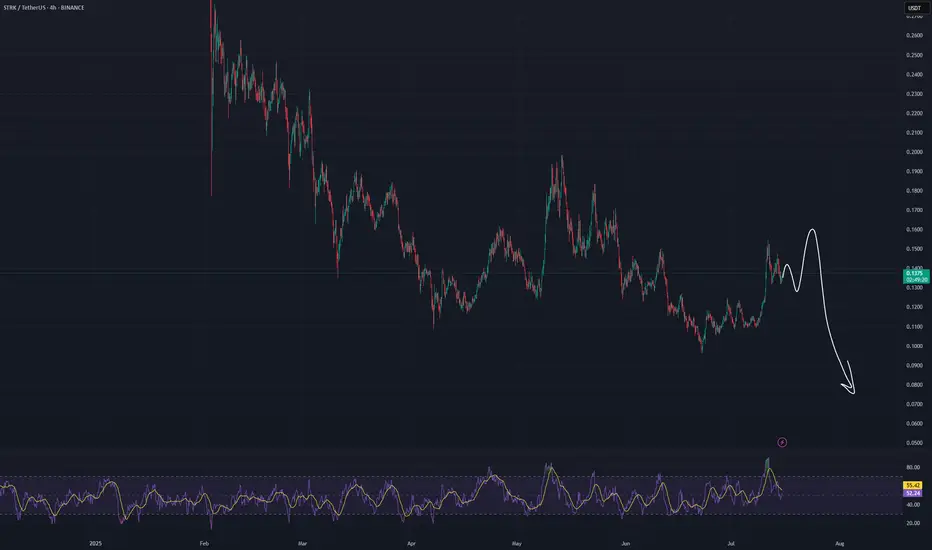
STRK/USDT Breaks Key Support !STRK/USDT has broken down from a clear Head and Shoulders pattern and is now trading below the critical support zone of $0.1234–$0.13, which has flipped into a key resistance area.
Unless price reclaims and closes firmly above this zone, long positions should be avoided. Traders may consider light short positions with tight risk management, ideally placing stop losses just above the upper boundary of the former support range.

STRKUSDTGiven the price structure and current conditions, the current price data is valuable and worth the risk.
I also kept liquidity for lower levels to reduce the average with each drop.
Please note that this is our team's personal opinion and is not a buy or sell offer.
Sincerely.
STRKUSDT 1D#STRK is moving inside a Descending Broadening Wedge pattern on the daily chart. It was recently rejected from the wedge resistance. If it manages to close a daily candle above the Ichimoku cloud and the daily MA50, we could see another leg up that breaks the wedge resistance to the upside.
In case of a breakout, the targets are:
🎯 $0.2064
🎯 $0.2477
🎯 $0.3276
🎯 $0.3921
⚠️ Use a tight stop-loss.

Is Starknet STRK Really Scam? Hello, Skyrexians!
I want to make an update on BINANCE:STRKUSDT because price dropped that much recently and now everyone is telling that this coin is total scam. To be honest I have some doubts that this crypto can bring significant gains in this cycle, but solid bounce can be seen.
Here we have 4 days time frame to estimate the Elliott waves cycle correctly. We can see all 5 waves, divergence with the Awesome Oscillator, but I have the huge concern - it was the downward global impulse. What does it mean? It means that the next wave will be corrective. 0.61 Fibonacci is the max target at $1.7. This is more than 10x. I cannot believe that this coin can set ATH because I totally disappointed in it. My last purchase wave at $0.13 and average price $0.41. Now this is the worst my investment in this cycle.
Best regards,
Ivan Skyrexio
___________________________________________________________
Please, boost this article and subscribe our page if you like analysis!

STRK Eyes $0.27 as $0.14 Support HoldsIf BYBIT:STRKUSDT.P can stay above $0.14 and gain strength, I expect the price action to initially move towards the $0.27 level and potentially higher, forming higher highs.

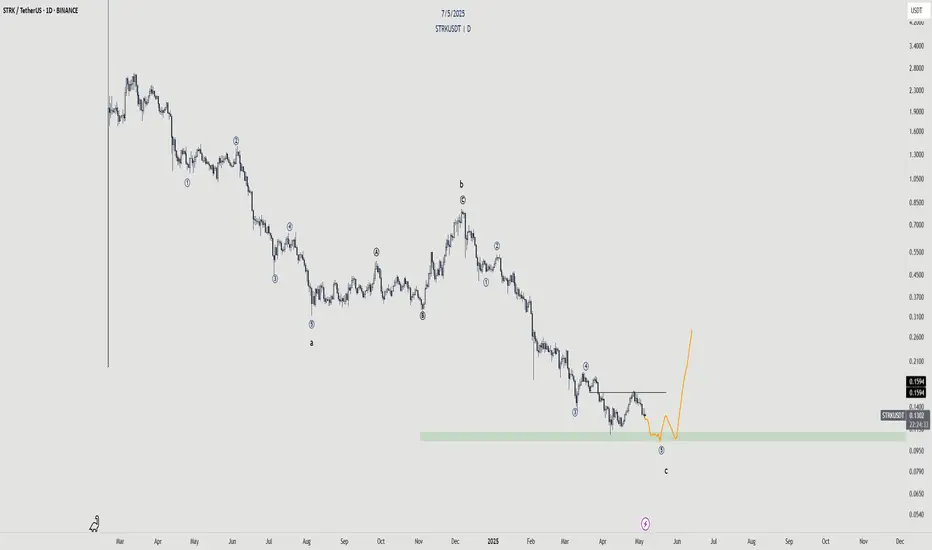
Starknet - Incoming Reversal?Starknet has been on a consistent downtrend. Its about time we finish this wave structure where we will see an impulse finish of Wave c.
Looking for the 5th wave to finish to sweep the low. However, the pullback seems very deep in that micro structure so its also likely we don't get that sweep. As long as we close below that wick from the green box and we can consider 5th wave to be done.
STRKUSDT 1DSTRK ~ 1D Analysis
#STRK High risk trading. Buy gradually after successfully penetrating this resistant line with a short -term target of at least 10%+.
