SUILocal Analysis / Targets / Elliot Wave
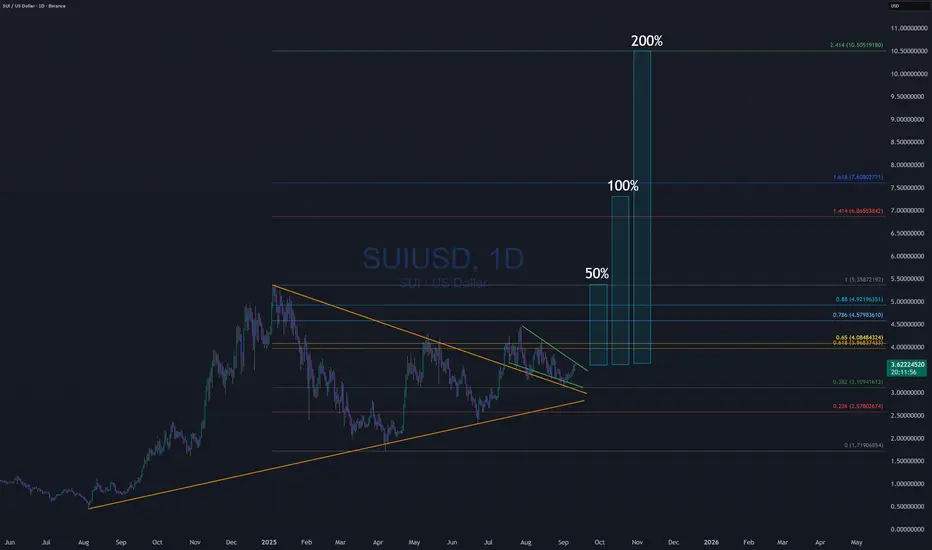
Sui attempted to breakout into all time high and was rejected as expected for a wave (1). Wave (2) is underway with an expected first target of the High Volume Node and S1 daily pivot at $2.9, also the 0.382 Fibonacci retracement. Price must get through the d

SUI WILL SHOCK EVERYONEToday (September 19, 2025): CRYPTOCAP:SUI is stable at $3.81 with potential to break out to $4.05–$4.30 if volume remains high. Strong support at $3.47 limits short-term downside.
Short-Term (September–October): Bullish with a target of $4–$6, but monitor resistance at $4.05 and BTC trends.
Lo

SUI long IdeaSUI LONG idea
Symmetrical triangle was broken, Market structure broken to bullish.
Breakout-retest and descending wedge will be broken up soon.
SUI/USD – Holding Gains Above Support🟢 LONG above $3.50 – target $3.56
Sui trades at $3.516, consolidating after a sharp run. SMA200 at $3.50 is nearby support. Resistance capped at $3.56. RSI steady at 45–50, suggesting neutral bias but holding trend. Bulls could push if $3.50 support holds.
📖 Keywords: #SUIUSD #Sui #CryptoBreakout

SUI 8H – Bearish EMA Cross, Liquidity Targets $2.83 and $2.30SUI is trading at $3.34 after a bearish EMA cross (200 EMA flipped above 50 EMA), confirming downside momentum. Price continues to respect the descending trendline, keeping pressure on support levels.
The first key liquidity pool sits at $2.8374. If this level is swept, sellers may drive price towa

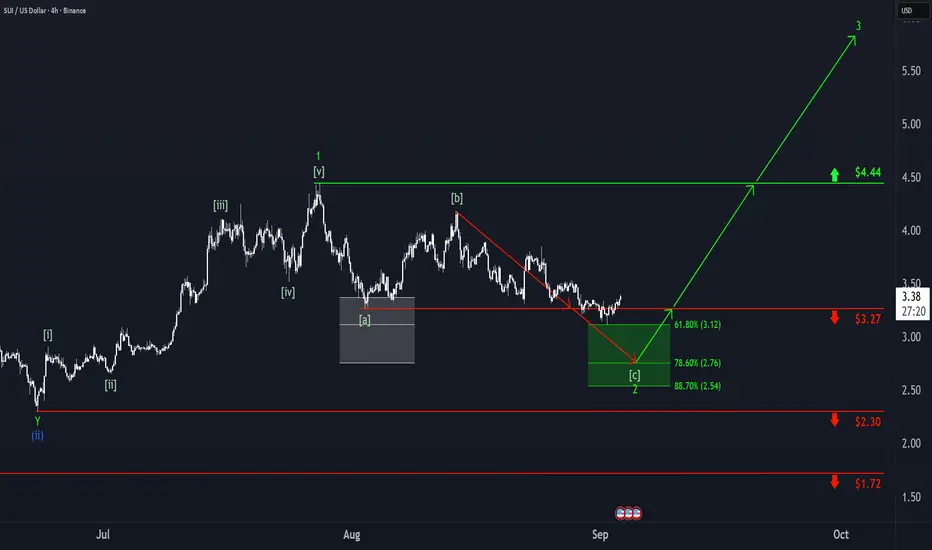
SUI: Dip and Go?On Monday, SUI dipped into our green Target Zone ($3.12 – $2.54) but quickly rebounded and climbed back above the $3.27 level. While it’s possible that wave 2 has already bottomed, we’re still allowing for potential new lows within this range. Once this interim correction wraps up, we expect an impu
SUI Wave (4) Still Underway?Its unclear weather CRYPTOCAP:SUI wave 4 is complete or still underway as a larger triangle of flat correction, in a ending diagonal wave 4 (defined by wave 4 falling to wave 1 at the 0.5 Fib).
Price terminated 3 waves up at the High Volume Node resistance and is now finding support at the weekl

SUI – Following the Plan📉 CRYPTO:SUIUSD correction from the July peak continues to unfold within a classic Zigzag structure, and price remains on track to reach the equal legs zone at $3.00–$2.72.
No deviation from the roadmap yet. Let price complete the pattern and confirm before positioning.

#sui usd#sui could go a bit lower, it could crash to $0 but it seems to have the strength not to fail this bull run… The goal is to hit at least 7 by end of year…. I would guess mid November we will see the top

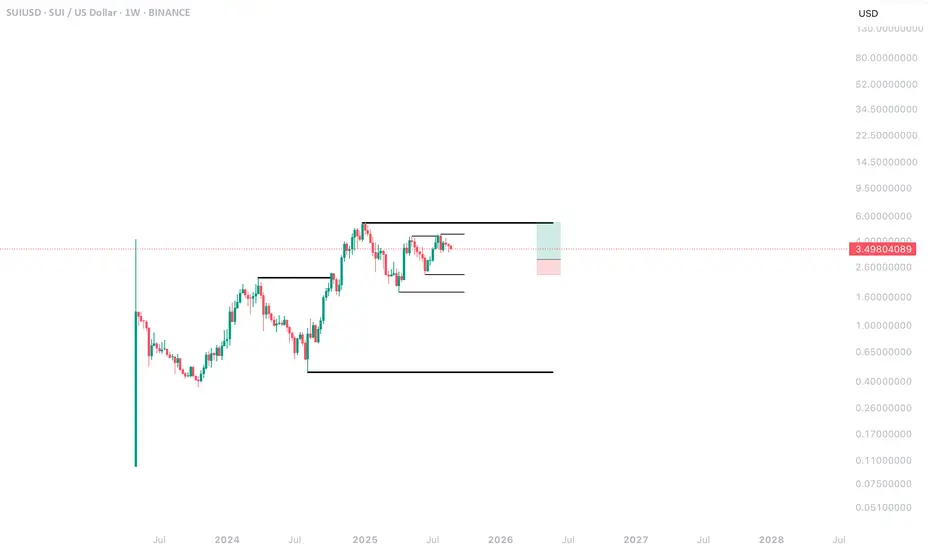
SUI Weekly AnalysisBeen following SUI for a while now and bullish formation still intact.
Being patient for the “right” trade.
What does the “right” trade look like?
I’m looking for price to enter or come close to the last higher low in the most recent fractal. You can see me tracing HH & HL within a higher timefram
See all ideas
Summarizing what the indicators are suggesting.
Oscillators
Neutral
SellBuy
Strong sellStrong buy
Strong sellSellNeutralBuyStrong buy
Oscillators
Neutral
SellBuy
Strong sellStrong buy
Strong sellSellNeutralBuyStrong buy
Summary
Neutral
SellBuy
Strong sellStrong buy
Strong sellSellNeutralBuyStrong buy
Summary
Neutral
SellBuy
Strong sellStrong buy
Strong sellSellNeutralBuyStrong buy
Summary
Neutral
SellBuy
Strong sellStrong buy
Strong sellSellNeutralBuyStrong buy
Moving Averages
Neutral
SellBuy
Strong sellStrong buy
Strong sellSellNeutralBuyStrong buy
Moving Averages
Neutral
SellBuy
Strong sellStrong buy
Strong sellSellNeutralBuyStrong buy