SUI/USDT – Bearish Breakdown Ahead?📉 SUI/USDT – Bearish Breakdown Ahead?
SUI has broken below a key rising wedge structure on the 4H chart — a classic bearish continuation pattern.
The price is showing strong downside momentum, and further declines look likely.
After a possible short-term correction, a continuation toward the lower target zones remains probable.
Key Targets:
🎯 1.4910
🎯 1.0778
🎯 0.6202
You may find more details in the chart!
Thank you and Good Luck!
❤️PS: Please support with a like or comment if you find this analysis useful for your trading day❤️
Trade ideas

SUI 2-day death crossA 2 day death cross prints on the above 2 day chart of SUI. That is when the 2-day 50 SMA crosses down the 2-day 200 SMA (red). Sounds bearish doesn’t it?
The truth, when looking left, was far different. Price action climbed an astonishing 900% on the 2 day death cross print.
Is history repeating?
Maybe. There’s two questions that first must be positively answered before a repeat of history:
1. The trend, is higher highs higher lows printing?
2. Support and resistance, which is it?
Both questions are negatively answered at this moment. A long position is irrational until that changes.
Moving averages do not predict the future
Too easily traders see moving averages as a forecast of things to come. It feels dumb for saying this: " A moving average is the average value for a set of values over a given period of time ". You’d be surprised how many people do not realise that. Moving averages are telling you something of the past and nothing about the future. Only questions 1 and 2 can do that.
What can be expected?
It is clear an upward move in price action can be expected on the death cross print. At least until market structure. This would be a 50% gain from price action today. After that, questions 1 and 2 must become positive, just as before in late 2024.
Conclusions
The so-called death cross, a term that sounds far more apocalyptic than it deserves, has once again provoked hysteria in the usual corners of the market. Every time two moving averages intersect, a small army of self-anointed prophets appear, clutching at trend lines as though they were holy scripture. But, as ever, the data mocks the drama. The last time this same formation appeared, SUI didn’t die, it rose ninefold. That’s not a harbinger of doom; it’s a reminder that the market, unlike superstition, doesn’t care for human expectations.
Until higher highs and higher lows reassert themselves, until resistance becomes support, the idea of a renewed uptrend remains aspirational rather than empirical. To treat a moving average as predictive is to confuse the rearview mirror for the road ahead. It tells us what has been, not what will be. Yet traders persist in treating it as gospel, and then curse the market for their misplaced faith when the price does not comply.
A short term rally is likely to occur, as it often does when hysteria meets technical imbalance. But without confirmation of structure, such rallies are little more than reprieves, merciful pauses in an otherwise indifferent process of price discovery.
Ww
Disclaimer
=======================================================
This isn’t financial advice. If you’re making trades because a bloke on the internet wrote “death cross” in bold letters, you deserve every emotional rollercoaster that follows. I don’t care if you’re bullish, bearish, or just bored, or if you lose money, that’s not a “market manipulation conspiracy,” that’s just you being wrong.
Do your own research, manage your own risk, and please, for everyone’s sake, stop treating moving averages like they’re tarot cards.

SUI Approaching Major Support – Long Spot OpportunitySUI has entered a key support zone between $1.82 – $1.96, a level that has historically shown strong demand. Price is consolidating near the upper end of this zone, which could indicate potential accumulation. If this level holds, it presents a solid opportunity for a long spot entry.
🔹 Entry Zone: $1.82 – $1.96
🔹 Stop Loss: Below $1.75
🔹 Take Profit Targets:
• TP1: $2.40 – $2.80
• TP2: $3.10 – $3.55
This setup offers a favorable risk-to-reward ratio, especially if volume and market momentum align with the bounce. Watch for bullish confirmation signals—such as strong candle closes or rising volume—within the support zone before entering. Always respect the stop loss to protect capital.

SUIUSDT 3D#SUI has formed a descending triangle pattern on the 3-day timeframe chart and is currently trading near the triangle support zone. In case of a bounce, the potential targets are:
🎯 $2.5133
🎯 $3.0057
If a breakout occurs above the triangle resistance, the next targets are:
🎯 $3.4037
🎯 $3.8017
🎯 $4.3683
🎯 $5.0900
⚠️ Always remember to use a tight stop-loss and maintain proper risk management.

SUI USDT LONG SIGNAL---
📢 Signal Alert
🔹 Pair: SUI / USDT
📈 Trade Type: Long
💰 Entry Zone: 2.0737 – 2.0310
🎯 Take-Profit Targets (Partial Management):
▫️ TP1 = 2.1080
▫️ TP2 = 2.1790
▫️ TP3 = 2.2180
▫️ TP4 = 2.3188
🛑 Stop-Loss: 1.9970
📊 Timeframe: 15m
⚖️ Risk/Reward Ratio: 3.24
📌 Suggested Leverage: 5x – 10x
⚠️ Capital management is mandatory.
💬 Please review the chart before entering the trade.
---
🧠 Technical Overview:
SUI is forming a bullish structure above the 2.00 key support, showing strength with higher lows and growing volume.
A breakout above 2.10 can confirm momentum toward the 2.17–2.21 zone.
RSI on the 15m chart is rising from mid-levels, and price is holding above EMA20 — both indicating bullish continuation potential.
---
⚙️ Trade Management Tips:
Take partial profit at TP1 and move SL to entry.
Trail stop-loss for TP2–TP4.
Avoid holding if candle closes below 1.9970.
---
⚠️ Disclaimer:
This signal is for educational purposes only and not financial advice.
Always perform your own analysis and apply strict risk management.
---

SUIUSDTPrice reacted from the 1.8200 dollar support and entered a short-term correction but remains within the main descending channel. The bearish momentum is still dominant, and unless a candle closes above 2.2900 dollar, the price may retest lower zones near 1.5400 dollar. Fibonacci levels define the key horizontal supports and resistances in this setup.
BINANCE:SUIUSDT

SUI USDT LONG SIGNAL---
📢 Signal Alert
🔹 Pair: SUI / USDT
📈 Trade Type: Long
💰 Entry Zone: 2.0737 – 2.0310
🎯 Take-Profit Targets (Partial Management):
▫️ TP1 = 2.1080
▫️ TP2 = 2.1790
▫️ TP3 = 2.2180
▫️ TP4 = 2.3188
🛑 Stop-Loss: 1.9970
📊 Timeframe: 15m
⚖️ Risk/Reward Ratio: 3.24
📌 Suggested Leverage: 5x – 10x
⚠️ Capital management is mandatory.
💬 Please review the chart before entering the trade.
---
🧠 Technical Overview:
SUI is forming a bullish structure above the 2.00 key support, showing strength with higher lows and growing volume.
A breakout above 2.10 can confirm momentum toward the 2.17–2.21 zone.
RSI on the 15m chart is rising from mid-levels, and price is holding above EMA20 — both indicating bullish continuation potential.
---
⚙️ Trade Management Tips:
Take partial profit at TP1 and move SL to entry.
Trail stop-loss for TP2–TP4.
Avoid holding if candle closes below 1.9970.
---
⚠️ Disclaimer:
This signal is for educational purposes only and not financial advice.
Always perform your own analysis and apply strict risk management.
---

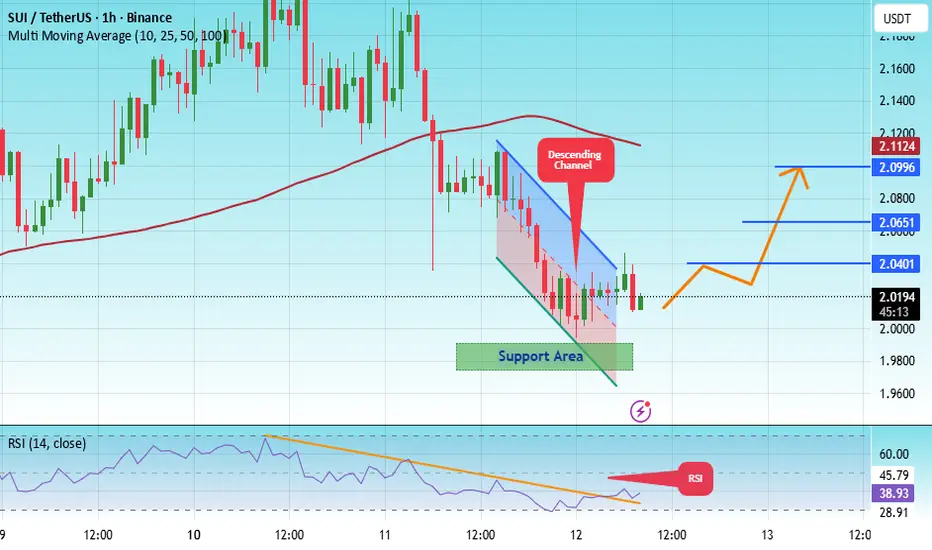
#SUI/USDT The Interesting part of the market#SUI
The price is moving in a descending channel on the 1-hour timeframe and is expected to break out and continue upwards.
We have a trend to stabilize above the 100-period moving average again.
We have a downtrend on the RSI indicator, which supports an upward move if it breaks above it.
We have a key support zone in green that pushed the price up to 1.93.
Entry price: 1.96
First target: 1.97
Second target: 2.02
Third target: 2.04
For risk management, don't forget your stop-loss and capital management.
The stop-loss is below the support zone in green.
Upon reaching the first target, take some profit and then change your stop-loss order to an entry order.
For any questions, please comment.
Thank you.

SUI TA (Y25.P4.Video1). Complete technical approachHi Traders,
Besides being an educational piece on how I approach the charts, we will dive into what is likely to play out from an Elliott Wave perpective and using support and resistance methods to find confluence with our fibonacci approach for levels to short and long.
I promise you newbies or intermediates, master this and you will have much more success in your trading. Experience obviously takes time.
All the best,
S.SAri

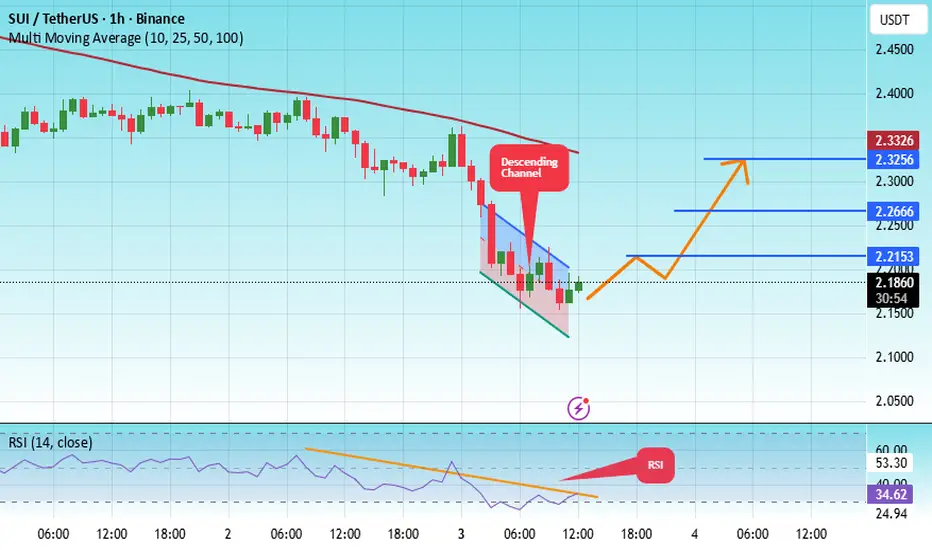
#SUI/USDT The Interesting part of the market#SUI
The price is moving within an ascending channel on the 1-hour timeframe and is adhering to it well. It is poised to break out strongly and retest the channel.
We have a downtrend line on the RSI indicator that is about to break and retest, which supports the upward move.
There is a key support zone in green at the price of 2.14, representing a strong support point.
We have a trend of consolidation above the 100-period moving average.
Entry price: 2.18
First target: 2.215
Second target: 2.26
Third target: 2.32
Don't forget a simple money management rule:
Place your stop-loss order below the support zone in green.
Once the first target is reached, save some money and then change your stop-loss order to an entry order.
For any questions, please leave a comment.
Thank you.
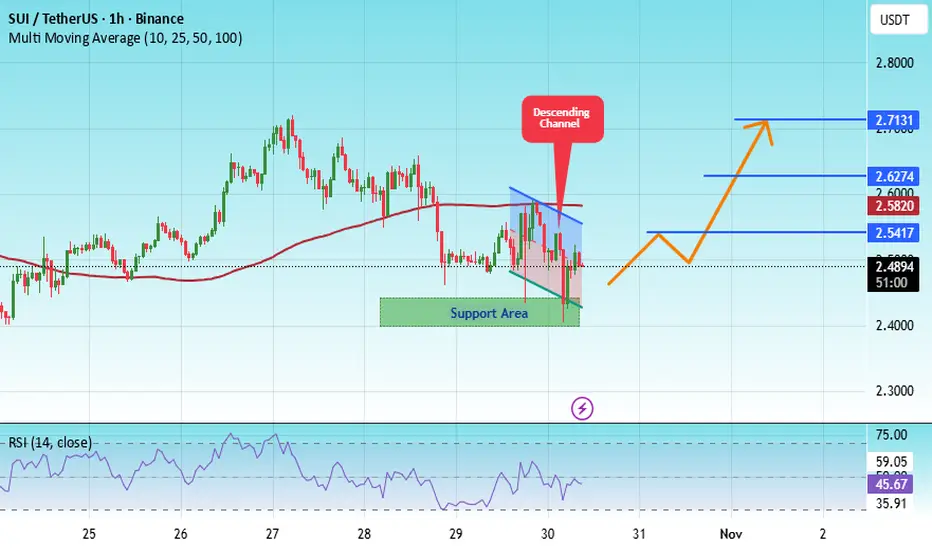
#SUI/USDT The Interesting part of the market#SUI
The price is moving within an ascending channel on the 1-hour timeframe and is adhering to it well. It is poised to break out strongly and retest the channel.
We have a downtrend line on the RSI indicator that is about to break and retest, which supports the upward move.
There is a key support zone in green at the price of 2.42, representing a strong support point.
We have a trend to stabilize above the 100-period moving average.
Entry price: 2.49
First target: 2.61
Second target: 2.62
Third target: 2.71
Don't forget a simple point: money management.
Upon reaching the first target, save some money and then change your stop-loss order to an entry order.
For any questions, please leave a comment.
Thank you.
SUI (Y23.P2.E1). Wave 3 to 4 in progressHi traders,
I do see a good opportunity to find a shorting position in the coming days or week\s.
This is a grind line for wave 4 and as soon a it breaks this prevailing support TL, its time to short.
The BAR strategy.
All the best,
S.SAri

SuiSui (SUI/USDT) has retraced back to a major support area that previously acted as a strong accumulation zone. The price is currently testing the lower boundary of the ascending channel, which has provided solid support throughout this cycle.
As long as the structure remains intact, this level could serve as a potential reversal zone. If momentum returns to the market — especially with Bitcoin and Ethereum continuing their bullish leg — SUI may resume its uptrend within the channel, aiming for resistance levels around $4.5–$5.5 in the mid-term.
Given its position and technical setup, this could be an interesting region for long-term investors to start accumulating.

SUIPrice of Sui has formed a bullish triangle. In a classic scenario the target would be at $7. But if there's altseason like it is on Zcash right now then the target can be 6 triangles length which is around $25.

SUI USDT LONG SIGNAL ---
📢 Signal Alert
🔹 Pair: SUI / USDT
📈 Trade Type: Long
💰 Entry Zone: 2.1850 – 2.1450
🎯 Take-Profit Targets:
TP1 = 2.2230
TP2 = 2.2825
TP3 = 2.3370
🛑 Stop-Loss: 2.1190
📊 Timeframe: 1H
⚖️ Risk/Reward Ratio: 2.37
📌 Suggested Leverage: 5x–10x
🔄 After TP1 is reached, move Stop-Loss to Entry to secure profits.
---
🧠 Technical Analysis Explanation
SUI is showing bullish continuation signs after a clean retest of the 2.12–2.14 support zone, which previously acted as a strong demand area.
The market structure remains bullish, forming higher lows and maintaining price action above the EMA 50 on the 1H timeframe.
The RSI has bounced from the 50-level midpoint, confirming renewed buyer strength, while volume analysis indicates accumulation by smart money near the current levels.
The entry zone (2.1850–2.1450) offers an ideal area to position for continuation toward the next resistance levels.
Targets are set at short-term resistance zones derived from Fibonacci extensions and previous reaction highs.
The stop-loss at 2.1190 is strategically placed below the key support to minimize downside risk while maintaining a solid R/R ratio.
---
⚙️ Trade Management Tip:
Wait for a bullish confirmation candle (e.g., 1H engulfing or strong bounce from support) before executing the entry.
Take partial profits at each target and move SL to entry after TP1 for maximum risk control.

SUI DAILY TIMEFRAME UPDATE (ON DEMAND) ❤️ THIS POST AND I WILL SHARE NEXT 10X GEM COIN
Sui is a groundbreaking layer-1 blockchain platform designed to support the needs of global adoption by offering a secure, and scalable development platform
ANY THOUGHTS ON CRYPTOCAP:SUI ?

#SUI/USDT – Bullish Triangle Breakout Confirmed | Resistance Li#SUI
The price is moving within an ascending channel on the 1-hour timeframe and is adhering to it well. It is poised to break out strongly and retest the channel.
We have a downtrend line on the RSI indicator that is about to break and retest, which supports the upward move.
There is a key support zone in green at the price of 1.98, representing a strong support point.
We have a trend to stabilize above the 100-period moving average.
Entry price: 2.02
First target: 2.04
Second target: 2.06
Third target: 2.02
Don't forget a simple money management tip:
Place your stop-loss order below the support zone in green.
Once you reach the first target, save some money and then change your stop-loss order to an entry order.
For any questions, please leave a comment.
Thank you.
SUI USDT LONG SIGNAL---
📢 Signal Alert
🔹 Pair: SUI / USDT
📈 Trade Type: Long
💰 Entry Point: 2.1340
🎯 Take-Profit Targets (with partial exits):
TP1 = 2.1870
TP2 = 2.2259
TP3 = 2.2730
TP4 = 2.3170
🛑 Stop-Loss: 2.0900
📊 Timeframe: 15 Minutes
⚖️ Risk/Reward Ratio: 4.84
📌 Suggested Leverage: 5x – 10x
⚠️ Capital management is mandatory.
💬 Please review the chart carefully before entering the trade.
---
🧠 Technical Analysis Overview:
SUI is currently forming a bullish structure after a short consolidation phase. The price has bounced from the local support zone (around 2.09–2.13), showing renewed buy pressure and volume confirmation.
🔸 Key Notes:
Momentum indicators are turning upward, signaling early strength.
A breakout above 2.18 could confirm bullish continuation toward TP3–TP4.
Maintain tight stop management; move SL to entry after TP1 hit.
---
⚙️ Trade Management Tip:
Once TP1 is reached, secure partial profits and move Stop-Loss to breakeven.
Let remaining positions run toward higher targets.
---
⚠️ Disclaimer:
This signal is for educational and analysis purposes only.
Always perform your own research and apply strict risk management.
---

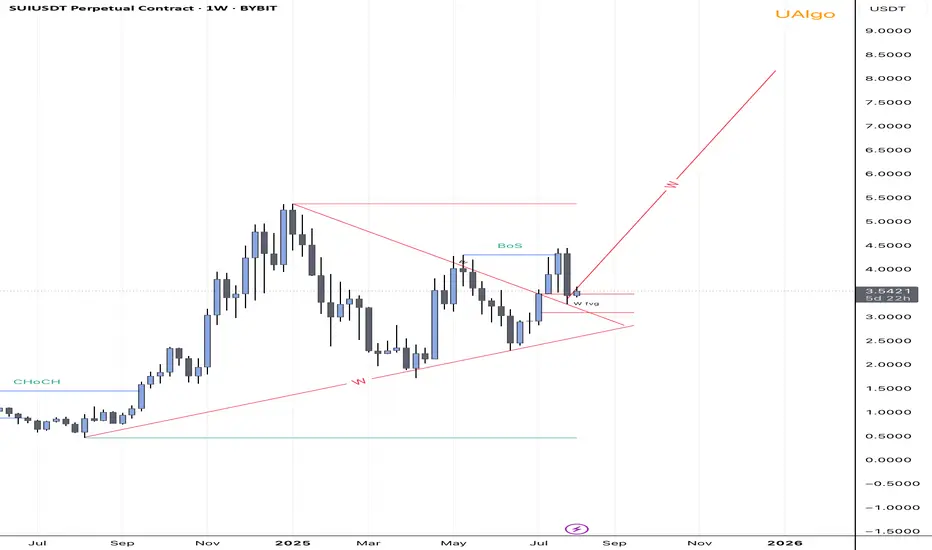
SUI Bullish Breakout Confirmed- $8 Target In sight! Hey everyone,
Today marks an important moment for SUI. We’ve just witnessed a clean breakout from a long-term symmetrical triangle on the weekly timeframe, supported by a confirmed Break of Structure (BoS) and a weekly Fair Value Gap (FVG) acting as strong support.
Price respected the FVG zone and bounced, showing clear bullish intent. With strong structure forming and momentum building, I’m targeting the $8 region as the next major level of interest. Market structure is bullish, and the confluence of trendline support, FVG, and the breakout gives me confidence in this move.
Key Highlights:
• Weekly CHoCH followed by BoS 🚀
• Price broke out of triangle and retested FVG🚀
• Bullish continuation structure (W formation)🚀
• Targeting $5.5 → $8 range if momentum holds🚀
The Interesting part of the marketHello traders, so guys I applied my strategy to this baby and it did work out.. Observe that sui came down hugely before I think it's getting back at it's fit...
The current leap BYBIT:SUIUSDT broke the structure it had and now it's a run, keep a good eye on BYBIT:SUIUSDT
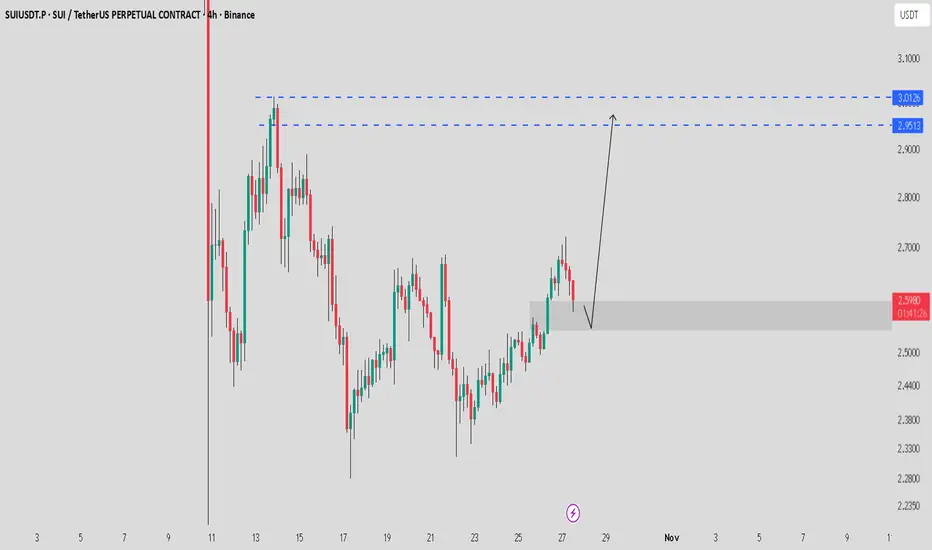
SUI / USDT Testing FVG zone_Watching for reversal towards $3SUI is showing strong momentum and currently testing the FVG zone on the 4H timeframe.
If price bounces from this support, we could see a move towards $2.95 – $3.01.
Note: Wait for a proper confirmation of reversal — a breakdown below this zone will invalidate the setup.
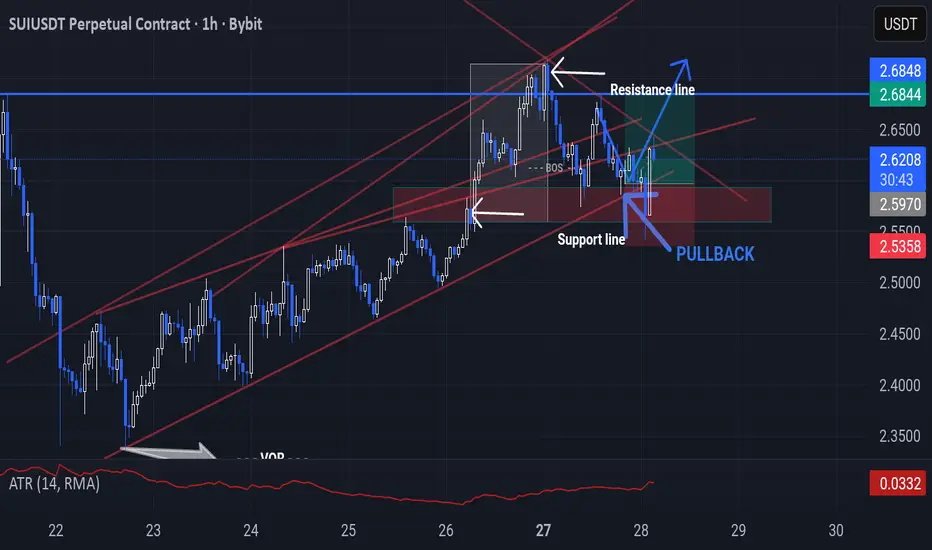
#SUI/USDT - Head and Shoulders Long#SUI
The price is moving within a descending channel on the 1-hour frame, adhering well to it, and is heading for a strong breakout and retest.
We have a bearish trend on the RSI indicator that is about to be broken and retested, which supports the upward breakout.
There is a major support area in green at 2.38, representing a strong support point.
We are heading for consolidation above the 100 moving average.
Entry price: 2.40
First target: 2.48
Second target: 2.54
Third target: 2.63
Don't forget a simple matter: capital management.
When you reach the first target, save some money and then change your stop-loss order to an entry order.
For inquiries, please leave a comment.
Thank you.
