Sui (SUI): Either We See Huge Drop or Huge Pump | 200EMA is KeySui is back near the 200EMA, where last time we had a strong rejection and movement to lower zones, which would have been an amazing entry for short.
So this time we will not miss the big move; we are looking either for a proper MSB to form to enter a short position here or a proper break of local high (BOS), which would give us a good opportunity for a long.
Swallow Academy
Trade ideas

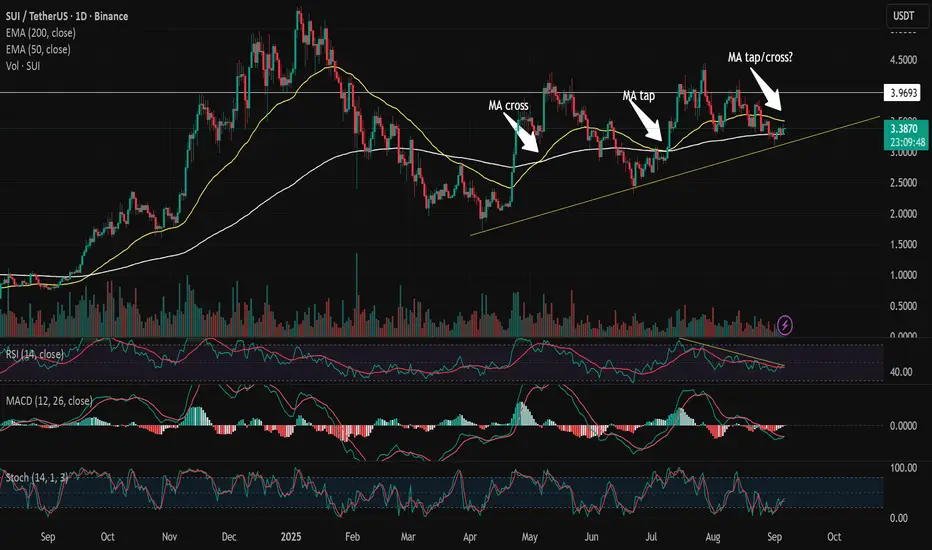
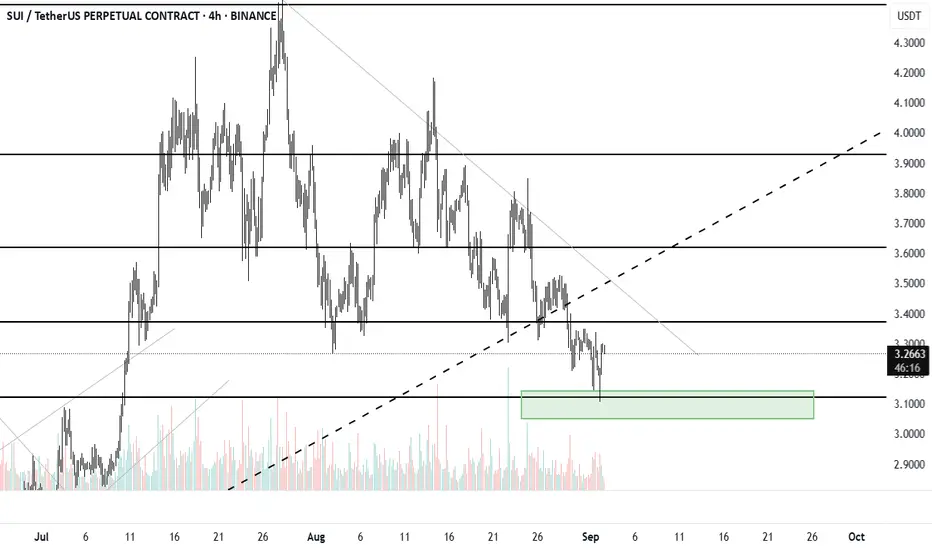
SUI Technical Setup – Bullish Structure, Bearish Momentum🟢 Trend & Structure
Since April, SUI has been respecting a clear upward support trendline, tapped 3 times and holding firmly. This validates the bullish structure and sets the stage for a potential ascending triangle pattern, with higher lows pressing against the $3.9 resistance zone.
Ascending triangles are typically continuation patterns, but they require volume expansion to confirm. Without that, they can just as easily break down.
📉 Moving Averages (MAs)
In May, we saw a golden cross (50 EMA crossing above 200 EMA) which shifted the broader bias to bullish.
In July, price retested the 200 EMA successfully, respecting long-term support.
Today, SUI trades above the 200 EMA (~$3.28) but remains below the 50 EMA (~$3.49).
This creates a squeeze zone between the two averages. A decisive move out of this range will set the next direction.
📊 Indicators
RSI (14): Currently around 44, sitting below 50. This shows bearish momentum bias, though not in oversold territory.
MACD: Both lines are below zero, histogram is red but fading. This hints at a potential bullish crossover, but not confirmed yet.
Stochastic: Rising from oversold levels but still in the bearish half of the range. Needs to break above 50 to show strength.
Overall, indicators lean bearish-to-neutral, with some early signs of possible reversal.
🔉 Volume Profile
Volume has been declining steadily since July, showing weakening demand. For any breakout above $3.9 to hold, we would need to see a clear surge in buying volume.
🎯 Key Levels to Watch
Support:
$3.28 (200 EMA).
If broken, downside targets $2.76 (Fib 0.618 golden ratio) as the next logical support.
Resistance:
$3.70 (Fib 0.236).
$3.90–$4.00 horizontal zone. A clean breakout above this on strong volume would confirm the ascending triangle pattern and likely extend the uptrend.
⚠️ Fundamental Catalyst – Token Unlock
On October 1st, 2025, 44M SUI tokens will be unlocked. Unlocks increase circulating supply and often add short-term selling pressure. Combined with SUI trading near key support/resistance levels, this event could act as the catalyst for a decisive move — either breaking down support or fueling a breakout if demand absorbs supply.
📈 Outlook & Scenarios
At this stage, SUI’s chart shows mixed signals:
Bullish case: If price continues to hold above the 200 EMA and demand returns, an attempt toward $3.7–$3.9 resistance is likely. A breakout above $3.9 would confirm continuation of the uptrend.
Bearish case: If $3.28 fails, a retrace toward the $2.76 Fib support becomes the higher-probability path.
Bottom Line:
SUI is at a decision point. Structure is bullish, but indicators lean bearish, and volume is weak. The October 1st unlock may be the trigger that decides whether this ascending triangle plays out to the upside or breaks down toward deeper support.
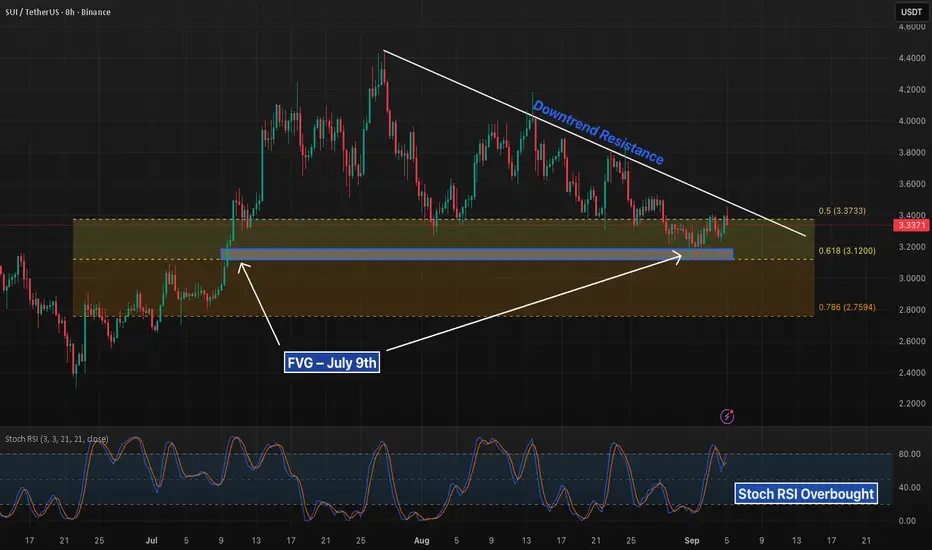
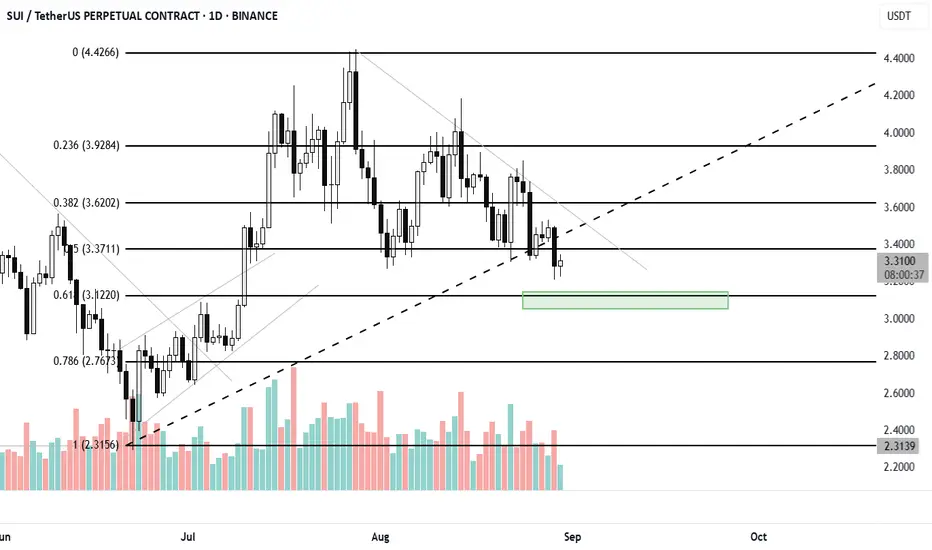
SUI 8H – Testing Downtrend Resistance, FVG from July in PlaySUI is retesting the descending trendline while sitting just under the 0.5 retracement at 3.37. The July 9th FVG sits mid-structure and has been partially filled on this recent bounce.
The golden pocket (3.37–3.12) remains the key zone. A breakout above trendline resistance would confirm strength, opening continuation toward higher levels. Failure to hold above 3.12 shifts focus to 2.76 at the 0.786 retracement.
Stoch RSI is stretched into overbought territory, suggesting caution as price presses into resistance.
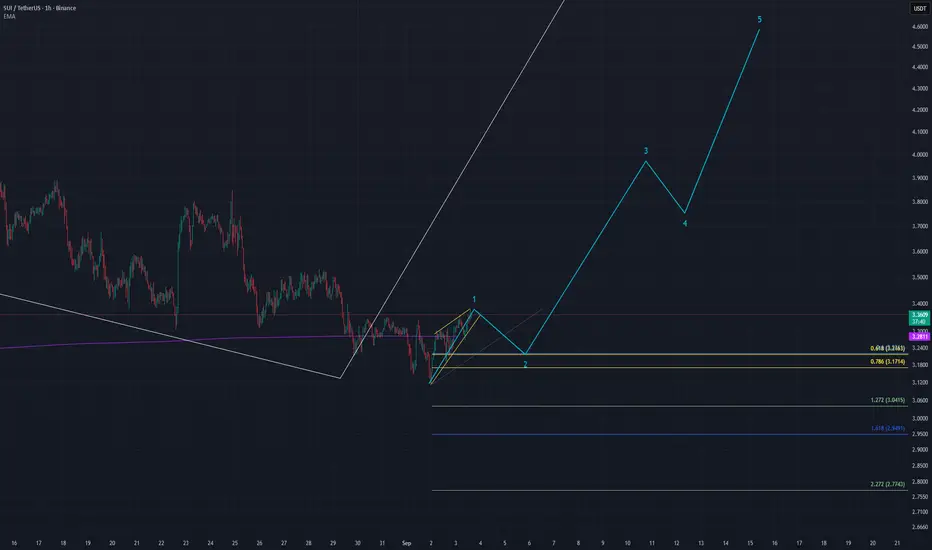
SUI bottom formedSui occuration making leading diagonal. If bottom is formed we can hunt pull back at 0.5 of 0.6 fibonacci level. Also Sui close candlestick above 200 Daily ema.
If Sui retest and find support on this level we can see bigger move elliot wave 3.
Targets 4.1 and above ATH. I think its good way to DCA and wait for confirmation.
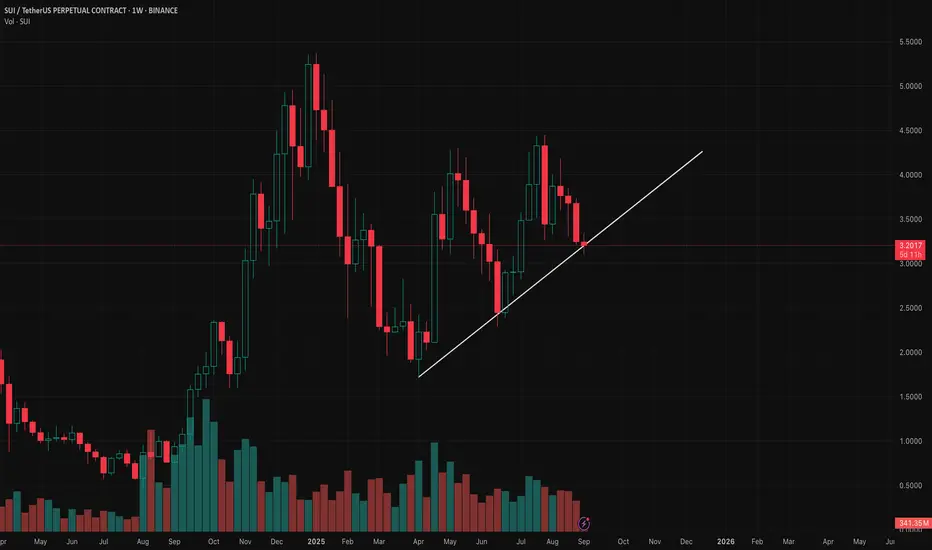
W ON WEEKLYW on WEEKLY we break to upside because of consolidation pressure it's very typical after back tests of W patterns.

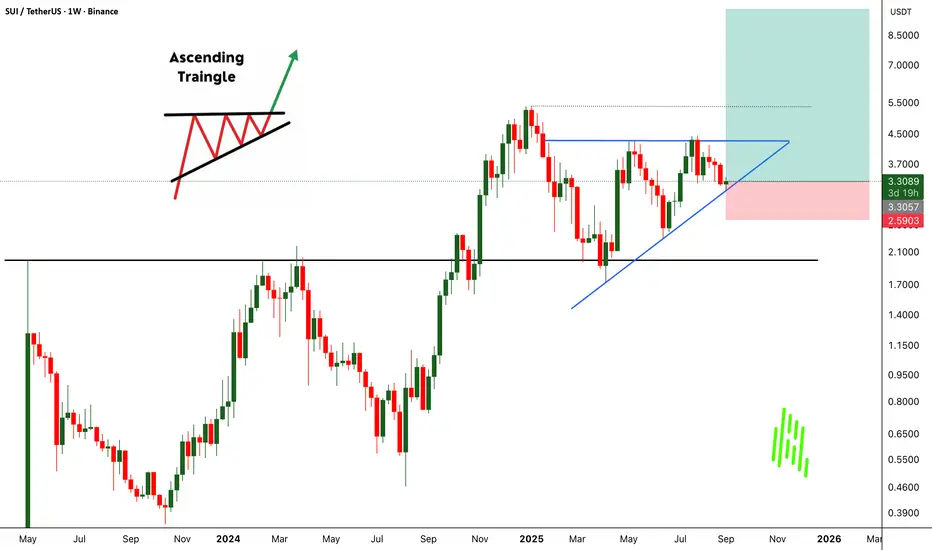
SUIUSDT Weekly Outlook!! Target $10CRYPTOCAP:SUI has once again bounced strongly from its key support zone, making it the third touch at this level. Each time price defends this area, it reinforces the strength of buyers stepping in, showing that demand remains intact.
On the weekly chart, BINANCE:SUIUSDT is now shaping a clean Ascending Triangle pattern. This is typically a bullish continuation setup, and the structure is becoming clearer with every retest. The longer price consolidates under the resistance, the stronger the breakout move is likely to be once bulls finally push through.
All eyes remain on the $4.4 breakout level. A successful close above this resistance could open the door for a powerful move to the upside. My target remains unchanged at $10, supported by the bullish technical formation and repeated validation of support.
BINANCE:SUIUSDT Currently trading at $3.3
Buy level : Above $3.3
Stop loss : Below $2.62
Target 1: $4
Target 2: $5
Target 3: $7
Target 4: $10
Max leverage 2x
Always keep stop loss
Follow Our Tradingview Account for More Technical Analysis Updates, | Like, Share and Comment Your thoughts
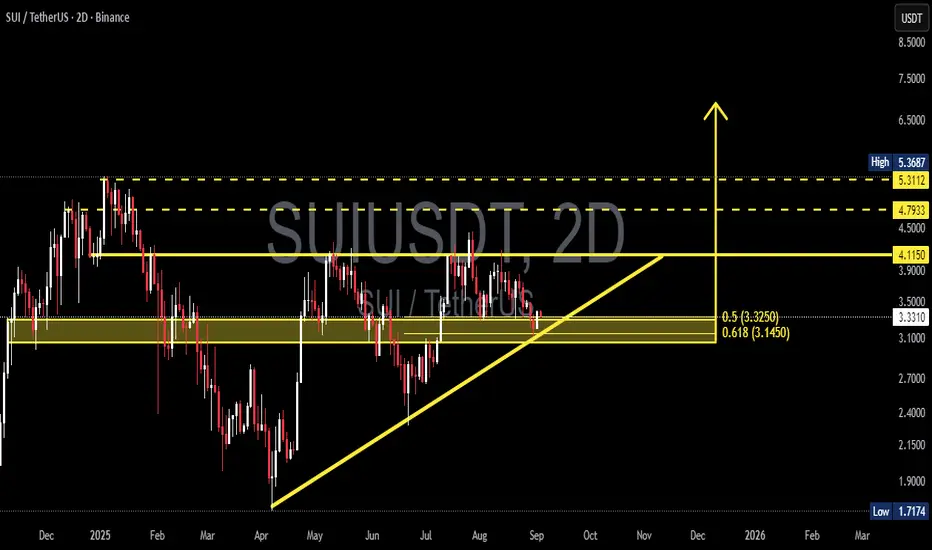
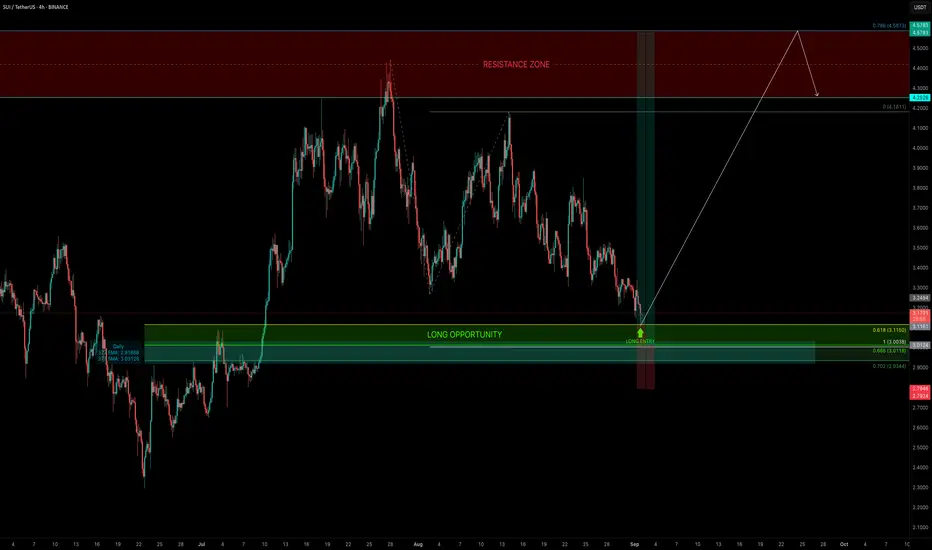
SUIUSDT — Test Golden Pocket: Breakout or Breakdown Ahead?🔎 Overview:
SUI/USDT is currently sitting at a critical decision point. Since April 2025, price action has been forming higher-lows supported by an ascending trendline (yellow). On the upside, we see a flat resistance around 4.115, creating an Ascending Triangle pattern — a classic bullish continuation structure that often precedes a breakout.
However, price is now testing the key demand zone at 3.33–3.15, which perfectly aligns with the Fibonacci golden pocket (0.5 & 0.618 retracement). This zone will likely determine the next major move: either a strong rebound to the upside or a deeper breakdown.
---
📈 Bullish Scenario (Breakout Potential):
Trigger: Price holds above 3.33–3.15 and breaks 4.115 with a strong 2D candle close.
Pattern Implication: A breakout from the ascending triangle usually results in a move equal to the pattern’s height (~0.9–1.1 points), projecting targets around 5.0–5.3.
Targets:
TP1 = 4.79 (intermediate liquidity)
TP2 = 5.31–5.37 (major resistance & previous high)
Extra Signal: A breakout with rising volume would strengthen the bullish outlook significantly.
---
📉 Bearish Scenario (Breakdown Risk):
Trigger: A decisive close below 3.10, which would break both the ascending trendline and the golden pocket.
Consequence: This breakdown could open the door to a deeper retracement.
Targets:
2.70 (minor support)
2.40 (major support)
2.15 (previous demand zone)
Extreme case: 1.72 (historical low)
Invalidation: A recovery above 3.35 followed by a breakout over 4.115 would nullify the bearish setup.
---
📌 Conclusion:
SUI is at a make-or-break level. The 3.33–3.15 zone is the battlefield between bulls and bears, marking the golden pocket of this structure. Holding this level keeps the door open for a bullish breakout towards 5.0–5.3, while losing it could trigger a significant drop toward the 2.70–2.15 range.
📊 Strategy: Wait for a confirmed 2D close before positioning. Manage risk tightly and watch how price reacts at this golden pocket zone — it will set the tone for the next major trend.
---
#SUI #SUIUSDT #CryptoAnalysis #AscendingTriangle #PriceAction #SupplyDemand #GoldenPocket #Fibonacci #CryptoBreakout #SupportResistance #SwingTrading
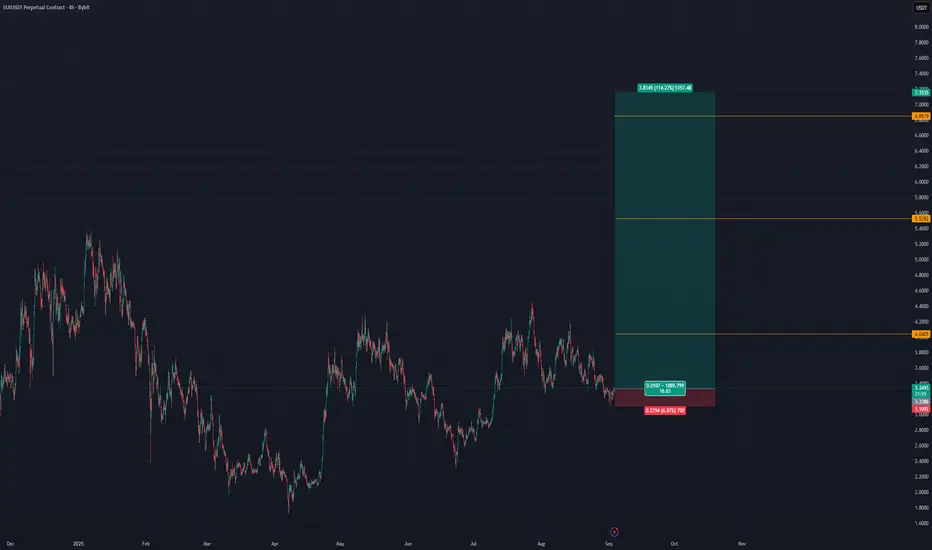
SUI Trading IdeeTrade Setup (Long Scenario)
Pair: SUI/USDT (Perpetual Contract)
Timeframe: 4H
Entry
Long entry around 3.34 USDT (after confirmation from the green demand zone).
Stop-Loss
Below box bottom: 2.9507 USDT
Risk: ≈ 6.87%
Targets
TP1: 4.0457 USDT
TP2: 5.5227 USDT
TP3: 6.8536 USDT
Risk/Reward
Potential upside: up to +114%
R:R ratio: very favorable (approx. 15:1 at TP3).
Notes
The red box shows previous supply/short zone (already tested).
The green box indicates current demand/accumulation zone (long setup).
Trend shift expected after retest and breakout from local resistance.
Best approach: scale out at each TP (partial profits at TP1, TP2, and final runner at TP3).
#SUI/USDT → Resistance breakout and entry into the buying zone#SUI
The price is moving within an ascending channel on the 1-hour frame, adhering well to it, and is on its way to breaking strongly upwards and retesting it.
We have support from the lower boundary of the ascending channel, at 3.40.
We have a downtrend on the RSI indicator that is about to break and retest, supporting the upside.
There is a major support area in green at 3.50, which represents a strong basis for the upside.
Don't forget a simple thing: ease and capital.
When you reach the first target, save some money and then change your stop-loss order to an entry order.
For inquiries, please leave a comment.
We have a trend to hold above the 100 Moving Average.
Entry price: 3.51
First target: 3.60
Second target: 3.72
Third target: 3.90
Don't forget a simple thing: ease and capital.
When you reach the first target, save some money and then change your stop-loss order to an entry order.
For inquiries, please leave a comment.
Thank you.

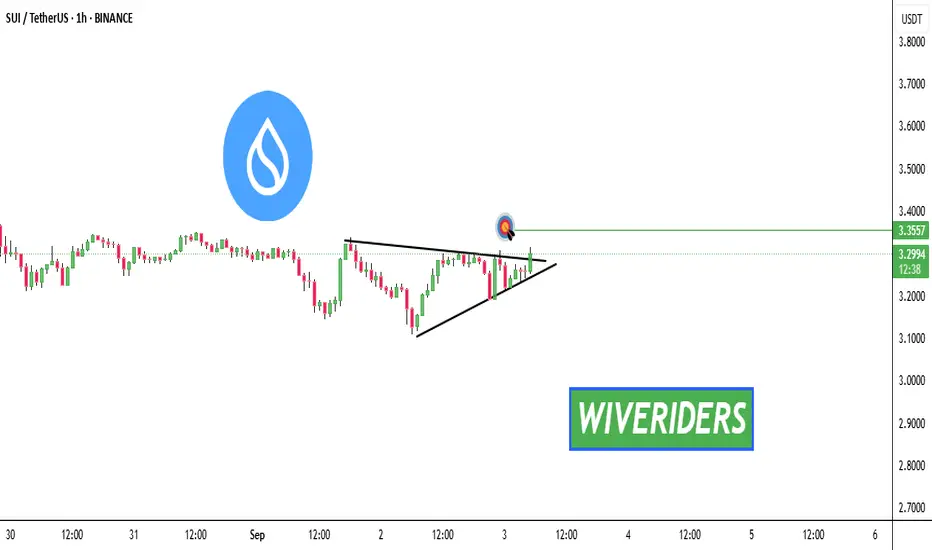
SUI Breakout Alert!🚨 CRYPTOCAP:SUI Breakout Alert! 🚨
CRYPTOCAP:SUI has developed a bullish ascending setup 📈
👉 Price action is pressing against resistance, showing breakout potential.
⚠️ Key point: Stay cautious of fakeouts — confirmation is needed before entry.
👉 If the breakout holds, the first target aligns with the green level 🎯
This move would indicate strong bullish continuation with buyers taking control ✅
SUI/USDT - Ready to Ride the Wave!🚀 Trade Setup Details:
🕯 #SUI/USDT 🔼 Buy | Long 🔼
⌛️ TimeFrame: 1D
--------------------
🛡 Risk Management (Example):
🛡 Based on $1000 Balance
🛡 Loss-Limit: 1% (Conservative)
🛡 The Signal Margin: $48.26
--------------------
☄️ En1: 3.1925 (Amount: $4.83)
☄️ En2: 2.9529 (Amount: $16.89)
☄️ En3: 2.7933 (Amount: $21.72)
☄️ En4: 2.6424 (Amount: $4.83)
--------------------
☄️ If All Entries Are Activated, Then:
☄️ Average.En: 2.874 ($48.26)
--------------------
☑️ TP1: 3.8572 (+34.21%) (RR:1.65)
☑️ TP2: 4.4436 (+54.61%) (RR:2.64)
☑️ TP3: 5.3193 (+85.08%) (RR:4.11)
☑️ TP4: 6.6869 (+132.67%) (RR:6.4)
☑️ TP5: 8.6086 (+199.53%) (RR:9.63)
☑️ TP6: Open 🔝
--------------------
❌ SL: 2.2786 (-20.72%) (-$10)
--------------------
💯 Maximum.Lev: 3X
⌛️ Trading Type: Swing Trading
‼️ Signal Risk: 🙂 Low-Risk! 🙂
🔎 Technical Analysis Breakdown:
This technical analysis is based on Price Action, Elliott waves, SMC (Smart Money Concepts), and ICT (Inner Circle Trader) concepts. All entry points, Target Points, and Stop Losses are calculated using professional mathematical formulas. As a result, you can have an optimal trade setup based on great risk management.
📊 Sentiment & Market Context:
Market sentiment remains positive as traders eye key entry levels with well-defined risk management in place. With attractive profit targets and controlled stop-loss, this swing trade setup offers an excellent risk-reward profile for both conservative and aggressive traders.
⚠️ Disclaimer:
Trading involves significant risk, and past performance does not guarantee future results. This analysis is for informational purposes only and should not be considered financial advice. Always conduct your research and trade responsibly.
💡 Stay Updated:
Like this technical analysis? Follow me for more in-depth insights, technical setups, and market updates. Let's trade smarter together!

SUI- Maybe the last strongest entry Zone.If SUI stays above the trendline by the daily closing tonight- It will be the probably the best long entry zone in months. Trading is easy guys, Its under your hands how you want it to be! :)
Any genuine questions and chats are always welcomed :)
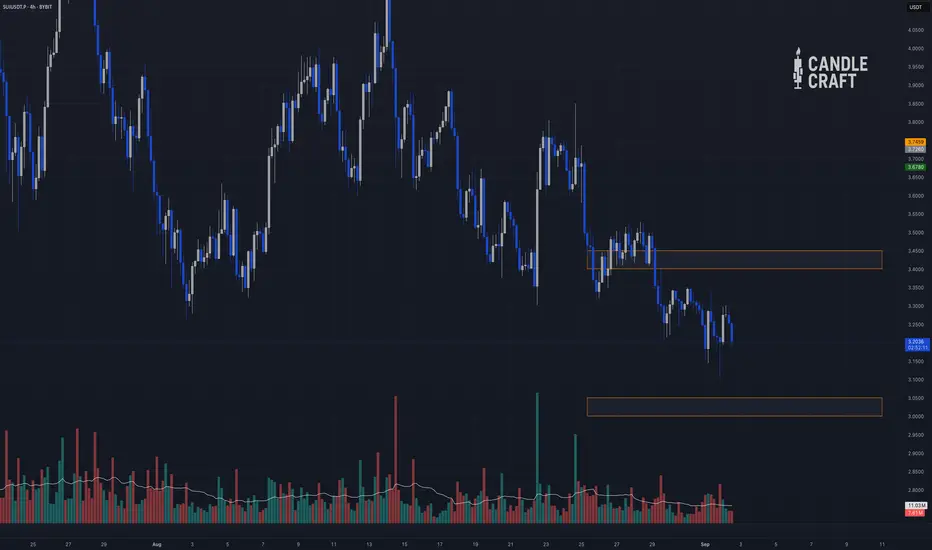
SUI — Short Bias, Long Only on a Deep SweepSUI is drifting like a leaky balloon, trading ~3.25 after failing to reclaim the 3.4–3.45 ceiling. The 12H trend leans bearish, and the market seems happy to keep pressing unless the 3.0–3.1 floor stages a rebellion.
Structure (12H)
• Failed reclaim at 3.4–3.45 supply.
• Support sits at 3.0–3.1 demand zone.
Orderflow + Derivatives
• OI strong → traders engaged.
• CVD very negative → spot sellers pressing.
• Funding neutral → no tilt from perps.
Scalp Scenarios
• Short Idea (Grade A): Reject 3.4–3.45 → fade down to 3.2 → 3.1.
• Long Idea (Grade B–): Sweep 3.0–3.05 lows, reclaim 3.1 → push to 3.35–3.4.
Conclusion
As it stands, SUI looks like a “sell the rips” market. Bulls only get their turn if a deep liquidity sweep flips the 3.0 handle back into support.
🐺 Trade safe, stay sharp, and remember: the market hunts sheep, not wolves.
Weekly trading plan for SUILocally, a trendline can be drawn, and it is acting as resistance. If it breaks, I expect growth, though the price may also face resistance around 3.39 . After a successful breakout above the weekly pivot point, the move could extend into the 3.60–3.72 range.
On the daily chart, the 233 EMA is acting as support. If it breaks and the price fails to reclaim it, we could see a drop toward 2.87 .

$Sui reversed from EntryCRYPTOCAP:SUI Tapped my Entry and reversed back up quickly. Nice limit order.
Putting stop loss bit above breakeven with some profit.
SUI — The $3 Confluence ZoneFor almost 2 months, SUI has been trading sideways in a range between $4 and $3. Today, price tapped the 0.618 Fib retracement ($3.115) of the entire move and bounced, giving a clean long trigger.
Looking ahead, the 1.0 trend-based Fib extension sits at $3.00 → a psychological key level in confluence with the 0.666 Fib retracement, making it the ideal long entry if price sees another drop.
🧩 Confluence Support Zone
0.618–0.702 Fib retracement → primary long entry range
Trend-based Fib extension 1.0: $3.00
0.666 Fib retracement: overlapping $3.00
377 EMA (daily): $2.919
377 SMA (daily): $3.03
🟢 Long Trade Setup
Entry Zone: $3.115 (0.618) → down to $3.00 (extension + retracement confluence)
Best Entry: Around $3.00
Stop-Loss: Below $2.80 (beneath 377 EMA support)
Target: Range highs
Potential Move: +50%
R:R: 1:5+
🔍 Indicators used
Multi Timeframe 8x MA Support Resistance Zones → to identify support and resistance zones such as the weekly 21 EMA/SMA.
➡️ Available for free. You can find it on my profile under “Scripts” and apply it directly to your charts for extra confluence when planning your trades.
_________________________________
💬 If you found this helpful, drop a like and comment!
SUI/ETH Weekly longSUI against ETH looks beautiful 3 touches of the resistance / support line and the price is near that same level now.
What do you think will probably happen?
Another large bounce up.
I'm already in position when it drops I buy more

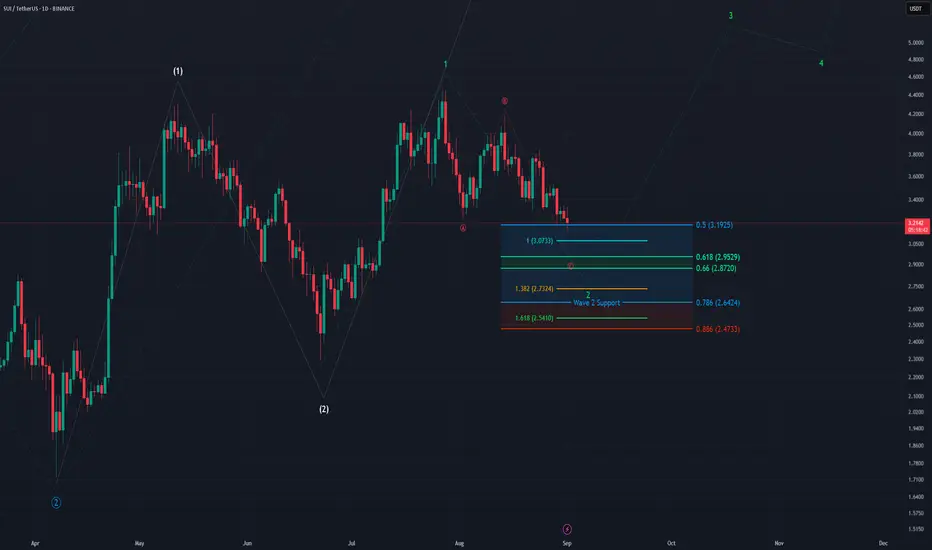
SUI - 1D Elliott Wave Analysis - 01.09.25Greetings, here is our take on SUI from an Elliott Wave point of view.
Sui is potentially forming a multi 1-2 set-up on the higher timeframe which is very bullish if it holds support and breaks out to the upside. Currently we assume that we are forming the green Wave 2 as red ABC. The 1 to 1 FIB target for Wave C is at 3.0733 USD which also is close to 3 USD which is a psychological level. Further targets are the 1.382 FIB at 2.7324 USD and the 1.618 FIB at 2.5410 USD.
The green Wave 2 support area is between the 0.5 FIB at 3.1925 USD which we touched today and the 0.786 FIB at 2.6424 USD. A break below this area suggest a reset of the white Wave 2 or something more bearish. If this set up hold we are looking to see a strong Wave 3 rally afterwards which would take us to a new ATH.
Thanks for reading.
NO FINANCIAL ADVICE.
$SUI lower low and lower highs. About to flip soonCRYPTOCAP:SUI
keeps making lower low and lower High about time it flips.
Looking to long it again from 0.6 FIB level considering the ALT season is around and CRYPTOCAP:SUI
is yet to make another ATH. I will wait for it to reach 3.12$ and enter long.
Sui chance for +60% on this zoneSui continue to grap liquidation but on the monthly and weekly timeframe we are still bullish.
I just saw good zone for trade. At 3.15 we have daily EMA + fibonacci 0.64 + Daily FVG.
I will suggest to add some leverage because invalidation is close to 2.9.
In this mid term bull market of altcoins we can see that SUI has good performance.
Ivan

SUI formed the triangle ┆ HolderStatBINANCE:SUIUSDT is shaping a massive triangle formation after a series of consolidations. The structure highlights indecision, but traders should prepare for a potential breakout. An upside move could aim for the $4.20–$4.50 range, while a downside push would likely test the $3.20 support. Watching these levels closely will help identify whether accumulation or distribution is underway.

SUI — Where Liquidity Turns Into OpportunitySUI has been trading sideways for the past 40 days, offering solid swing opportunities both long and short. At the moment, there is one long setup that stands out → the $3.33 zone, where multiple layers of confluence align.
🧩 Confluence Factors: 5
1.0 Trend-Based Fib Extension: $3.3319
Prior Low: $3.3272 → potential liquidity sweep (SSL)
Anchored VWAP: Supporting the zone
Weekly 21 EMA / SMA: Acting as dynamic support
40d Range Context: Range low positioning
🟢 Long Trade Setup
Entry Zone: ~$3.33 (liquidity sweep into support)
Stop-Loss: Below $3.25
Target: Range highs near $4.20
R:R Potential: 1:10+
Note: Wait for bullish confirmation (order flow or strong reaction) before entering.
Technical Insight
The $3.33 level combines liquidity, fib projection, VWAP support, and the weekly 21 EMA/SMA → all pointing to a high-probability reaction zone. In sideways environments, such confluence at range lows often defines pivot points for the next swing move. If defended, upside targets remain the range high around $4.20.
🔍 Indicators used
Multi Timeframe 8x MA Support Resistance Zones → to identify support and resistance zones such as the weekly 21 EMA/SMA.
➡️ Available for free. You can find it on my profile under “Scripts” and apply it directly to your charts for extra confluence when planning your trades.
_________________________________
💬 If you found this helpful, drop a like and comment!

$SUI vs $SEI – History Repeats?Both charts are following a nearly identical 1-2-3-4 pattern.
👀 CRYPTOCAP:SUI already printed a +1,000% move from the local bottom at step 3.
🔥 Now NYSE:SEI looks like it's entering the same phase.
🧠 Is SEI the next SUI?
I’ve been tracking both since early 2024, and this setup looks 🔥
Don’t fade the fractals.
