SUI PUMP? Time to talk about CRYPTOCAP:SUI 💧 As we can see on the chart, everything was looking great and heading toward a new ATH, but then came the total market crash and that infamous “Black Friday” when SUI dropped to 0.50 something I’ll ignore for this analysis since it was just a mix of random events.
Now back to the present. SUI isn’t in its best moment, both because of mistakes from its founders and its current market structure. That leaves us with two possible paths.
First, a double bottom followed by a quick rise toward 3$. Second, a break below that double bottom, a nice liquidity grab, and a rebound from the bullish structure that led to the last high back when everyone thought SUI would return to 5$.
Overall, US news looks pretty positive for crypto, and I don’t see SUI dropping to 1.80$ unless Bitcoin crashes hard. So, my dear bunnies, it’s time to start eyeing a long position targeting around 3.5$ 🐇🚀
Trade ideas

My point of View For SUIDear Follower
I got a multi request to analyze SUI
I see SUI most likely will hit $5.5 easily
I recommend liquidate 50% of your fund at that price then start use a trilling stop under each last new bottom for the rest of the fund
Good luck every one

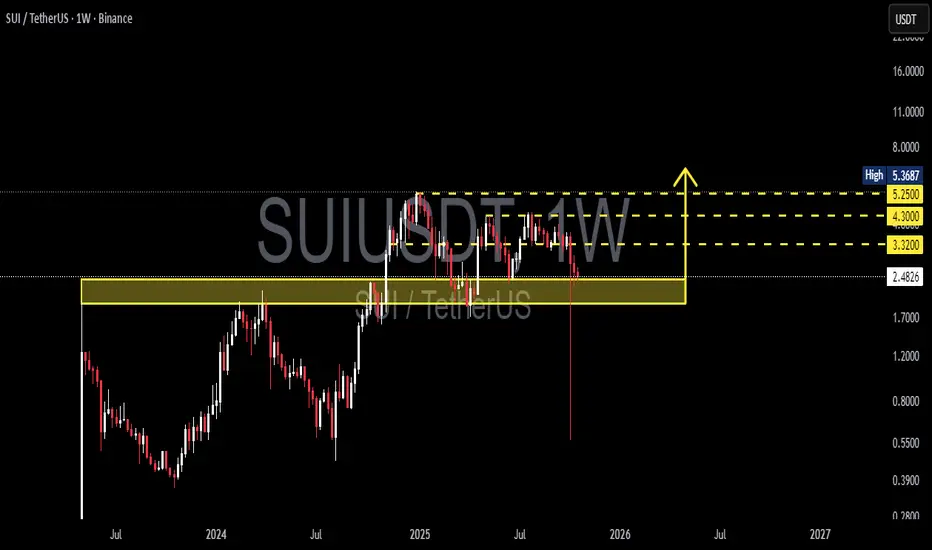
SUI/USDT — Last Defense Before the Next Major Move?SUI is now approaching a critical demand zone between $1.93 – $2.40 — a region that once acted as macro resistance during its early 2024 breakout, and now serves as the final major support on the weekly structure.
After multiple failed attempts to reclaim the mid-range resistance at $3.32 – $4.30, price action has rotated downward into this yellow box — forming what could become either a springboard for a major reversal or a breakdown trigger if support fails.
---
🔹 Technical Overview
The yellow block ($1.93–$2.40) represents a long-term structural pivot — previously resistance, now retested as support.
The wick rejection from lower levels shows early buying interest and liquidity sweep below the zone.
However, momentum remains neutral to bearish until price can reclaim $3.32 on a weekly close.
---
🟢 Bullish Scenario
If SUI successfully holds above $1.93 and forms a strong weekly close above $2.40, buyers could gain control and aim for:
$3.32 → key mid-level resistance
$4.30 → previous consolidation cap
$5.25 – $5.36 → macro breakout target
A reclaim of $3.32 would confirm a potential trend reversal, shifting market structure from distribution to accumulation.
---
🔴 Bearish Scenario
If SUI breaks and closes below $1.93, the structure shifts decisively bearish.
Downside targets open toward $1.20, then $0.80 – $0.55 (prior liquidity base).
Breakdown beneath this zone would signal loss of structural support and likely trigger capitulation-type movement.
---
⚖️ Key Takeaway
SUI is at a macro decision zone — where either a long-term base forms or a deeper correction begins.
A clean weekly close and volume confirmation will define the next 3–6 month direction.
This is not a random level — this is where smart money decides who wins the next phase.
---
📊 Major Levels
Support Zone (yellow box): $1.93 – $2.40
Resistance Levels: $3.32 → $4.30 → $5.25 – $5.36
Trend Confirmation: Weekly close above $3.32 = bullish reversal
---
#SUI #SUIUSDT #Crypto #TechnicalAnalysis #PriceAction #Altcoins #SwingTrading #SupportResistance #CryptoCharts #MarketStructure #SUIAnalysis
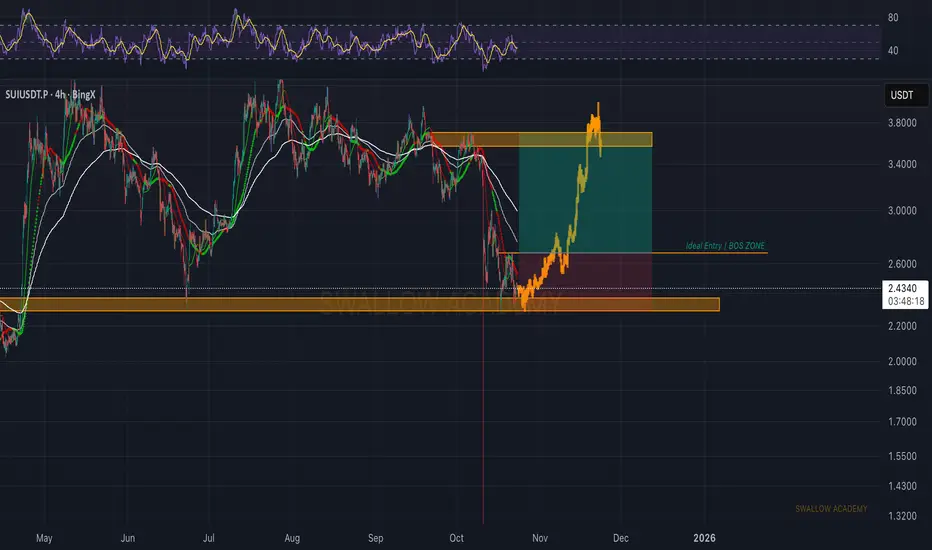
Sui (SUI): Buyers Have To Defend Current Zone | Looking For BOSSUI is holding well above the support zone, where we already saw a clean reaction from buyers. The structure is forming nicely, and what we’re waiting for now is a proper BOS — that would confirm continuation and open the way toward upper targets.
If sellers manage to push price back below the support, we could revisit the lower zones again, but as long as buyers defend it, we stay focused on upside potential.
Swallow Academy
Sui back to the bottom of the range. SUI is back to the bottom of the range, which was defined as a point of interest early on. This is critical because if SUI breaks below with a sustainable move, it confirms a lower low. Dropping to the H4 allows us to look for support with a healthy invalidation. RR makes it ideal. There are signs of divergence and a decent structure. Watch list material.
SUI/USDT ; A decline is the best buying opportunity.Hello friends
Given the price decline that we are witnessing, the price has created good channels at the specified support and buyers have entered and supported the price, which is a good sign for the currency.
Now, given the trend reversal and the price being pushed up by buyers, we can buy in steps with risk and capital management and move towards the specified targets.
We have also identified an important level that if the price reaches it, a correction can be expected and it is very important to take profits in these areas.
*Trade safely with us*
SUIUSDT the 2$ support strong to pump price above 3$ againWe are now anticipating a potential resumption of the bullish trend. Our analysis identifies a significant resistance confluence at the $3.00 level, which aligns precisely with the ascending trendline established on the chart. For a confirmed bullish signal, we require a decisive price breakout, supported by strong volume, above this key technical level. Such a breakout would invalidate the current resistance structure and likely initiate a new phase of sustained upward momentum, paving the way for the asset to target higher resistance zones as projected in our analysis.
DISCLAIMER: ((trade based on your own decision))
<<press like👍 if you enjoy💚

SUI ; The future of SUIHello friends
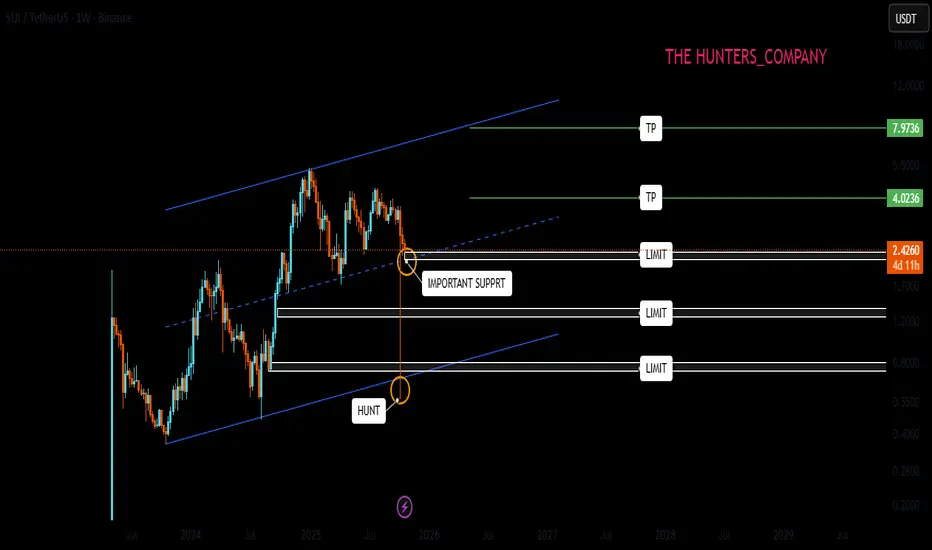
You see a long-term weekly channel that after setting a new ceiling in the weekly, the price corrected until the bottom of the channel even came below the channel, which many thought was destroyed, but the price returned and is now in an important range.
This weekly candle that guided you to the bottom of the channel is very important. There are many orders in the shadow of this candle and it is possible that the price will correct up to 50% of the shadow of the candle.
For this reason, the best way to buy is to manage risk and capital, and buy in steps in the specified areas and move with it to the set goals.
*Trade safely with us*
SUI Analysis (1H)It seems that an ABC pattern is forming on the 1-hour chart, with wave B already completed.
Wave B appears to have been a triangle.
A buy/long position can be entered on the pullback to the green zone.
The targets marked on the chart are for wave C, which is a bullish wave.
A daily candle close below the invalidation level would invalidate this analysis.
For risk management, please don't forget stop loss and capital management
Comment if you have any questions
Thank You

SUI New Update (1H)This analysis is an update of the analysis you see in the "Related publications" section
The trigger line has been broken, and the 4-hour full-body candle | which were our confirmations | have failed.
The wave B pattern has shifted from a triangle to a diametric formation, and it seems that the pattern is developing in the structure we’ve outlined on the chart.
Let’s wait and see what happens.
For risk management, please don't forget stop loss and capital management
When we reach the first target, save some profit and then change the stop to entry
Comment if you have any questions
Thank You

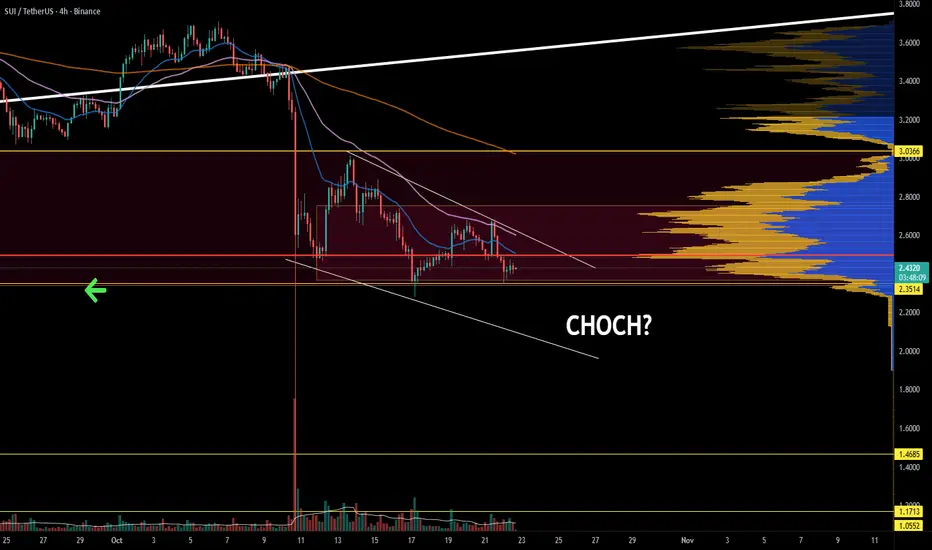
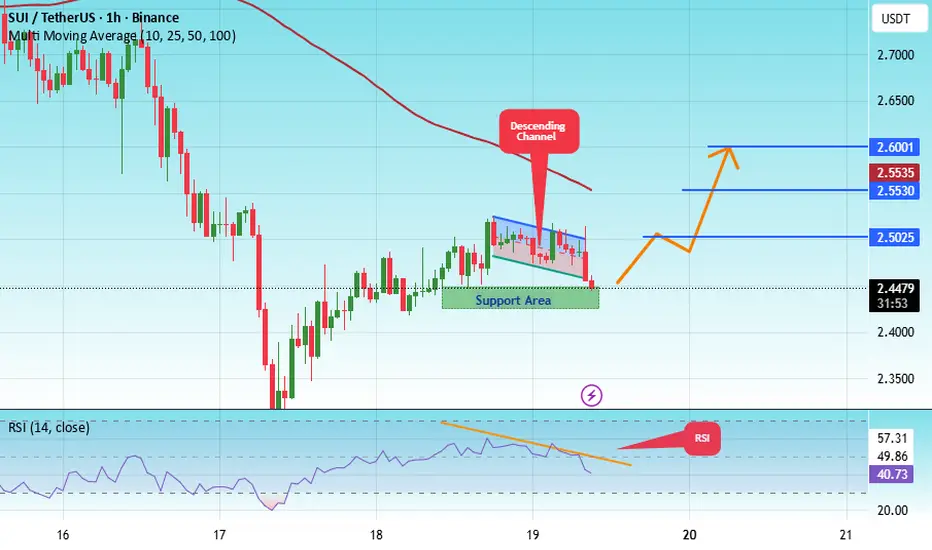
#SUI/USDT Bullish scenario#SUI
The price is moving within a descending channel on the 1-hour frame, adhering well to it, and is heading for a strong breakout and retest.
We have a bearish trend on the RSI indicator that is about to be broken and retested, which supports the upward breakout.
There is a major support area in green at 2.43, representing a strong support point.
We are heading for consolidation above the 100 moving average.
Entry price: 2.45
First target: 2.50
Second target: 2.55
Third target: 2.60
Don't forget a simple matter: capital management.
When you reach the first target, save some money and then change your stop-loss order to an entry order.
For inquiries, please leave a comment.
Thank you.
SUI - Oversold and Testing a Major Intersection Zone!🏹SUI has reached a critical technical intersection, where the lower boundary of the long-term channel meets the bottom of the descending red structure. Historically, this area has acted as a launchpad for reversals, with multiple reactions from the same channel base in the past.
After weeks of heavy downside pressure, SUI now looks deeply oversold, both technically and structurally. The confluence between the horizontal support zone and the diagonal trendline adds strength to this level, making it a high-probability area for a short-term relief rally.
📈As long as the price holds above this support intersection , the next potential wave could target the upper red channel first, followed by the upper blue boundary near $4.5 if momentum continues to build.
If this level breaks decisively, it would signal a structural shift — but for now, bulls still have a chance to step in from this confluence zone.
📊All Strategies Are Good; If Managed Properly!
~Richard Nasr

SUI Reaction from Pivot — Watching 2.42–2.47 for BounceSui has already reacted from the weekly pivot point at 2.62 and is now showing a slight correction. Locally, we could see a bounce from the 2.42–2.47 range.
If the price returns above the pivot point, the next target will be 3.00 . In case of negative market sentiment and a break below 2.28 , I expect a decline toward 1.89 .

sui 20 oct 2025 analysisif today 20 oct 2025 daily close we can stand the price above 2.6 , possibly we can continue rally up

SUI/USDT - 15M Timeframe - LONGNice long opportunity. I used a Fib retracement from the low-to-high of this previous wave, which gave me my entry point right around the 0.618 zone. Stop placed comfortably below the pivot. Will be moving my SL to break even once TP 1 is reached.
Entry: 2.637
TP 1: 2.669
TP 2: 2.693
TP 3: 2.734
Stop Loss: 2.624
*Not financial advice.

Short SUIThe setup fades a rebound into midrange supply beneath a declining moving‑average ribbon, leaning on mean‑reversion while the broader alt market stays capped under higher‑timeframe resistance.
Entry is taken only after an hourly rejection confirms failure at the midrange, avoiding premature fills during liquidity sweeps and stop‑runs.
Invalidation is deliberately loose to resist wicks, exiting only on a four‑hour close that reclaims the upper resistance band, with a fail‑safe beyond the supply and trend‑filter confluence.
Profit aims at the prior range floor as the base case, with the option to let it run for an extended leg if momentum breaks that floor or to trail on a trend‑flip signal.
Risk is modest and context‑aware, stepping aside if the altcoin index breaks through major resistance and signals a regime change that undermines short expectancy.
Long trade
1Hr Tf overview
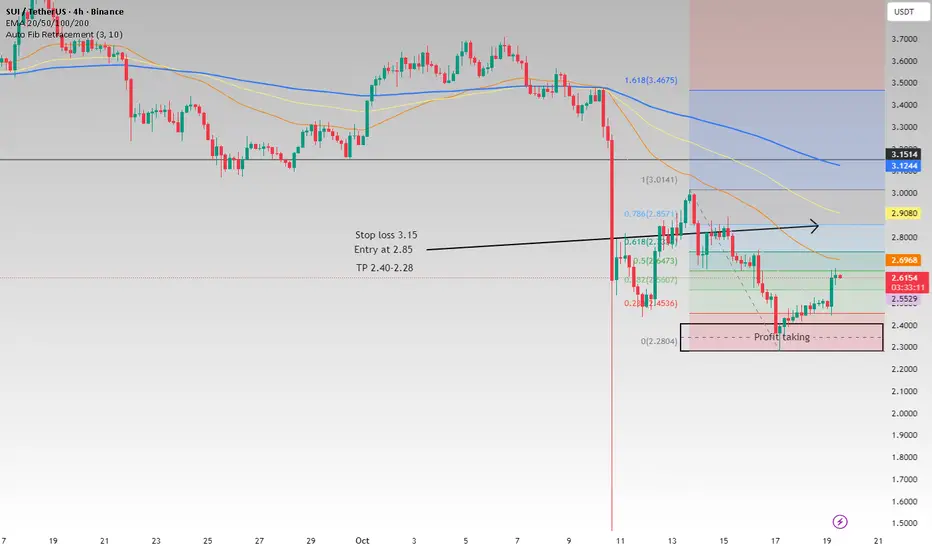
📘 Trade Journal Entry
Pair: SUIUSDT.P
Date: Mon 13th Oct 25
Time: 10:30 am
Session: London → New York Session AM
Direction: Buyside Trade
Timeframe: 4-Hour
🔹 Trade Details
Entry: 2.8172
Profit Level: 3.2539 (+15.50%)
Stop Level: 2.7944 (–0.81%)
Risk-Reward (RR): 19.15
🔸 Technical Context
Model Type: Accumulation → Consolidation → Breaker Block → FVG Continuity
Narrative:
Price consolidated within a compression phase at the base of the prior liquidity sweep. The reaccumulation formed after a deep mitigation into a 4H FVG, aligning with the 50 EMA reclaim and VWAP equilibrium retest.
4Hr
CHOCH and BOS confirm directional shift from previous markdown.
FVG cluster at 2.80–2.85 served as the low-risk entry zone.
Volume expansion and liquidity absorption are evident around 2.81.
The target region is mapped to the prior imbalance and breaker block at 3.25
(HTF premium zone). Market structure gap fills coincide with 0.75 Fibonacci projection — confirming confluence for TP.
🧠 Sentiment Context
Market sentiment remains risk-on, as broader altcoin rotation regains traction after weeks of compression. The Fear & Greed Index showing recovery above 45 suggests returning investor confidence. SUI fundamentals (emphasis on scalable gaming-focused blockchain) further align with speculative inflows into high-throughput L1 ecosystems.
⏱️ Trade Management Notes
Entry confirmation via a break of micro-swing high and volume-backed displacement.
Partial profits recommended at 3.10 (mid-range liquidity). Continue monitoring reaction around 3.25 — a likely short-term distribution point before next accumulation.

#SUI/USDT Bullish scenario#SUI
The price is moving within a descending channel on the 1-hour frame, adhering well to it, and is heading for a strong breakout and retest.
We have a bearish trend on the RSI indicator that is about to be broken and retested, which supports the upward breakout.
There is a major support area in green at 2.61, representing a strong support point.
We are heading for consolidation above the 100 moving average.
Entry price: 2.81
First target: 2.96
Second target: 3.11
Third target: 3.30
Don't forget a simple matter: capital management.
When you reach the first target, save some money and then change your stop-loss order to an entry order.
For inquiries, please leave a comment.
Thank you.

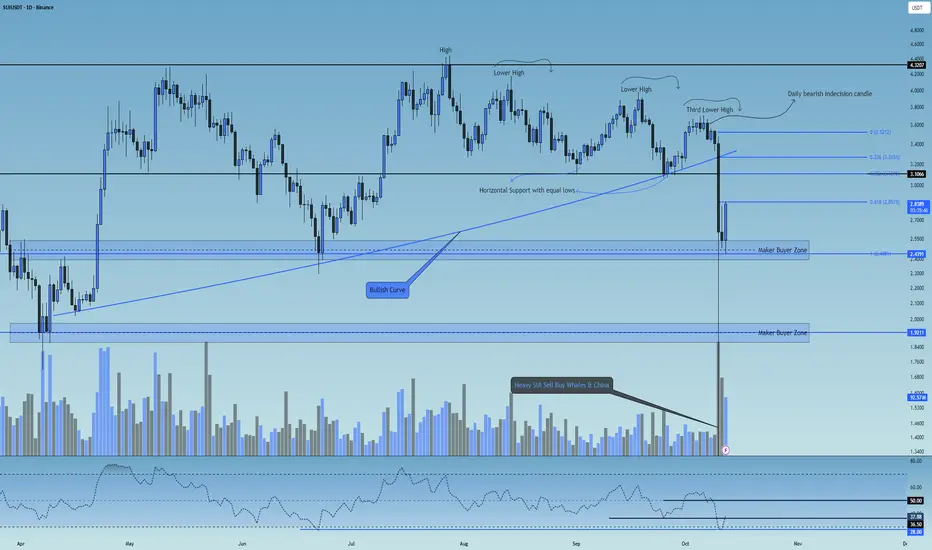
SUI 1D Analysis - Key Triggers Ahead☃️ Welcome to the cryptos winter , I hope you’ve started your day well.
⏰ We’re analyzing SUI on the 1-Day timeframe .
👀 On the daily timeframe of the SUI coin, we can see that SUI was moving along a slightly upward curved line, continuously forming higher highs and higher lows. After creating a top around the $4.3 zone, it faced a strong rejection and dropped toward the $3.3 support area. From there, it started forming lower highs and lower lows, practically entering a descending channel.
At the third and final lower high, SUI formed a strong daily indecision candle, which broke its multi-timeframe support at the $3.5 zone and continued moving downward. During the historic flash crash night of crypto, SUI opened around $3.4, then plunged to $0.5. Following exchange buybacks and market maker interventions, it made a massive upper shadow wick back toward the $2.6 zone, where it finally closed its daily candle.
🧮 Looking at the RSI oscillator, SUI experienced a heavy rejection from the 57 level, dropping below 50 and moving toward its daily oversold zone. The key RSI levels are currently around 36.5 and 50, with the 36.5 zone acting as the nearest crucial pivot level. A bounce from this region would slightly reduce the fear and FOMO of a deeper drop among traders.
🎮 A Fibonacci retracement drawn from $3.5 down to the market maker support zone at $2.43 reveals several important resistance levels. The 0.618 zone serves as a major resistance level—if this level breaks, it could lead to a higher low formation above $2.5, signaling a potential bullish reversal. The next resistance lies around 0.382, which is currently out of buyers’ immediate reach.
🕯 The recent candle sizes and volumes indicate strong selling pressure and rapid price teleportation downward. Signs of this drop could already be seen through the bearish indecision daily candle, but such an extreme dump couldn’t have been predicted purely by technicals. This crash was largely caused by Chinese fund managers selling their holdings, with large wallets entering risk-off mode, unwilling to take further losses. They, along with the Chinese government, sold off their SUI positions to prevent deeper damage—a case of “prevention is better than cure.”
During the recovery phase, exchanges executed significant buybacks, and because the price had fallen to major discounts, many market-making buyers placed strong limit orders at low levels, which helped drive the price back upward.
🪙On the weekly timeframe (SUI/BTC pair), this trading symbol has an extremely critical bottom—losing it could lead to a deep correction that would heavily impact SUI’s core structure. Thanks to buyer support and exchange buybacks, this bottom hasn’t yet been broken in the current weekly candle. There’s also a dynamic resistance trendline pressing down on its relative value; currently, SUI is in the final third of this price compression phase. If this trendline breaks, SUI could gain relative strength against Bitcoin and move upward.
🧠 Currently, SUI sits below its key resistance zone at $2.85. A break and daily close above this level could allow SUI to form a higher low compared to its flash crash bottom, retracing part of the recent drop and providing a better exit opportunity for many holders and traders.
This scenario will be updated with more precision and detail in future analyses.
❤️ Disclaimer : This analysis is purely based on my personal opinion and I only trade if the stated triggers are activated .
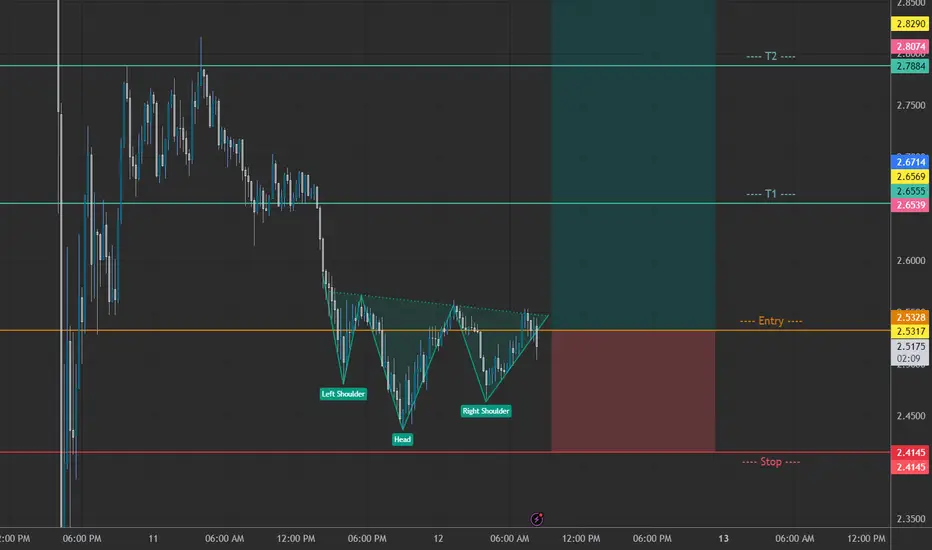
SUI 15m - Head and Shoulders LongNice H&S formation. Considerably Low risk. Only once price breaks at the neckline, I'll be entering long. My plan below:
Entry: 2.530
TP1: 2.655
TP2: 2.785
TP3: 3.033
SL: 2.410
Not advice. Safe trading!
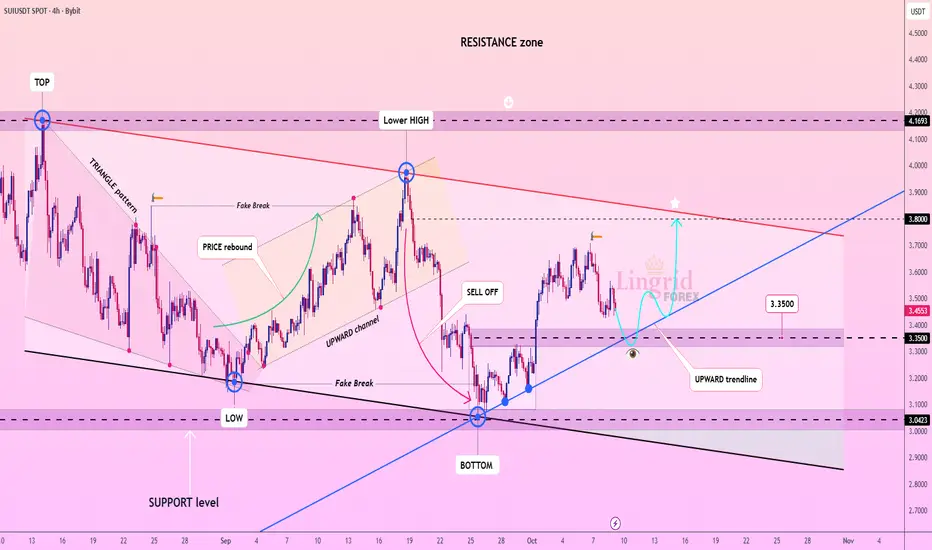
Lingrid | SUIUSDT Support Hold Recovery StabilizationBINANCE:SUIUSDT is pulling back to support 3.35 and upward trendline after a sharp rebound from support zone. The structure shows a recovery attempt within a broader upward correction, suggesting potential move toward 3.80. As long as price holds above 3.35 support, a bullish continuation toward 3.80 remains valid. Momentum is stabilizing, hinting that buyers may regain strength for another test of the upper resistance channel.
⚠️ Risks:
A close below 3.35 could trigger a retest of 3.00 support.
Weakness across major altcoins may limit upside recovery.
Unexpected market sentiment shifts or BTC corrections could suppress the rebound attempt.
If this idea resonates with you or you have your own opinion, traders, hit the comments. I’m excited to read your thoughts!
$SUI Analysis 🚨 CRYPTOCAP:SUI Analysis 🚨
Watching both sides here 👀
📉 Short idea: looking for confirmation above PDH before entering
📈 Long idea: eyeing the demand zone — with an FVG sitting right above it for confluence
Just waiting for price to show its hand🔥
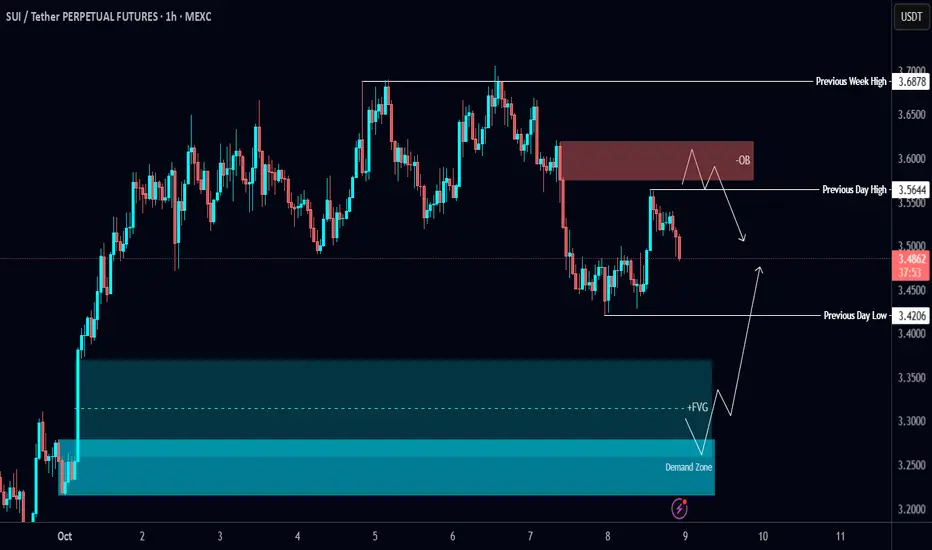
$SUI Analysis🚨 CRYPTOCAP:SUI Analysis 🚨
Watching for a clean setup here 👀
Ideally, I want to see a sweep of the PDL and a tap into the 4H FVG or demand zone before any upside move — that’s my long area 📈
Everything lines up nicely with the OTE zone too ✅
