SUIUSDTThe overall trend is bearish BINANCE:SUIUSDT , but the 2.90 USD area seems to be a crucial level for a potential trend reversal, with a possibility of price bouncing back. The price is currently near the initial support at 2.92 USD, and it is likely to move upwards in reaction to this level. A buy signal is triggered at 2.9264 USD with a stop loss at 2.77 USD. The next price targets are 3.250 USD, 3.600 USD, 3.800 USD, and 4.28 USD.
📈 Buy Signal: Entry at 2.9264 USD
🚫 Stop Loss: 2.77 USD
🎯 Targets: 3.250 USD | 3.600 USD | 3.800 USD | 4.28 USD
Trade ideas

Sui short to $3.00Just opened up a short on sui. Aiming for $3.00 area
sl: 3.27
Potential early targets on chart $3.089, $3.04
Time sensitive
2 RR if full tp gets hit

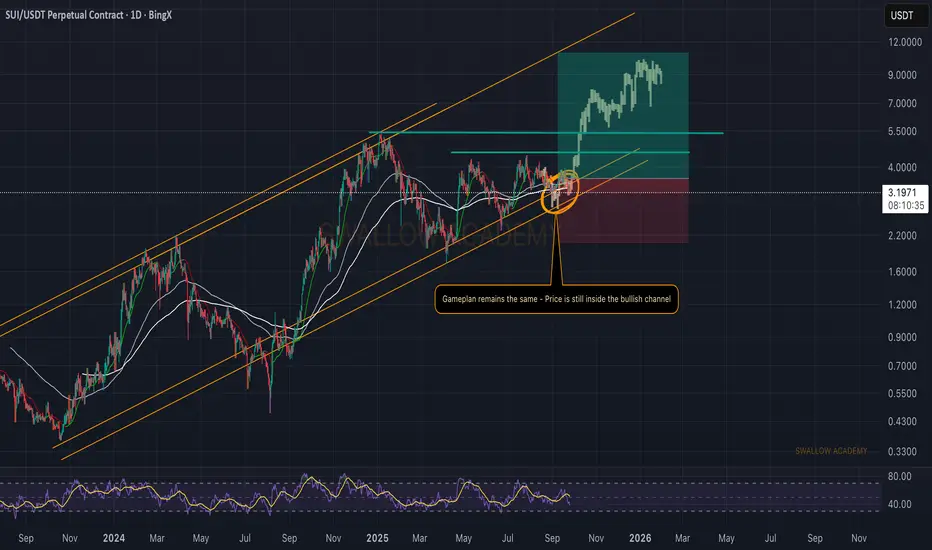
Sui (SUI): Still Supreme Bullish Setups Building Up HereSUI continues to respect the bullish channel, with the price holding above the midline and defending the EMAs during recent volatility.
The game plan remains the same: as long as the channel holds, the upside structure is intact, and we’ll be looking for continuation toward higher targets. A breakout above $4 would confirm momentum picking up, while losing this channel would shift our attention back to the lower support zone.
Swallow Academy
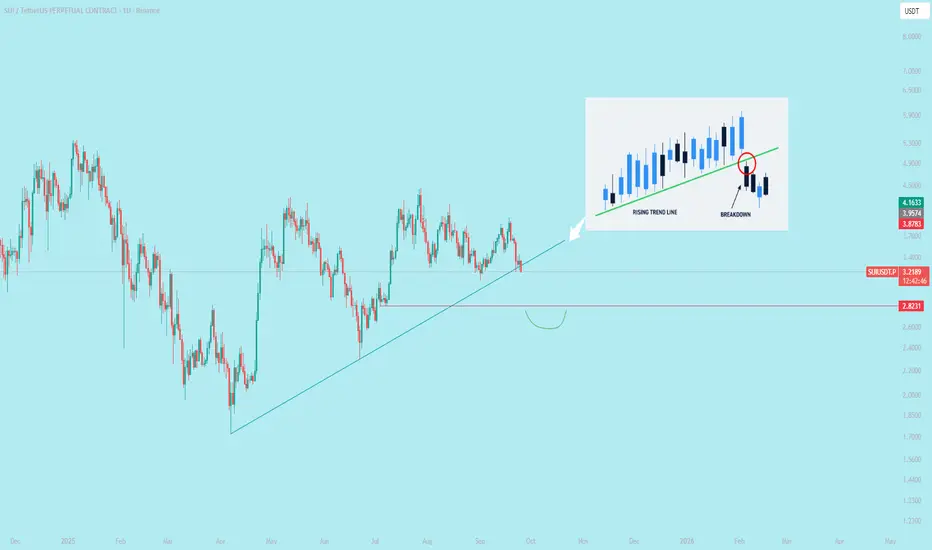
$SUI Trendline breakdownA trendline breakdown occurs when the price of an asset falls below a trendline, signaling a potential reversal or shift in market momentum. Here’s how it works, explained concisely:
1. **Trendline Definition**: A trendline is a diagonal line drawn on a price chart connecting higher lows in an uptrend or lower highs in a downtrend, indicating support or resistance levels.
2. **Breakdown Process**:
- In an **uptrend**, a trendline connects higher lows, acting as support.
- A breakdown happens when the price closes below this trendline, suggesting buyers are losing control and sellers are gaining momentum.
- The break often indicates the end of the uptrend, potentially leading to a price decline or consolidation.
3. **Confirmation**:
- A single candle closing below the trendline may not confirm a breakdown.
- Traders often wait for additional signals, like a strong bearish candle, increased selling volume, or a retest of the trendline (where price fails to reclaim it).
4. **Key Factors**:
- **Volume**: Higher volume on the breakdown strengthens its validity.
- **Timeframe**: Breakdowns on longer timeframes (e.g., daily or weekly) are more significant than on shorter ones (e.g., hourly).
- **Retest**: Price may return to test the broken trendline as resistance before continuing downward.
5. **Implications**:
- A breakdown can signal a trend reversal (from bullish to bearish) or a temporary pullback.
- Traders may use it to enter short positions, set stop-losses above the trendline, or exit long positions.
6. **False Breakdowns**:
- Sometimes, price briefly dips below the trendline but quickly recovers, known as a "fake out."
- To avoid this, traders use additional indicators like moving averages, RSI, or support levels for confirmation.
**Note**: Always combine trendline analysis with other technical indicators and risk management, as breakdowns are not foolproof signals. Market conditions and news can also impact outcomes.
$sui chart analysis Sui correcting and almost in our entry zone i will be taking long entry with tight stop loss from marked zones. it has to flip that trend line for even bullish structure.
SUI Swing Trade Setup – Accumulation at Key SupportSUI has retraced to a major support zone, presenting a potential long swing setup. Price action is showing signs of a possible base, with another dip into early September likely before a reversal.
The strategy here is to ladder into long positions between $2.80–$3.20, aiming for a bounce toward previous resistance zones. Risk is managed with a tight invalidation below the last major support.
• Entry Zone: $2.80–$3.20
• Targets: $4.10–$4.50, $5.00–$5.20
• Stop Loss: Below $2.40
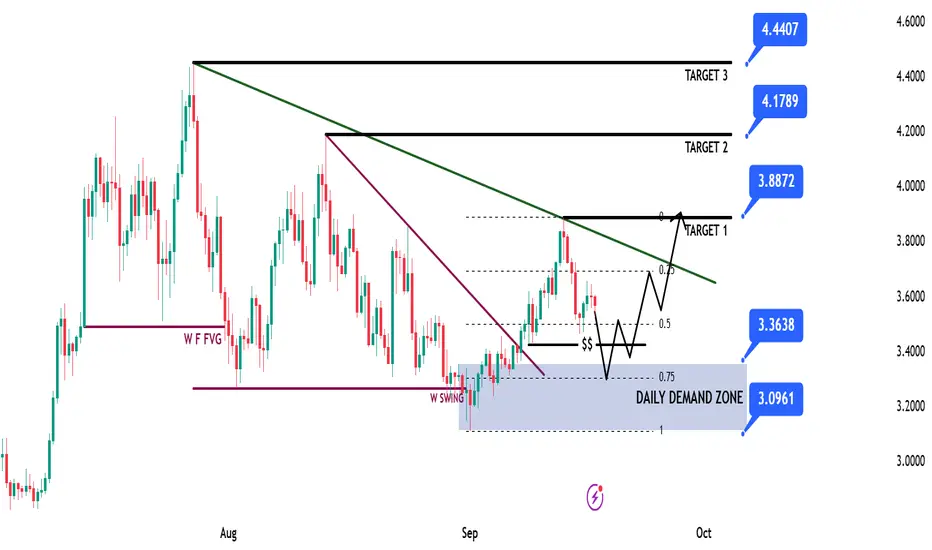
SUI Game Plan - Suinetwork📊 Market Sentiment
Market sentiment remains strongly bullish as the FED is expected to deliver a 0.25% rate cut, with speculation building for a possible 0.5% cut in September. Monetary policy shifts are being driven by both inflation trends and weakening labor market data. The latest August and September job reports were soft, signaling that the economy is cooling rapidly. This environment continues to fuel expectations for a major bullish run in the weeks ahead.
📈 Technical Analysis
Price is on HTF bullish trend so we will be looking only long setups.
Price ran HTF liquidity and closed above then broke the market on daily-weekly timeframe, creating the Daily Demand Zone.
Moreover, price broke the bearish trendline and closed above, giving strong upward momentum. Now price is retracing back into the Daily Demand Zone.
📌 Game Plan
1-Price to hit back to Daily Demand Zone
2-Price to hit possibly 0.75 max discount range zone. If not, I’ll still enter with LTF confirmation.
🎯 Setup Trigger
4H break of structure after hitting 3.36$ level. I won’t enter unless I see the 4H BOS.
📋 Trade Management
Stoploss: Below 4H swing low responsible for BOS
Targets:
TP1: 3.88$
TP2: 4.17$
TP3: 4.44$
💬 Like, follow, and comment if you find this setup valuable!
⚠️ Disclaimer: This content is for informational and educational purposes only and does not constitute financial, investment, or trading advice. Always DYOR before making any financial decisions.
SUI/USDTBINANCE:SUIUSDT has dropped right to the intersection of its ascending support and horizontal support zone.
This is a key demand area where buyers could step in and take control.
As long as SUI stays above $3.11, there’s no major concern yet.
I’ll update if needed.

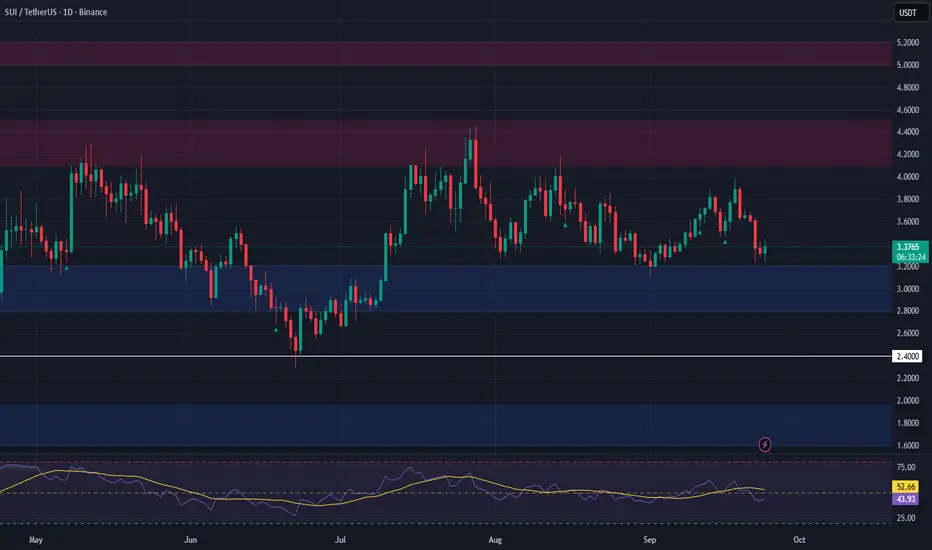
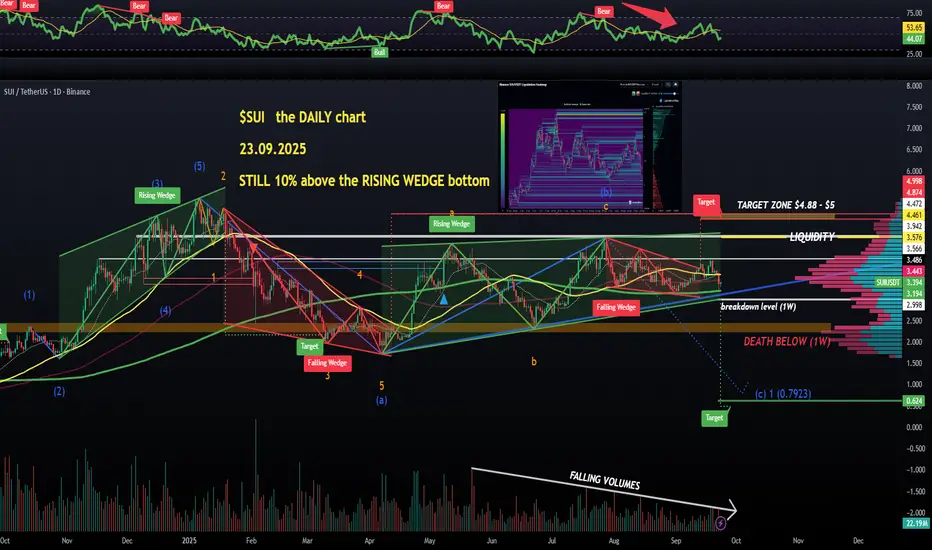
$SUI the DAILY chart: still in a troublesome RSING WEDGEOkay, so I did drop the CRYPTOCAP:SUI weekly timeframes analysis yesterday (see the post I'm quoting), and this asset was showing a 5-month old bearish RISING WEDGE, so here I am zooming in on the DAILY chart for a more detailed view.
The wedge remains the main focus on the daily chart and a closer look is telling us that the lower trendline of this pattern is supported by the 200 MA (green line at $3.19 atm).
200 MA on 1D is widely considered as a BULL/BEAR market division line, so we really don't want to lose this RISING WEDGE/200 MA.
Now for any BULLISH moves, we first MUST see a breakout above $3.95. That will make the price action bullish on all smaller timeframes. Obviously nothing good will happend until CRYPTOCAP:BTC dominance starts showing weakness.
Based on the WEEKLY and DAILY alone, I'm not going to get involved with #SUI🔥 until it starts showing ACTUAL strenght.
For example, the volumes need to start picking up, the way they have been.. Falling volumes are never good for the BULLS👽💙
SUIUSDT #001 ( You see what I see ? ) Hello dear traders.
Good days .
First of all thanks for your support and comments.
——————————————————————————
On Bullish weekly Gann square SUIUSDT , I can see the collecting spring for breaking 0.5 Gann square price zone . On daily time frame as you can see after finishing Bearish Gann Square bullish move on bullish Gann Square filled 0.75 up to 1 of Gann Box price level which it’s repeated in all cycles .
On daily bearish Gann square price correct itself up to 0.75 Gann price level and aspected with small decline to the 0.5 Bearish Gann Square ( about 3.45$ - 3.55$ ) will be good opportunity for next Bull run .
In detail buy zone will updated .
Good luck and safe trades.

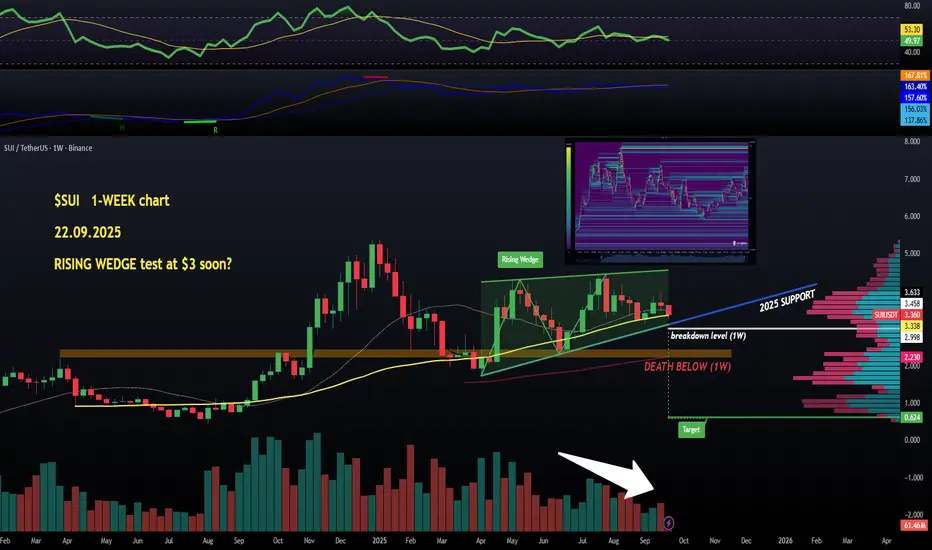
$SUI - RSISNG WEDGE test at $4 soon?Alright, so CRYPTOCAP:SUI is the most requested coin for me to cover, let's go starting with the WEEKLY view, the DAILY, 4-hour and the HOURLY charts in next posts later on this evening.
So the weekly has got one chart pattern to worry about, the 5-month-old RISING WEDGE which is basically a red flag despite making higher highs and higher low (bullish market structure intact).
#SUİ is still a touch above the yellow (50 MA) line, and key levels to watch are the $3 mark (breakdown level) and the blue rising support. We really don't want to lose any of these levels.
Actually, I will look for some shorts below $3.
Liquidity wise, not much to clear below the price, and a lot of it above the last local highs. See the attached Liquidity Map.
Next posts to continue the analysis on shorter timeframes☝️👽
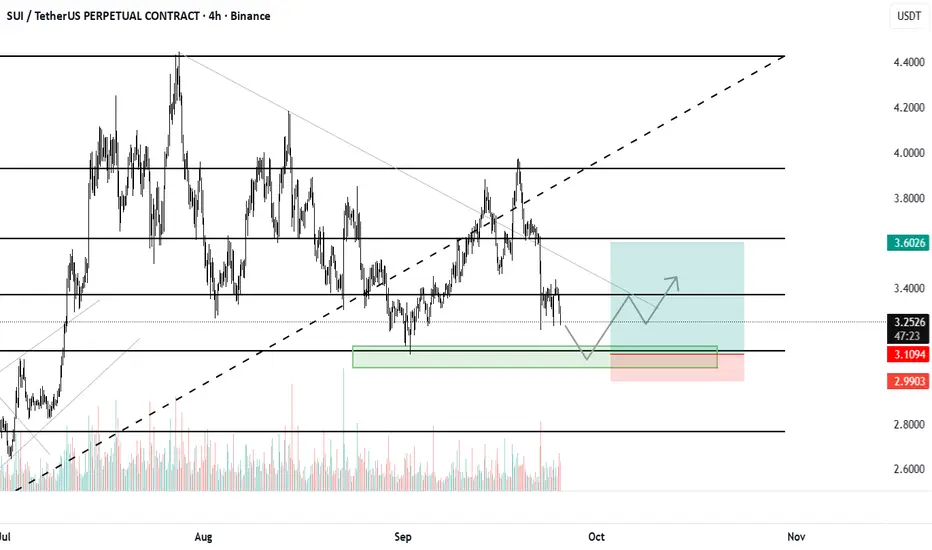
SUI / USDT – Bullish Continuation SetupSUI is respecting its ascending trendline on the daily chart and showing strong support around $3.2 – $3.3. As long as this level holds, the price is likely to continue its upward movement toward the $4.0 and $4.5 resistance zones.
Entry Zone: $3.2 – $3.3
Targets: $4.0 / $4.5
Stop Loss: Below $3.0
Trend remains bullish while holding above the trendline.

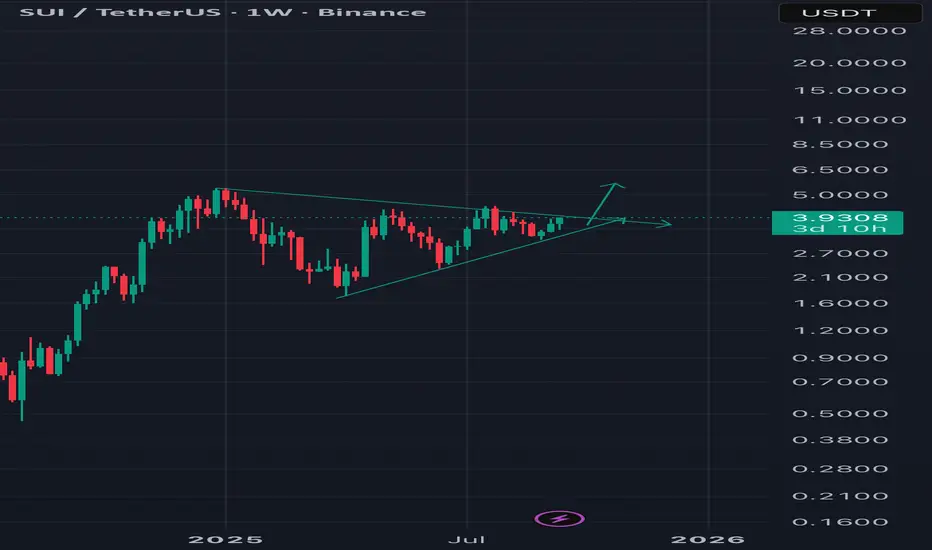
Double-digit SUI is only a matter of time#SUI Still deeply undervalued, aside from strong fundamentals we have bullish technical setup🔥
We’re seeing a local bullish pennant — its breakout will unfold a breakout of the bigger structure → which is 300 Days accumulation inside the Symmetrical Triangle💁♂️
#SUI/USDT mid-term I believe this one will pump#SUI
The price is moving in a descending channel on the 1-hour frame and is expected to break and continue upward.
We have a trend to stabilize above the 100 moving average once again.
We have a downtrend on the RSI indicator that supports the upward move with a breakout.
We have a major support area in green that pushed the price higher at 3.62.
Entry price: 3.70.
First target: 3.75.
Second target: 3.82.
Third target: 3.90.
To manage risk, don't forget stop loss and capital management.
When you reach the first target, save some profits and then change the stop order to an entry order.
For inquiries, please comment.
Thank you.

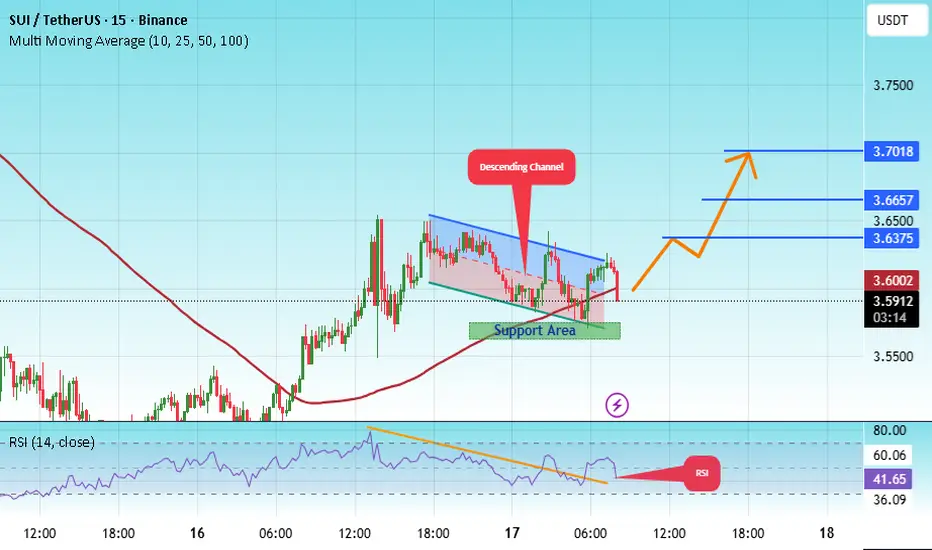
#SUI/USDT bullish structure formed at the chart#SUI
The price is moving within a descending channel on the 1-hour frame, adhering well to it, and is heading for a strong breakout and retest.
We have a bearish trend on the RSI indicator that is about to be broken and retested, which supports the upward breakout.
There is a major support area in green at 3.56, representing a strong support point.
We are heading for consolidation above the 100 moving average.
Entry price: 3.60
First target: 3.64
Second target: 3.66
Third target: 3.70
Don't forget a simple matter: capital management.
When you reach the first target, save some money and then change your stop-loss order to an entry order.
For inquiries, please leave a comment.
Thank you.
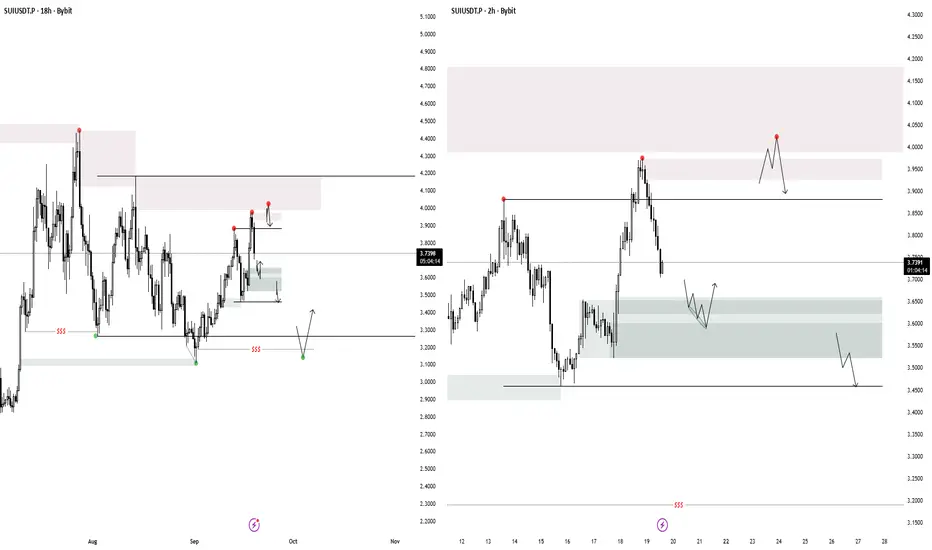
SUI 19.09.25SUI is looking good for a potential distribution. If it can confirm a distribution model after mitigating the supply chain it could go down to the MTF accumulation POI's, since there is nothing but liquidity below.
SUIUSDT.P SHORTSUIUSDT.P SHORT
The market has the potential for an downtrend to 200 MA
Price: 3.8 $
Main target 3.7441 $
SL 3.8919 $

SuiusdSoon break to the upside . Alt coins ETFs getting approved alt season starts next I think sui goes re test all time high and possible higher before the run is over we will see if it breaks to the upside
DeGRAM | SUIUSD is aiming to retest support📊 Technical Analysis
● Price is holding above the rising support trendline and key horizontal support near $3.31, setting up a potential rebound.
● A sustained break above the descending resistance around $4.44 could pave the way for a run toward recent highs near $4.80–$5.00, aligned with the upper channel.
💡 Fundamental Analysis
● SUI’s DeFi ecosystem continues to surge—TVL has topped $2 billion, and institutional interest is growing (e.g., Mill City Ventures’ $450M accumulation and Robinhood listing).
✨ Summary
Long above $3.31; breakout above $4.44 targets $4.80 → $5.00. Invalidation below $3.31.
-------------------
Share your opinion in the comments and support the idea with a like. Thanks for your support!

The path ahead that we expect.Hello friends....
The cryptocurrency Sui has been one of the good cryptocurrencies in the market for the past 2 years, and the reason for this is that it is a viable project.
According to the news from the Federal Reserve last night, the future direction for this cryptocurrency could be as follows.
It is a good place to buy for a step, if it falls, you can buy more in the next steps, because in my opinion it is a cryptocurrency with high potential.
Until the upcoming Alt Season, I will try to share with you the cryptocurrencies that have the most potential for growth, so be sure to follow the page.
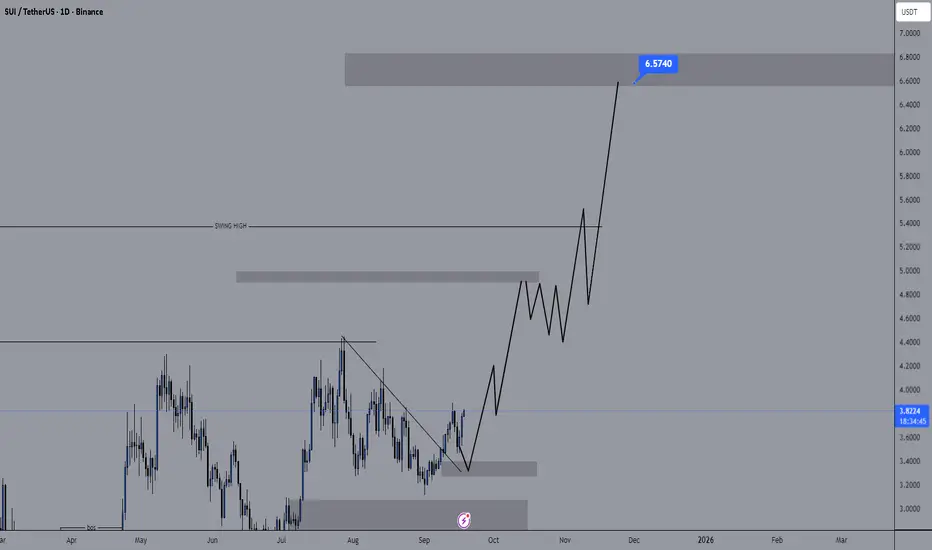
The key is whether it can rise above 3.9509
Hello, fellow traders.
Please "Follow" to always get the latest information quickly.
Have a great day.
-------------------------------------
(SUIUSDT 1D Chart)
Since the HA-High ~ DOM (60) ranges on the 1W and 1D charts partially overlap, a breakout above the 3.9509-4.7328 range is expected to lead to a sharp rise.
Therefore, the 3.9509-4.7328 range is considered a resistance zone.
The HA-Low and HA-High indicators are converging as price movements move.
If this convergence occurs, the converged range, i.e., the HA-Low ~ HA-High range, can be considered a buy zone.
If the price falls below the 2.4495-2.8161 range, trading should be halted and the situation should be monitored.
Currently, the M-Signal indicator on the 1M chart is moving between 2.4495 and 2.8161. Therefore, if the price falls below this level, a stop loss should be considered and a response strategy should be developed.
Based on a basic trading strategy, a buy signal is signaled when support is found in the 2.4495-2.8161 range.
However, if the price falls below the M-Signal indicator on the 1M chart, a downtrend is likely, requiring a response strategy.
-
I mentioned the resistance range as 3.9509-4.7328. However, since the HA-High ~ DOM (60) range on the 1D chart is 3.9509-4.3260, a buy signal can be made when the price finds support within this range and rises.
However, since the buy signal is near the resistance level, a quick and short response is required.
The first sell range is 4.7328-4.96.
-
Thank you for reading to the end.
I wish you successful trading.
--------------------------------------------------

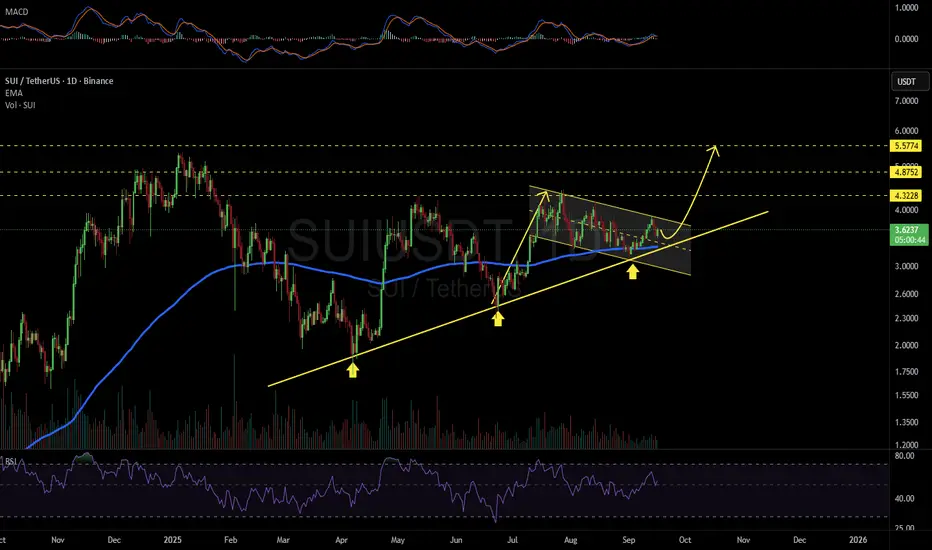
SUIUSDT 1D#SUI is moving within a bullish flag pattern on the daily chart and is currently holding above the flag’s midline and the daily EMA200. If it breaks out above the flag resistance, the potential targets are:
🎯 $4.3228
🎯 $4.8752
🎯 $5.5774
⚠️ Always remember to use a tight stop-loss and follow proper risk management.
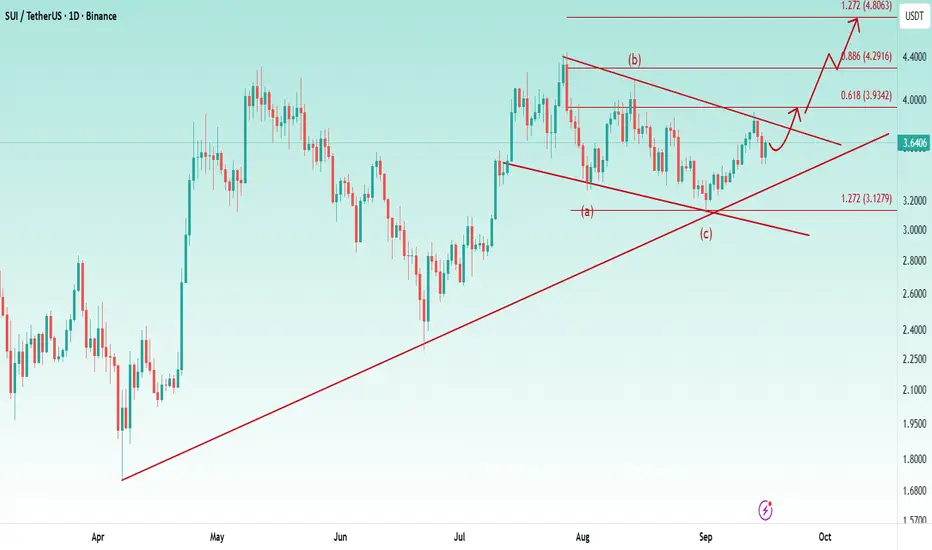
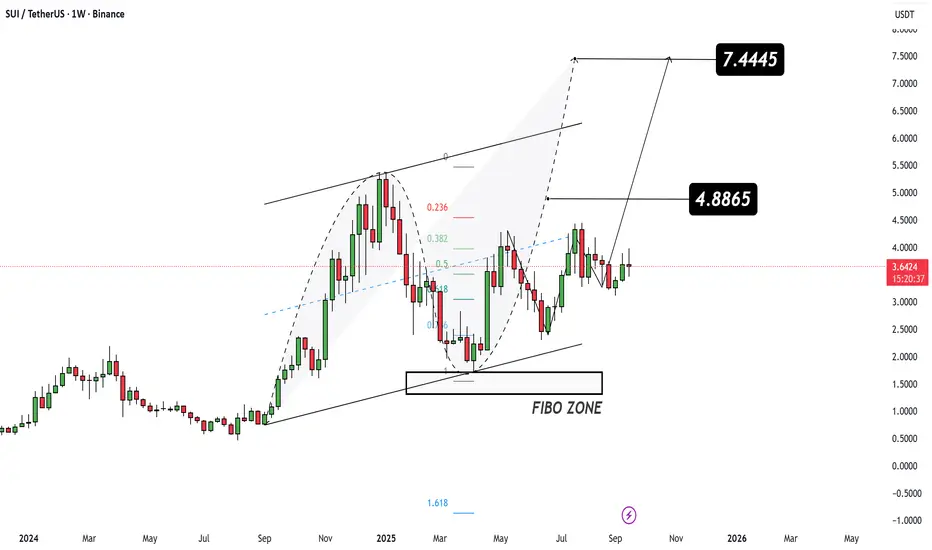
perfect bullish structure formed at the chart 👉 There is a strong bullish structure as the price has perfectly bounced from the 1.272% Fibonacci level and the trendline. A bullish flag is also forming on the chart, and I expect a breakout from this flag soon. Totally the structure is bullish for me
✅ Targets : 3.93$, 4.3$ And 4.8$