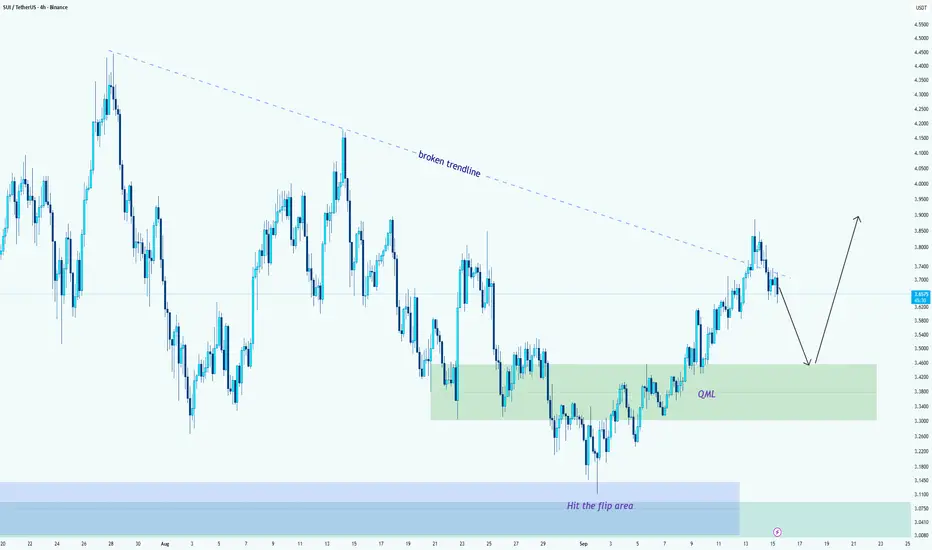
SUI/USDT --> Two-Step Setup: Retest QML, Then RallyHello guys!
Short version first: I expect a pullback to the QML (3.30–3.45), then a bounce that resumes the upside toward 3.80–3.90 (and potentially higher if momentum continues).
Why this makes sense (the plan):
Step 1 --> Pullback to QML:
Price broke the long descending trendline and impulsed higher, but the move is showing a normal two-leg structure: first leg up, now a corrective leg down. The green QML box (3.30–3.45) is the nearby demand zone and the most logical place for buyers to re-enter.
Step 2 --> Bounce & continuation:
If the QML holds and we get a bullish rejection (pinbar, engulfing, clear wick rejection, or a nice bullish close), the most likely path is a continuation back toward the recent supply area — 3.80– 3.90 as the first meaningful resistance. If momentum keeps, extensions toward the next structural highs become possible.
Final note
This is a two-step game: first, the retest, then the real trade. Don’t chase the breakout now; patience at the QML will give a cleaner, higher-reward setup.
Trade ideas
In mid-term I believe this one will pump The chart pattern, combined with the project’s fundamentals and strong social-media sentiment, led me to give this cryptocurrency serious consideration.
I have found a good opinion about it in the midterm.

SUI Wedge BreakoutSui formed a bullish Wedge and it broke out.
If the price established above 3.63, We can expect a bullish move up to 4.4 area.
Stops at 3.07.
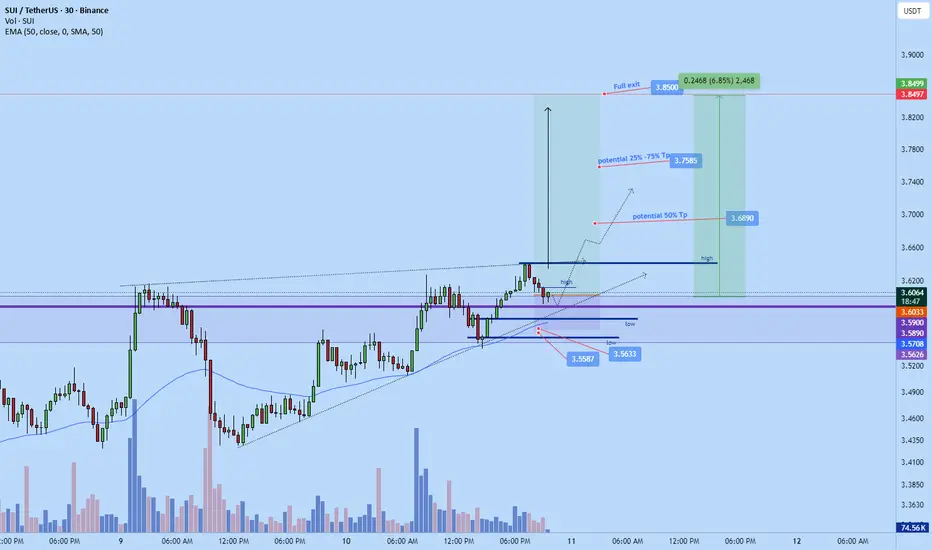
SUI BIG LONG NOW!!!URGENTJust took this sui long a while ago..Might not exactly be ready yet but soon. If we push its likely gonna fly aggressively to $3.85 area
sl: 3.5633 area - $3.5587 or lower . Ideally 3.5385 if conservative
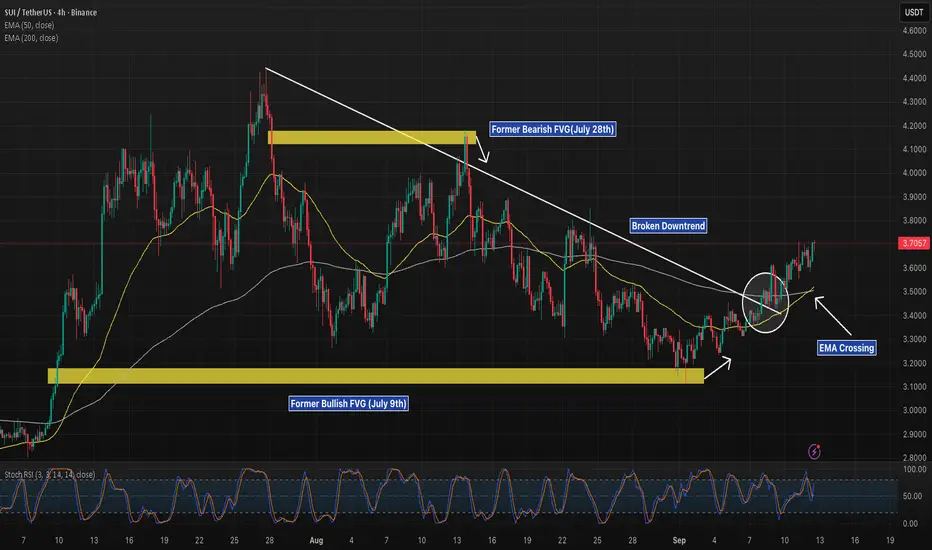
SUI 4H – EMA Cross Attempt After Trendline BreakSUI has broken out of its downtrend line and is now attempting an EMA cross, a potential signal for trend reversal strength.
Upside:
Holding above the EMA cross supports momentum continuation toward the next supply zone.
Confirmation of this cross could drive SUI into a stronger bullish leg.
Downside:
If the EMA cross fails, support lies near the $3.20 demand zone.
Below that, the deeper base of the demand box would be the key defense level.
📊 Key focus: Will the EMA cross confirm and fuel a stronger rally, or will price roll over into demand for a retest?
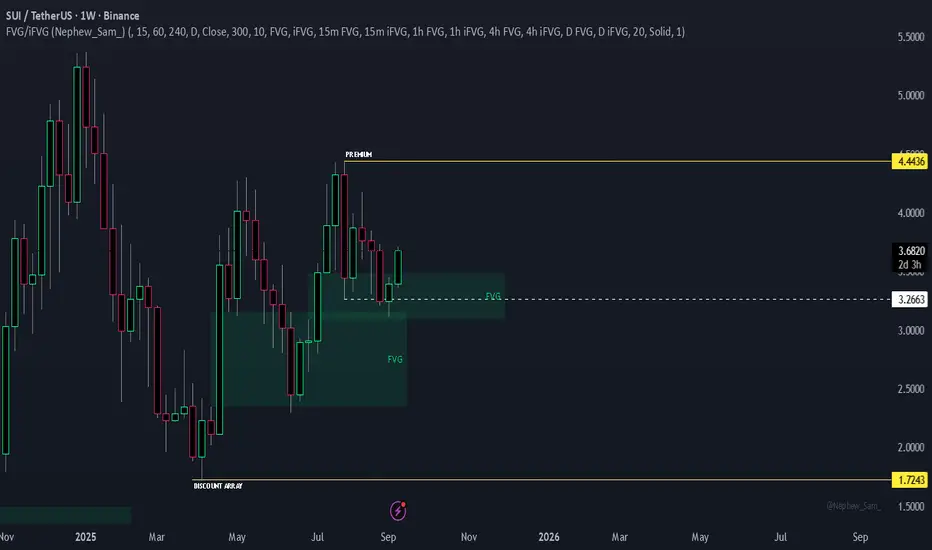
SUI/USDT WEEKLY DISCOUNT ARRAYDISCOUNT ARRAY
Price bounced off a WEEKLY FVG and seems to have found support.
Sweep of origin bar low confirms a possible liquidity grab.
Target PREMIUM.
🚩 Invalidation: You will need to manage your weekly trades on lower time-frames.
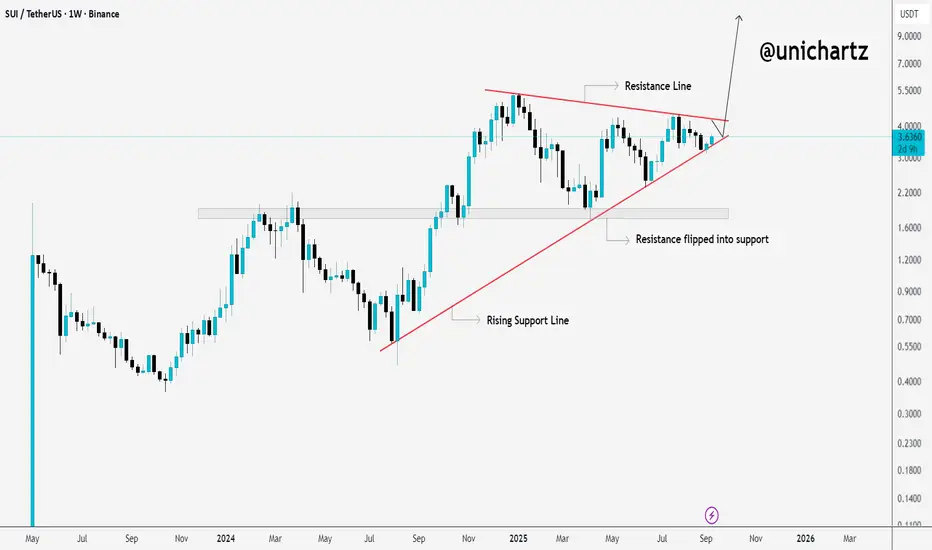
SUI at a Crossroads: Next Move Could Be HugeCRYPTOCAP:SUI has been moving inside a big triangle pattern, with rising support holding the lows and strong resistance capping the highs. Notice how the old resistance around $1.60 has already flipped into support, a healthy sign showing buyers are still in control.
Right now, SUI is sitting at the apex of the triangle. A breakout above resistance could open the door for a sharp move higher, while losing that rising support would mean buyers need to regroup at lower levels.
In simple terms: the squeeze is on, and whichever side breaks, momentum will likely follow fast.
DYOR, NFA
Stay updated everyday follow us on TradingView
#PEACE
SUI Swing Long Opportunity - AltcoinSUI Swing Long Opportunity
📊 Market Sentiment
Market sentiment remains strongly bullish as the FED is expected to deliver a 0.25% rate cut, with speculation building for a possible 0.5% cut in September. Monetary policy shifts are being driven by both inflation trends and weakening labor market data. The latest August and September job reports were soft, signaling that the economy is cooling rapidly. This environment continues to fuel expectations for a major bullish run in the weeks ahead.
📈 Technical Analysis
Price ran the HTF liquidity and bounced from there.
Price tested the HTF key resistance level three times and was rejected, but today it finally broke and closed above the HTF key SR. I expect this level to hold.
Price also broke the bearish trendline that had been controlling the bearish trend since July 27th.
📌 Game Plan
I will be looking to build a long position when we retest the broken HTF Key Level at $3.44.
Possibly, price may also retest the broken trendline, but I won’t be relying on that scenario.
🎯 Setup Trigger
Retest of the broken HTF key level.
📋 Trade Management
Stoploss: $3.34 (below the HTF key level with 2 consecutive 4H candle closures)
Target:
TP: $3.71
💬 Like, follow, and comment if you find this setup valuable!
⚠️ Disclaimer: This content is for informational and educational purposes only and does not constitute financial, investment, or trading advice. Always do your own research before making any financial decisions.

SUI | Watching for Key Resistance Flip — Long Setup BuildingDescription:
Sui (SUI) is shaping up for a potential bullish continuation, with price action currently hovering just below a critical resistance zone. A confirmed break and retest of this level could open the door for a strong upside move.
📍 Trade Setup:
Entry Zone: $3.40 – $3.60
Stop Loss: Just below $3.30
Take Profit Targets:
TP1: $4.00 – $4.20
TP2: $5.00 – $5.20
This setup is built around a support-to-resistance flip. If bulls can reclaim the overhead resistance and turn it into a base, it could confirm bullish momentum continuation.
#SUI #Crypto #Altcoins #SwingTrade #TechnicalAnalysis #TradingSetup

Sui (SUI): Expecting 200% Market price Movement Very SoonSUI has a sleeper setup, which can give us potentially 200% of movement very, very soon. We are in a bullish trend so expecting a bounce from here.
More in-depth info is in the video—enjoy!
Swallow Academy

#SUI/USDT → Resistance breakout and entry into the buying zone#SUI
The price is moving within a descending channel on the 1-hour frame, adhering well to it, and is heading for a strong breakout and retest.
We have a bearish trend on the RSI indicator that is about to be broken and retested, which supports the upward breakout.
There is a major support area in green at 3.14, which represents a strong support point.
For inquiries, please leave a comment.
We are in a consolidation trend above the 100 Moving Average.
Entry price: 3.29
First target: 3.38
Second target: 3.51
Third target: 3.67
Don't forget a simple matter: capital management.
When you reach the first target, save some money and then change your stop-loss order to an entry order.
For inquiries, please leave a comment.
Thank you.

$sui long well playedCRYPTOCAP:SUI jumped exactly from our entry and good 17% profit if you entered long with leverage then congratulations for listening to my call.
Taking partial profits here.

SUIUSDTThe chart is on best support but I not see confirmation candle or volume of buy for entry.
Next level is for best support is 2.91$. I think the price will touch this level with a shadow. What are you think?

$SUI: my green zones are back. Time to refill our bags.CRYPTOCAP:SUI is showing strong momentum, but the current consolidation could be forming an M-pattern — a bearish setup that might push the price down into my green box buy zone.
A bounce from this area has historically delivered solid profits, and the setup looks similar to previous cycles where we saw strong recoveries.
This pattern isn’t unique to CRYPTOCAP:SUI — it’s part of a broader market structure we’re seeing across many altcoins, suggesting a shared macro setup that could present multiple buying opportunities.
------------------------------
The altcoin market just saw a solid pump, following the massive CRYPTOCAP:BTC and CRYPTOCAP:ETH institutional billion-dollar purchases.
On the Daily timeframe, we’re actually printing higher lows, showing clear market strength. The top of the range was rejected, and now it’s highly probable that the crypto market will enter a consolidation phase — a move that could push several altcoins into my buying zones.
💡 Reminder: My buying zones are areas where it’s statistically safer to buy and hold, with an almost guaranteed chance of making a solid profit on the next bounce.
What could spark the infamous Altseason?
Many altcoins share one thing in common: a major resistance line (marked in yellow). For them to pump to the moon, this line needs to be broken.
We’re also seeing a price compression — meaning the breakout could be imminent. This pullback might be your last chance to enter a long position before the real Altseason kicks off.
Possible Altseason catalysts:
📉 FED Interest Rate Cut of 1% or more.
📈 Institutional adoption through altcoin index ETFs — imagine BlackRock launching ALT10, ALT50, ALT100 ETFs, attracting massive institutional money into the altcoin market.
I believe both events could happen before the end of the year.
DYOR — but the window might be closing fast. 🚀

SUI/USDT Too late?Have we missed the boat? Is this a fake run before a real push?
My markup on the chart may act as a the true DISCOUNT ARRAY for a potential move higher.
🚩 Invalidation: If the Daily FVG breaks with a clear breakaway candle, this setup is void.

Some added TA of the TA before. SUI bullishLooks like a cup and handle playing out. All with all, SUI looks like its going to make a nice run. Last low is support, Should not go lower than that

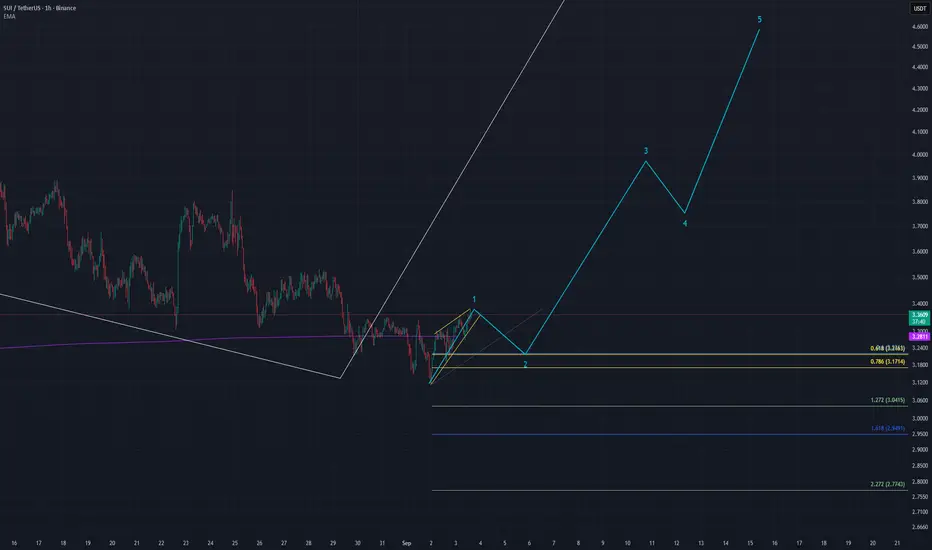
SUI 650% trade coming up??5 waves up, now correcting. I think it will bounce from the 2.42 area. Nice 650%
Now tring to count 5 waves down for the wave C.
I also see it could bounce from the 0.5 fib and make a cup and handle, but the cup isnt that round. So yeah 2.42 would be my buy zone.

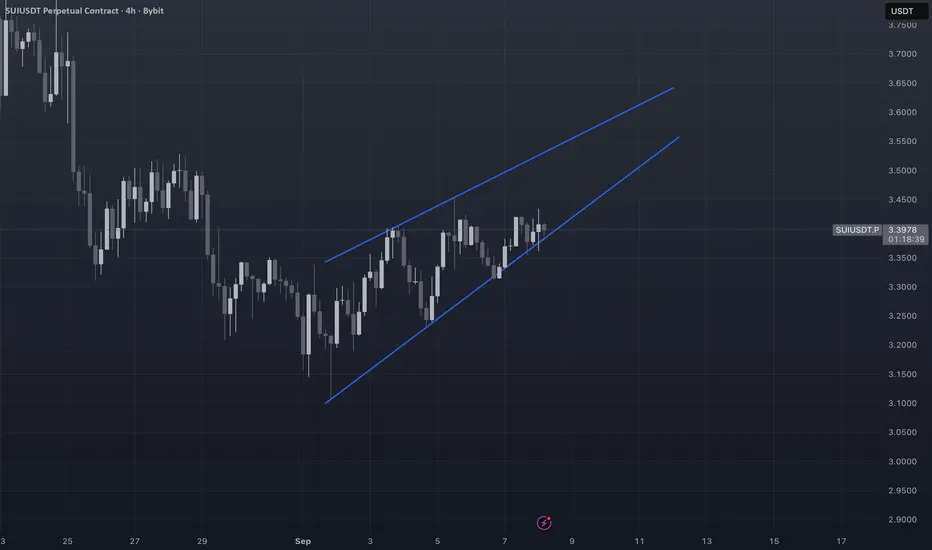
sui Long to $3.4565 tonightJust opened a long on Sui. Aiming for $3.4565. Roughly 2RR
Sl: 3.35 area
Time sensitive

Sui Another bearish pattern on the 4hr ChartSui on the 4hr chart if candle close below the pattern its bearish and be a good opportunity to short keeping an eye on this one too
Sui (SUI): Either We See Huge Drop or Huge Pump | 200EMA is KeySui is back near the 200EMA, where last time we had a strong rejection and movement to lower zones, which would have been an amazing entry for short.
So this time we will not miss the big move; we are looking either for a proper MSB to form to enter a short position here or a proper break of local high (BOS), which would give us a good opportunity for a long.
Swallow Academy

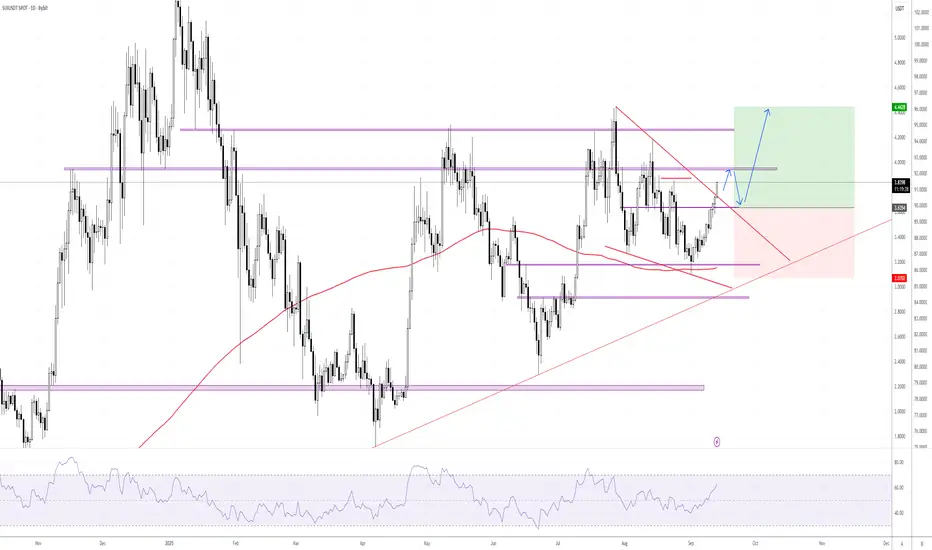
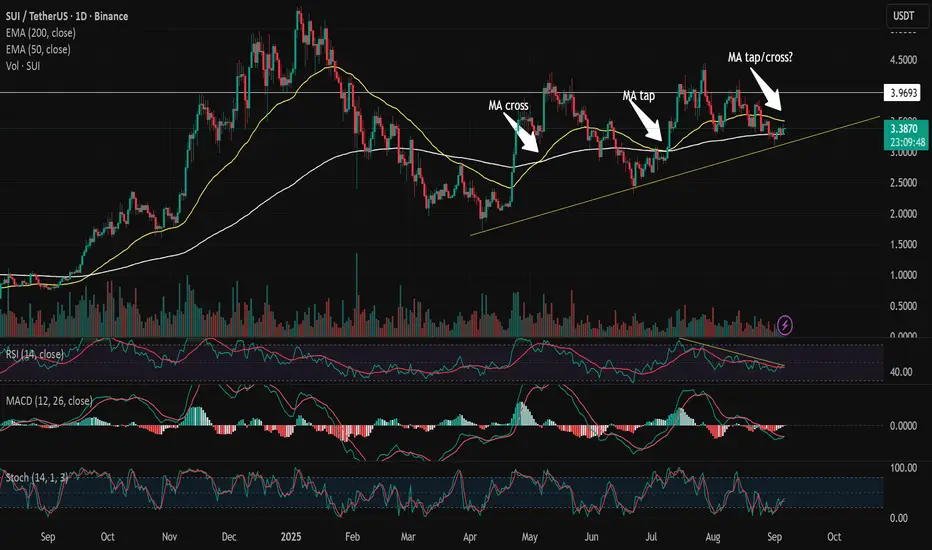
SUI Technical Setup – Bullish Structure, Bearish Momentum🟢 Trend & Structure
Since April, SUI has been respecting a clear upward support trendline, tapped 3 times and holding firmly. This validates the bullish structure and sets the stage for a potential ascending triangle pattern, with higher lows pressing against the $3.9 resistance zone.
Ascending triangles are typically continuation patterns, but they require volume expansion to confirm. Without that, they can just as easily break down.
📉 Moving Averages (MAs)
In May, we saw a golden cross (50 EMA crossing above 200 EMA) which shifted the broader bias to bullish.
In July, price retested the 200 EMA successfully, respecting long-term support.
Today, SUI trades above the 200 EMA (~$3.28) but remains below the 50 EMA (~$3.49).
This creates a squeeze zone between the two averages. A decisive move out of this range will set the next direction.
📊 Indicators
RSI (14): Currently around 44, sitting below 50. This shows bearish momentum bias, though not in oversold territory.
MACD: Both lines are below zero, histogram is red but fading. This hints at a potential bullish crossover, but not confirmed yet.
Stochastic: Rising from oversold levels but still in the bearish half of the range. Needs to break above 50 to show strength.
Overall, indicators lean bearish-to-neutral, with some early signs of possible reversal.
🔉 Volume Profile
Volume has been declining steadily since July, showing weakening demand. For any breakout above $3.9 to hold, we would need to see a clear surge in buying volume.
🎯 Key Levels to Watch
Support:
$3.28 (200 EMA).
If broken, downside targets $2.76 (Fib 0.618 golden ratio) as the next logical support.
Resistance:
$3.70 (Fib 0.236).
$3.90–$4.00 horizontal zone. A clean breakout above this on strong volume would confirm the ascending triangle pattern and likely extend the uptrend.
⚠️ Fundamental Catalyst – Token Unlock
On October 1st, 2025, 44M SUI tokens will be unlocked. Unlocks increase circulating supply and often add short-term selling pressure. Combined with SUI trading near key support/resistance levels, this event could act as the catalyst for a decisive move — either breaking down support or fueling a breakout if demand absorbs supply.
📈 Outlook & Scenarios
At this stage, SUI’s chart shows mixed signals:
Bullish case: If price continues to hold above the 200 EMA and demand returns, an attempt toward $3.7–$3.9 resistance is likely. A breakout above $3.9 would confirm continuation of the uptrend.
Bearish case: If $3.28 fails, a retrace toward the $2.76 Fib support becomes the higher-probability path.
Bottom Line:
SUI is at a decision point. Structure is bullish, but indicators lean bearish, and volume is weak. The October 1st unlock may be the trigger that decides whether this ascending triangle plays out to the upside or breaks down toward deeper support.
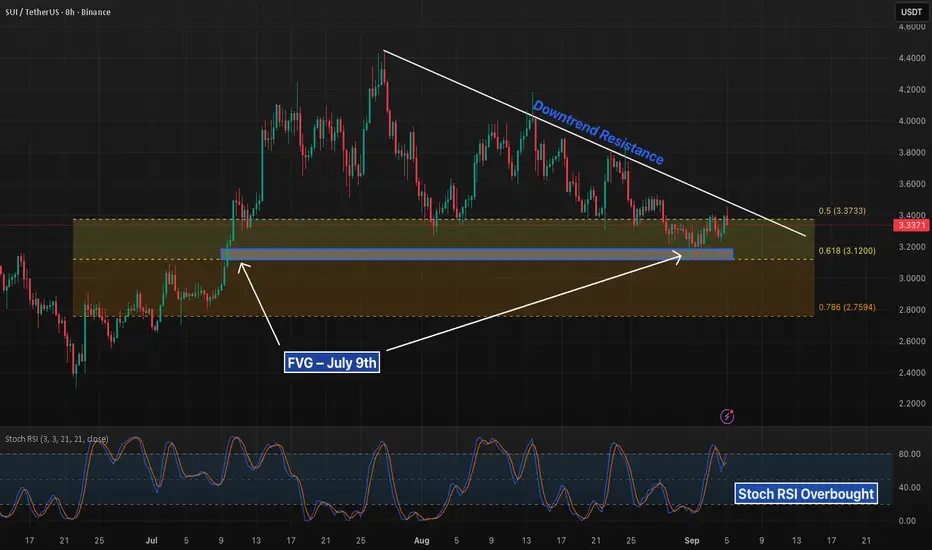
SUI 8H – Testing Downtrend Resistance, FVG from July in PlaySUI is retesting the descending trendline while sitting just under the 0.5 retracement at 3.37. The July 9th FVG sits mid-structure and has been partially filled on this recent bounce.
The golden pocket (3.37–3.12) remains the key zone. A breakout above trendline resistance would confirm strength, opening continuation toward higher levels. Failure to hold above 3.12 shifts focus to 2.76 at the 0.786 retracement.
Stoch RSI is stretched into overbought territory, suggesting caution as price presses into resistance.
SUI bottom formedSui occuration making leading diagonal. If bottom is formed we can hunt pull back at 0.5 of 0.6 fibonacci level. Also Sui close candlestick above 200 Daily ema.
If Sui retest and find support on this level we can see bigger move elliot wave 3.
Targets 4.1 and above ATH. I think its good way to DCA and wait for confirmation.