SUI Setup – Support Zone Long OpportunitySUI, with its smaller market cap compared to majors like ETH, BTC, and SOL, remains more sensitive to market swings. Price has now retraced into a key support zone, offering a potential long entry for the next upside leg.
Trade Setup:
• Entry Zone: $3.40 – $3.60
• Take Profit Targets:
🥇 $4.00 – $4.20
🥈 $5.00 – $5.20
• Stop Loss: $2.90
Trade ideas

SUI 8H – Resistance Rejection, Pullback Incoming?SUI’s 8H chart shows rejection from the $4.35–$4.45 resistance zone, with price now consolidating just below $3.80. A pullback toward $3.55–$3.65 remains possible before testing trendline support near $3.05. Stoch RSI sits in the upper range, hinting at limited upside momentum in the short term unless buyers step back in. A reclaim above $4.00 would keep pressure on the major resistance.

Sui (SUI): Still Above 200EMA | Bullish As Long We Stay AboveSUI had a quick long squeeze where buys quickly bought the dip. As we are still above the 200 EMA, we are bullish and looking for price to move at least toward$4.40.
Markets are expanding currently and quick dips like that are normal in the markets so we are going to look for a buy entry near the EMA once we see proper MSB either on the 30M timeframe or the 5M timeframe.
Swallow Academy

Lingrid | SUIUSDT Expansion Trade OpportunityBINANCE:SUIUSDT is rebounding from the breakout point after holding above the 3.70 support zone. Price action is moving within an upward channel, supported by higher lows and recent breakout momentum. As long as 3.70 holds, buyers may attempt a move toward the 4.80 resistance area. Momentum remains aligned with the broader bullish structure targeting the channel’s upper boundary.
📉 Key Levels
Buy trigger: Break above 4.44
Buy zone: 3.70–3.80
Target: 4.80
Invalidation: Below 3.50
💡 Risks
Failure to sustain above 3.70 could trigger deeper retracement.
Rejection at 4.40 resistance may stall momentum.
Broader market weakness impacting altcoin sentiment.
If this idea resonates with you or you have your own opinion, traders, hit the comments. I’m excited to read your thoughts!

Buy Trade Strategy for SUI: Leveraging High-Speed BlockchainDescription:
This trading idea focuses on SUI, a next-generation Layer-1 blockchain designed for exceptional scalability and low-latency transactions. Developed by Mysten Labs, SUI utilizes a unique parallel execution engine that significantly boosts transaction throughput, making it highly competitive in the evolving blockchain ecosystem. Its innovative architecture supports complex decentralized applications (dApps) and Web3 experiences, attracting developers and investors seeking high-performance solutions. With growing adoption, strategic partnerships, and strong community support, SUI shows potential for long-term value within the blockchain industry.
Nevertheless, the cryptocurrency market is highly volatile, and factors such as regulatory changes, market sentiment, and technological shifts can rapidly affect asset prices. As with any investment in digital assets, proper risk management and careful evaluation are essential.
Disclaimer:
This trading idea is provided for educational purposes only and should not be taken as financial advice. Investing in cryptocurrencies like SUI involves substantial risk, including the potential loss of your entire capital. Always conduct your own research, consider your financial circumstances, and seek guidance from a professional advisor before making investment decisions. Past performance is not indicative of future results.

SUIUSDT Outlook This Weeklet see what happend on SUI this week will sui make a new swing high or respected the FGV/OB
SUI to $5?COINBASE:SUIUSD looks strong. If you could enter anywhere between $3.6 - 3.75, it could offer a good return in a few weeks.

08/12/25 KASPA SCALPKaspa’s doing the crypto moonwalk — two steps forward, one step back — while eyeing that shiny 0.099 like it’s the last donut in the box. Price just ran a marathon from the lows, took a water break around 0.0978, and is stretching before the final sprint. If the bulls keep their sneakers laced, we might see 0.099 before they even realize they’re out of breath. But beware… there’s a lurking bear at 0.099 with a ‘No Entry’ sign and a big stick

DO YOU THINK SUI WILL HIT 10$ THIS YEAR TOO?SUBSCRIBE, BOOST AND COMMENT IN ORDER TO GET HIGH QUALITY TECHNICAL ANALYSIS.
Firstly, our Algo-based indicators are used to create this analysis.
The technical analysis of SUI are showing that the price is moved in our Market Cycle Orderflow indicator to the Pump zone. After successful Retest, it's now starting to Rise. So you didn't miss anything else yet.

Weekly trading plan for SUIAt the moment, SUI has broken above the weekly pivot point — we now need to wait for price confirmation.
In any case, as long as the price stays above the 3.63–3.57 support zone, there’s a chance to reach the resistance zone.
If this support breaks, I expect a move down toward the next support area.

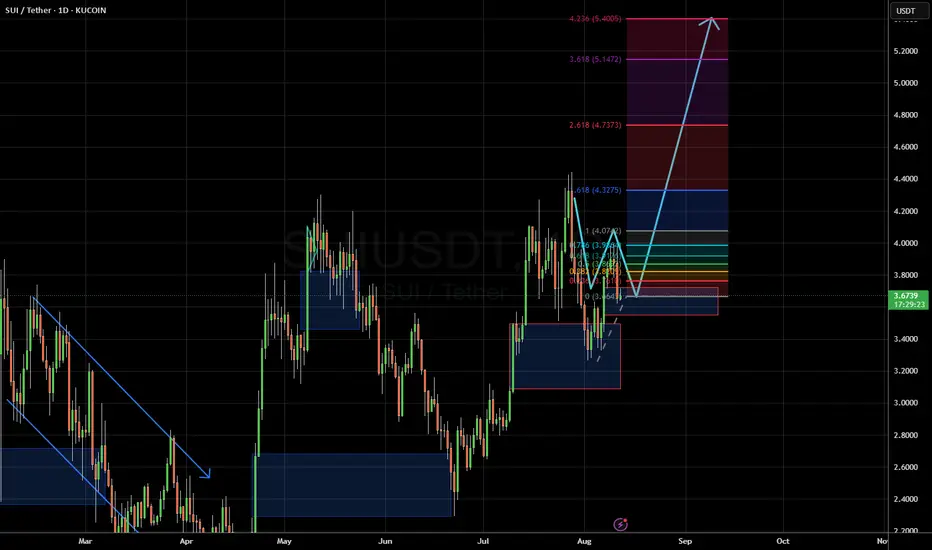
SUI/USDT Technical Analysis: Bullish Momentum
Based on the provided chart of SUI/USDT on KuCoin, here's a technical analysis:
The chart indicates a potential bullish trend reversal following a period of consolidation. The price has recently broken out of a downward channel, and after a retest of the support level, it appears to be building momentum for an upward move.
Technical Observations
Fibonacci Retracement: The chart utilizes Fibonacci retracement to identify potential price targets. The current price action is showing a strong move from a local low, suggesting a target of $4.3275 (1.618 Fibonacci extension) and potentially higher.
Support and Resistance: The price found strong support around the $3.20 level and has now broken above a key resistance area near $3.80. A sustained move above this level could confirm the bullish sentiment. The next significant resistance levels are at $4.3275, $4.7373, and $5.1472, which correspond to the Fibonacci extension levels.
Market Structure: The chart shows a series of higher highs and higher lows since the end of July, which is a classic bullish market structure. The current candle is a strong bullish one, reinforcing the idea of an ongoing uptrend. The target for this move could extend up to the previous all-time high area, as indicated by the arrows.
Volume: While not explicitly detailed, the chart suggests that the recent price increase is accompanied by a decent amount of volume, which adds to the credibility of the move.
Trading Strategy & Outlook
The analysis suggests a long-term bullish outlook for SUI. The key is for the price to remain above the new support level, which was previously a resistance zone. A potential strategy would be to enter a long position with a stop-loss order placed below the recent swing low or a significant support level. The profit targets could be set at the various Fibonacci extension levels.
It is important for traders to use proper risk management techniques and to be aware that this is a technical analysis and is not financial advice.
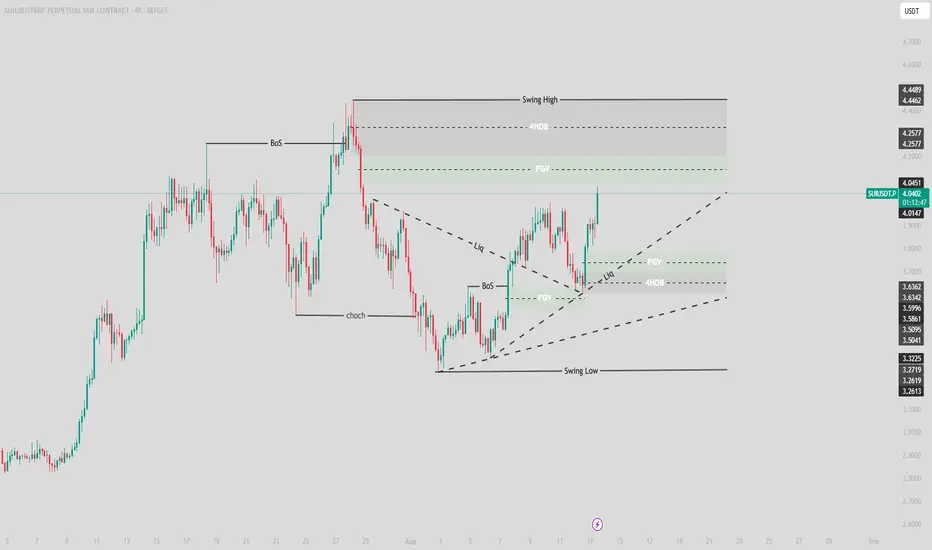
SUI | SUI Network Swing Long IdeaSUI | Swing Long Idea
📊 Market Sentiment
Overall sentiment remains bullish, supported by expectations of a 0.25% rate cut in the upcoming FOMC meeting. A weakening USD and increased risk appetite across global markets are creating favorable conditions for further upside in crypto assets.
However, tomorrow’s CPI data is a key risk event for markets. It will be released at 08:30 AM NY local time, and could cause notable volatility across risk assets.
📈 Technical Analysis
Price began a retracement after a strong bullish expansion.
The move deepened following a break of the bullish trendline.
Price bounced from the Weekly Fair Value Gap (W-FVG) and retested the broken trendline, only to face rejection again.
This suggests price may still want to head lower to collect liquidity before continuing higher.
📌 Game Plan
Primary watch level: Daily demand zone (blue box) at $3.53.
This level could be enough to spark continuation higher, but ideally I’d like to see the 4H swing liquidity at $3.44 taken out first to strengthen the setup.
🎯 Setup Trigger
Wait for a 4H break of structure after the game plan levels are met.
📋 Trade Management
Stoploss: 4H swing low that caused the break of structure
Targets:
TP1: $3.81
TP2: $4.00
TP3: $4.44
Will trail stops aggressively to secure profits as the trade moves in my favor.
💬 Like, follow, and comment if this breakdown supports your trading! More setups and market insights coming soon — stay connected!
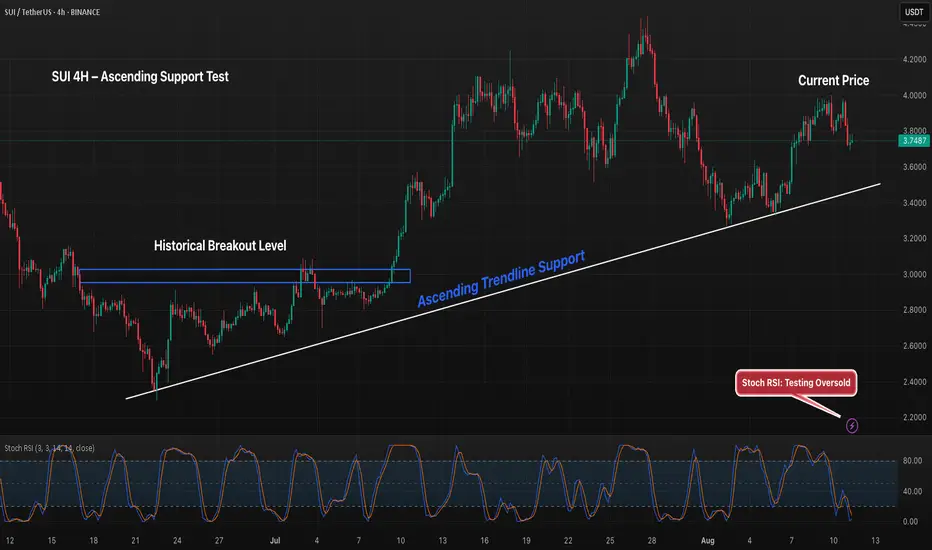
SUI 4H – Approaching Trendline Support, Bounce or Breakdown?SUI is consolidating near $3.75 and remains above a well-defined ascending trendline from June lows. Price previously broke out from the $3.15–$3.20 zone, which now aligns with secondary support. Stoch RSI is near oversold territory, suggesting buyers may step in soon. A rebound from trendline support could target $4.00+, while a breakdown risks a retest of the $3.20 zone.
SUIUSDT BuyPrice has broken structure to the upside (MSS 4H) after an impulsive rally. Liquidity sits above recent highs, with a bullish order block below as a potential retracement zone. Plan is to wait for price to mitigate the OB at price of 3.5249.

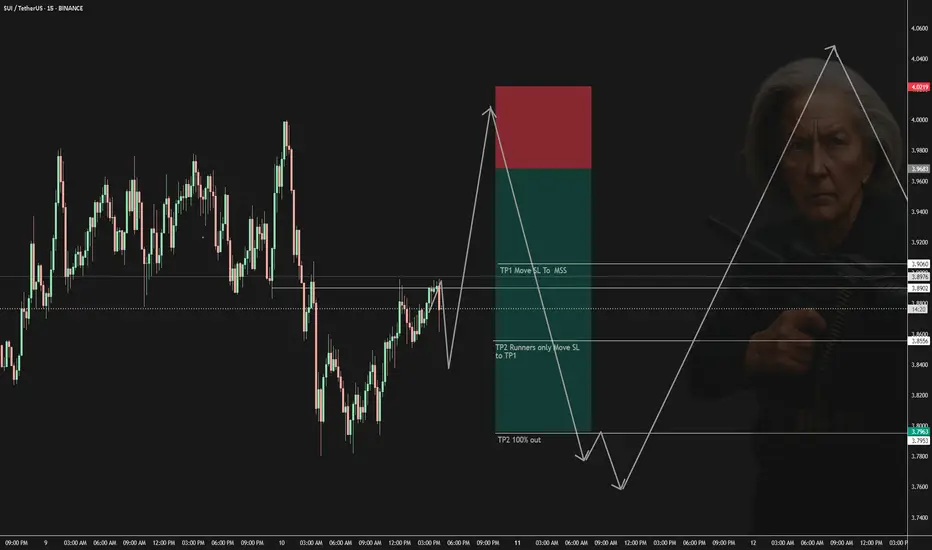
08/10-08/12/25 SUI SHORTCould go lower at first but will end up grabbing liquidity higher, form SMT, then entry model, then targets hit as chart shows.
Trigger:
A wick into $3.95–$4.00
Targets:
TP1: $3.90 (minor intraday support)
TP2: $3.85 (recent local low)
TP3: $3.78 (major 1H structure low)
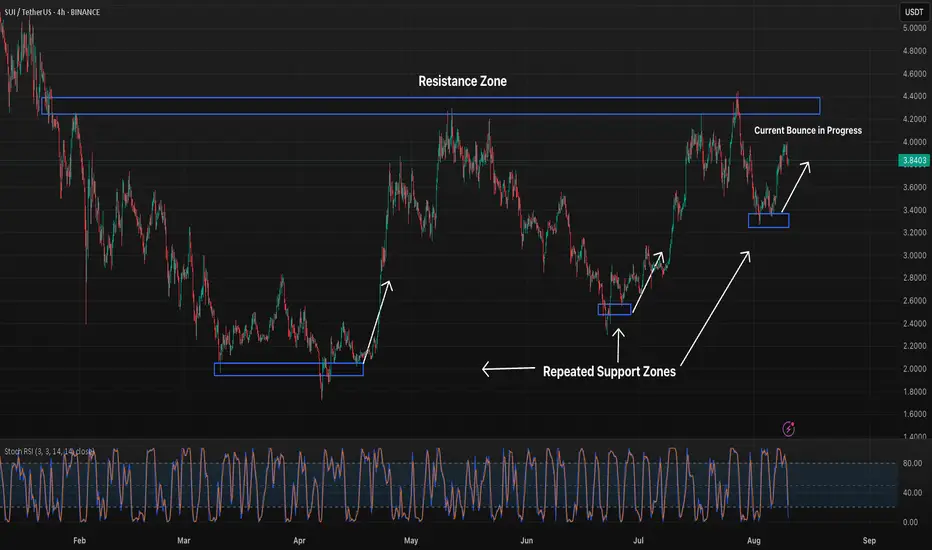
SUI 4H Bounces Again, Eyeing Key Resistance ZoneSUI has repeatedly found strong buying interest at the same support level, each time leading to a sharp rally. Price is once again bouncing from this zone, with momentum building toward the $4.20–$4.40 resistance area. A breakout above this zone would mark the first higher high since July, while rejection could keep price range-bound.
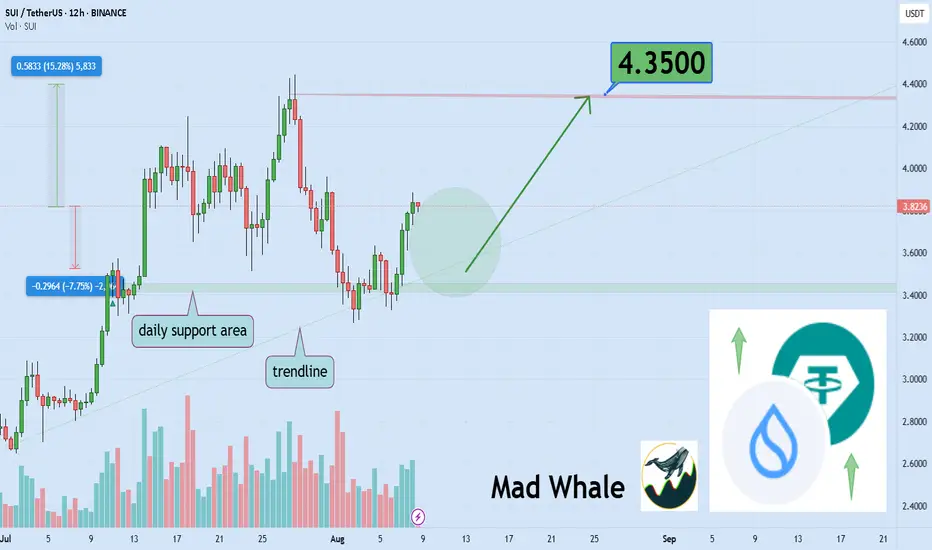
SUI Holds Final Support, Eyes 15% Rally Toward $4.35Hello✌️
Let’s analyze SUI’s price action both technically and fundamentally 📈.
🔍Fundamental analysis:
The SEC is looking at two SUI ETF proposals, with a decision expected by Jan 2026. Big banks and funds are getting involved, which could impact supply and demand.
📊Technical analysis:
BINANCE:SUIUSDT has lost all major Fibonacci supports, with daily support and trendline as final defenses 📉. If these hold and volume remains stable, a 15% rally toward \$4.35 is likely 🚀.
✨We put love into every post!
Your support inspires us 💛 Drop a comment we’d love to hear from you! Thanks, Mad Whale
SUI – Ready to Drop from the $3.96 Supply WallSUI has rallied right into a key confluence area — the strong supply zone & bearish order block at $3.90–$4.00, which also aligns perfectly with the descending channel’s upper boundary.
📌 Bearish Scenario (preferred):
If price shows rejection at this zone and breaks below $3.85, a corrective move toward $3.55–$3.60 is highly probable, with potential extension toward $3.35 demand zone.
📌 Invalidation:
A 4H candle close above $4.05 would invalidate the short setup and open the door for a continuation toward $4.25+.
💡 Note: Confluence of channel resistance + supply OB + psychological $4 level makes this a high-probability short area. Watch for lower-timeframe BOS or liquidity sweep before entering.

SUI/USDTTesting/tracking Elliot wave.
SUI/USDT weekly chart
Sui might be in this super cycle wave. Possible wave 3 top is around $20
Sub cycle wave top is at $8
Pullbacks are on the chart and I’ve tried to place them where I think it’ll happen. While Elliot waves cannot tell you when price targets will hit, I’ve lined them up to market cycles of potential corrections.

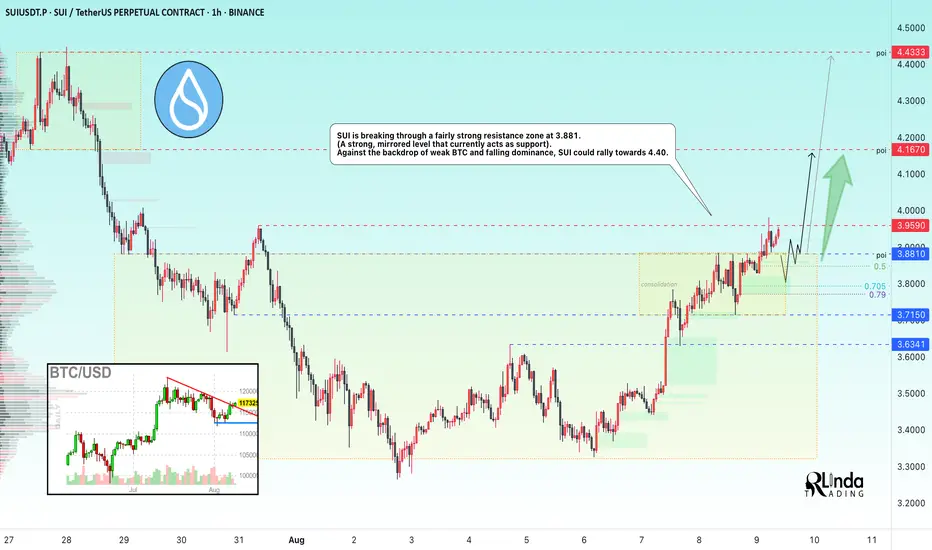
SUIUSDT → Resistance breakout and entry into the buying zoneBINANCE:SUIUSDT is breaking out of its trading range and local consolidation upward. Consolidation above the mirror level could trigger a continuation of the rally to 4.4 - 5.0.
Bitcoin has been trading in the red since the start of Saturday's session, but is gradually recovering. At this time, the altcoin market is rallying, while the Bitcoin dominance index is updating its decline
As for SUI, the coin is in a bullish trend both locally and globally, but ahead lies the 4.45 barrier, which separates the price from a rally to ATH. The coin is breaking through a fairly strong resistance zone at 3.881. (A strong, mirror level, which currently acts as support).
Resistance levels: 3.959, 4.167
Support levels: 3.881, 3.715
Since the price has entered the buying zone, there is a possibility of a retest of the mirror level and the liquidity zone that has formed below the specified support. If the bulls hold their defense above 3.88 - 3.9, then in the short and medium term, the price could show good growth...
Best regards, R. Linda!
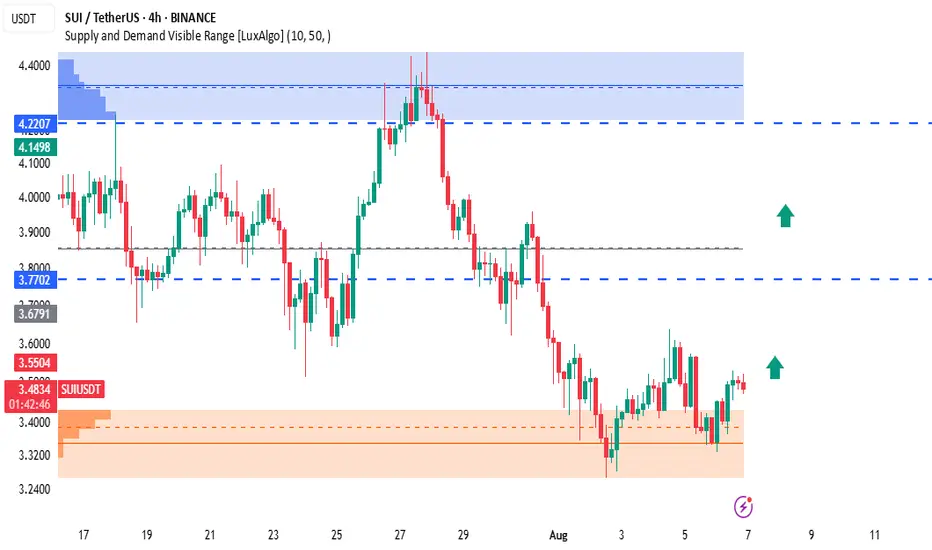
SUI/USDT Bullish Setup – Strong Rejection from Demand Zone!SUI is showing early bullish momentum after rebounding from a solid demand zone between $3.24 – $3.40. Buyers are defending this zone strongly, and price is now forming a higher low on the 4H timeframe, signaling potential upside continuation.
🔍 Technical Breakdown:
Demand Zone (Support): $3.24 – $3.40 (Highlighted in orange)
Current Price: $3.48 (Trading slightly above demand zone, showing bullish structure)
First Resistance (TP1): $3.7702 (prior support turned resistance)
Final Target (TP2): $4.1498 – $4.22 (major supply zone with historical selling pressure)
✅ Bullish Confluences:
Price formed double bottom at the demand zone
Bullish candle structure building up
Visible volume cluster supports bounce (LuxAlgo VRVP)
Clear upside imbalance toward $4.22
📌 Trade Setup:
If price continues to hold above $3.40 and breaks recent highs:
Entry: $3.45 – $3.50 (current breakout range)
SL: Below $3.24 (beneath the demand zone)
TP1: $3.7702
TP2: $4.1498
TP3 (extended target): $4.2207
🧠 Notes:
Watch for breakout above $3.55 for stronger momentum confirmation
Scaling out partially at $3.77 is wise due to previous resistance
Supply zone at $4.22 is a critical decision point
🟢 Bias: Bullish until $3.24 is broken
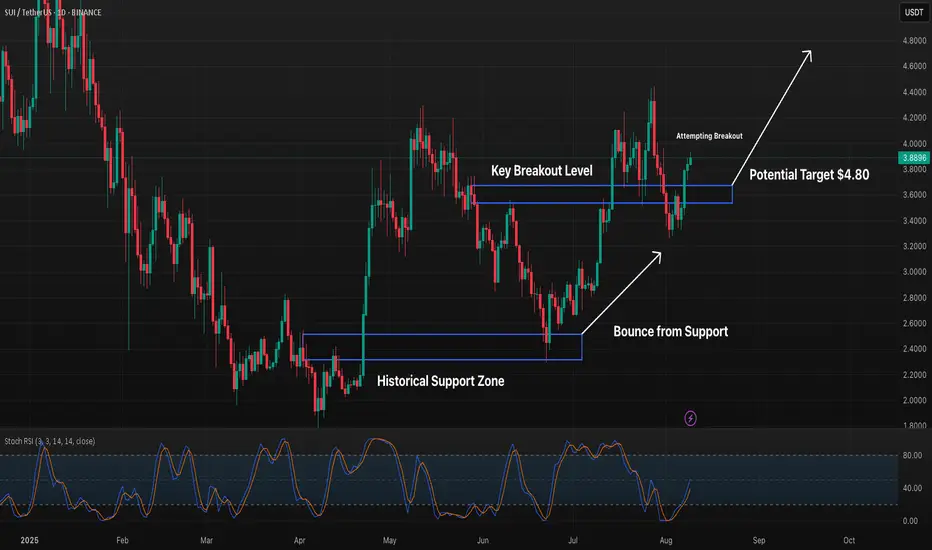
SUI 1D Breakout Attempt in PlaySUI has bounced strongly from its historical support zone, reclaiming the key breakout level near 3.75. Bulls are now pressing higher, aiming for the next major target around 4.80. A confirmed close above the breakout level would strengthen the bullish case, while failure to hold could see price revisit support in the 3.40–3.20 range. Momentum is improving, but follow-through is critical.
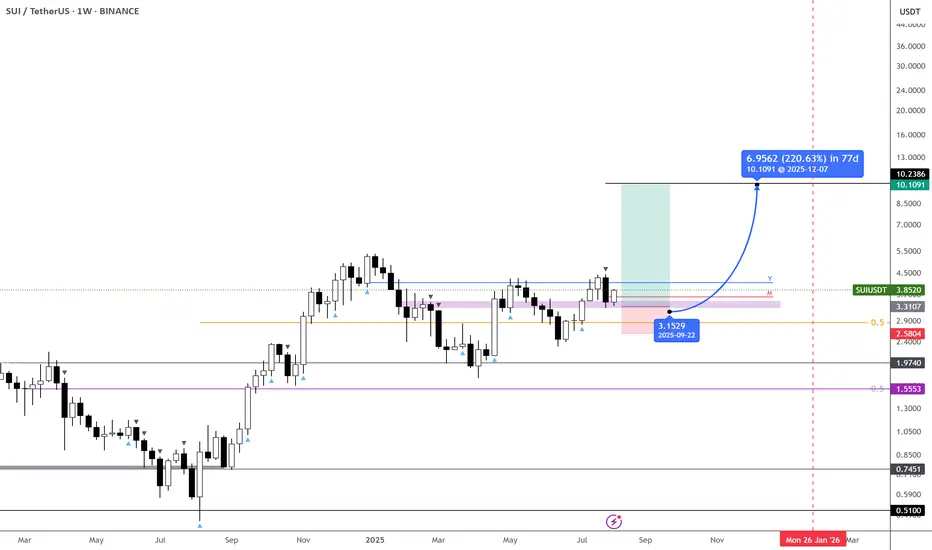
Long Signal on $SUI - $10 incoming?Sure, it’s been lagging compared to some other caps—but we finally have a strong monthly signal.
Constructive price action above the $3.30 pivotal zone makes this one a lot more appealing. It’s also setting up for a third attempt at $4, the last major level before a new ATH. Once this supply zone is cleared, the path toward double digits opens up.
Overall, BINANCE:SUIUSDT is one to keep on the list if you’re looking to play it a bit less aggressively over the coming months.