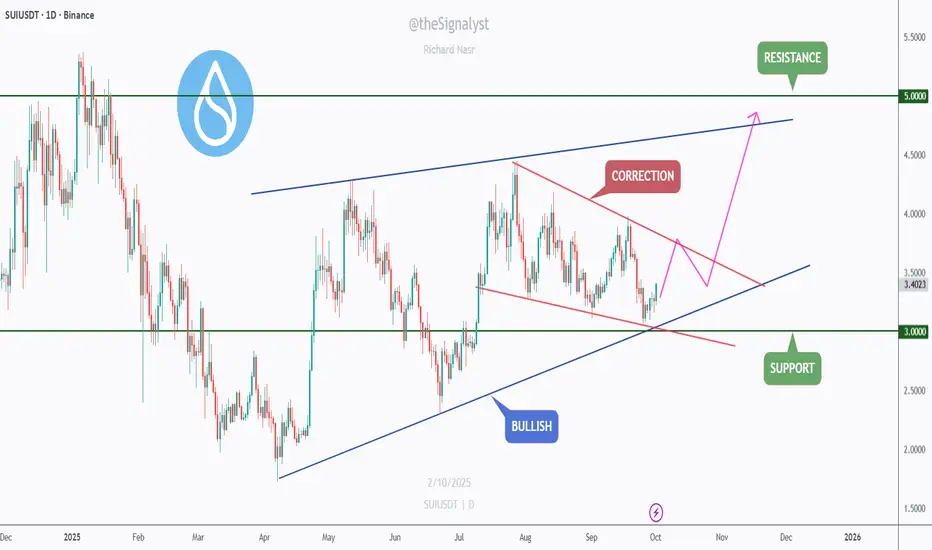
$SUI - Correction within an Uptrend: Eyes on $3.0 → $5.0SUI is respecting a broader rising structure while carving a descending correction (red channel/wedge) on the daily.
Price just bounced from the trendline + $3.00 support, a clean confluence area where bulls typically reload.
Trend context: Macro higher-lows intact (bullish). Micro still correctiv
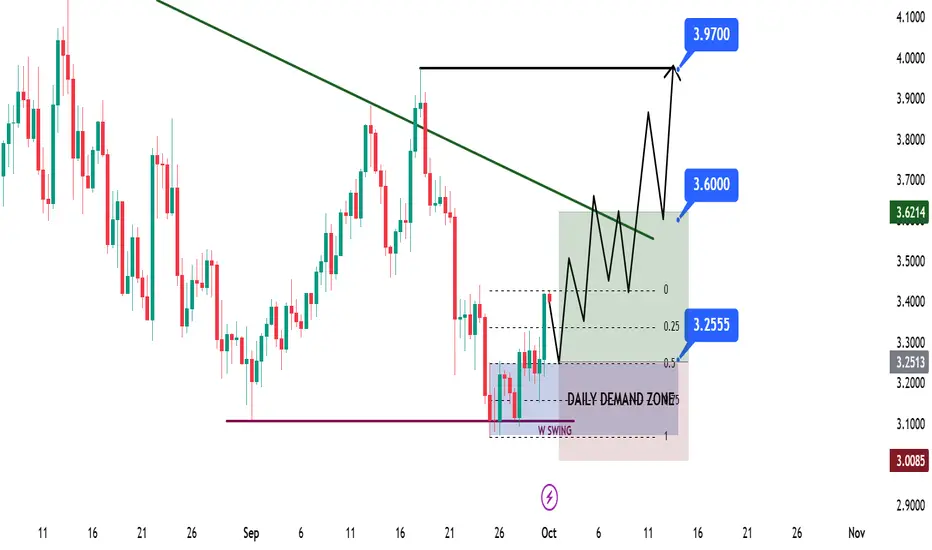
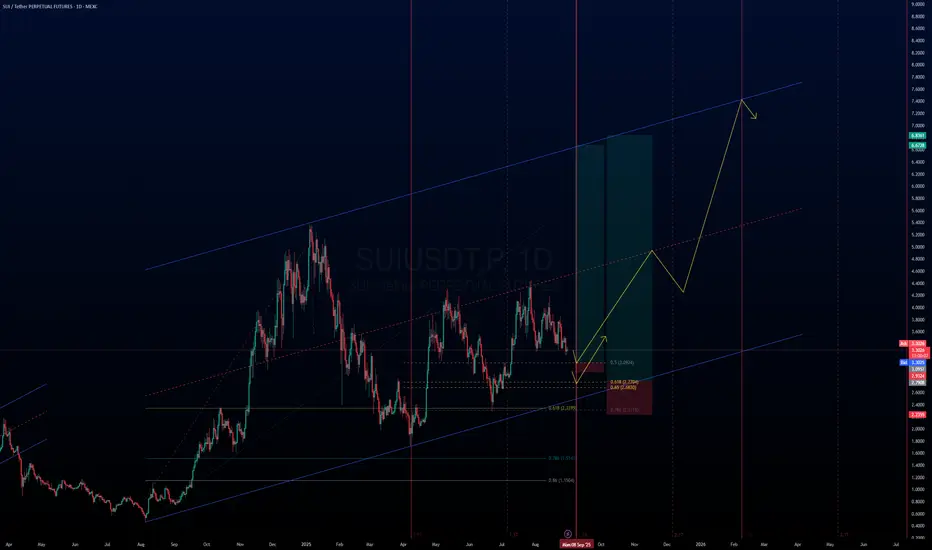
SUI Swing Long Opportunity - HDDZ Model SUI Swing Long Opportunity – HTF Demand w/ Discount Zone (HDDZ Model)
📊 Market Sentiment
FED has resumed its rate-cutting cycle, starting with a 0.25% cut in September, with two more expected. Institutional liquidity inflows have accelerated as the U.S. officially adopts crypto as part of its reser
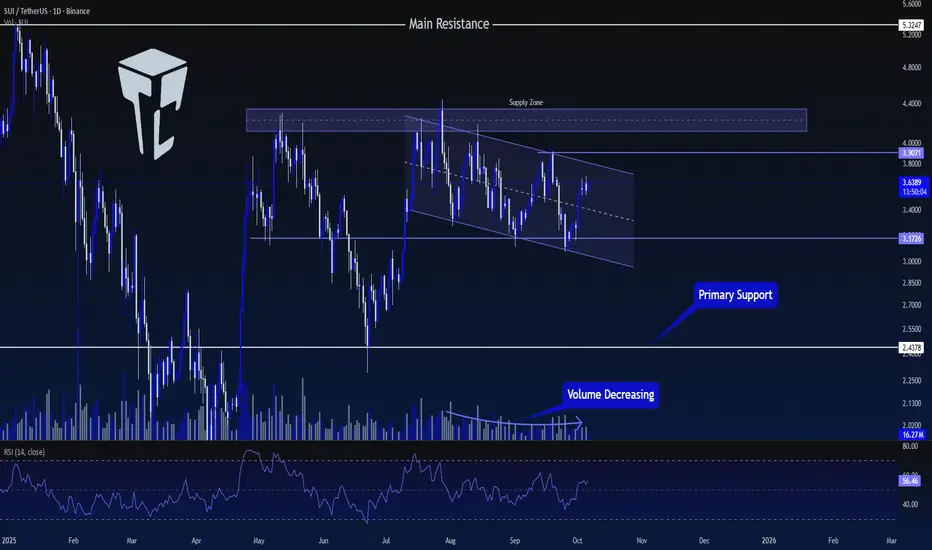
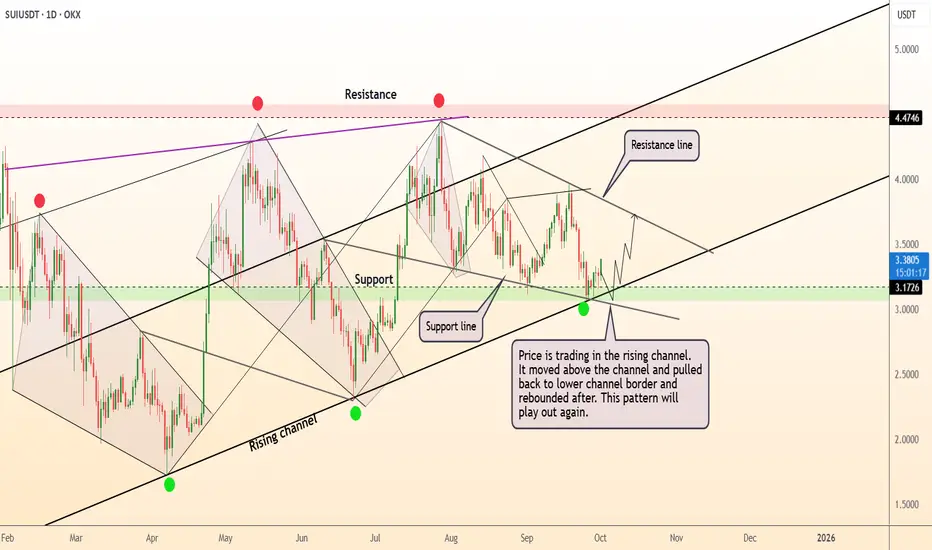
TradeCityPro | SUI: Approaching Key Breakout From Channel👋 Welcome to TradeCity Pro!
In this analysis, I want to review the SUI coin for you, one of the coins that gained significant attention in 2024 and currently ranks 14th on CoinMarketCap with a market cap of $13.22 billion.
📅 Daily Timeframe
On the daily timeframe, this coin has formed a supply zone
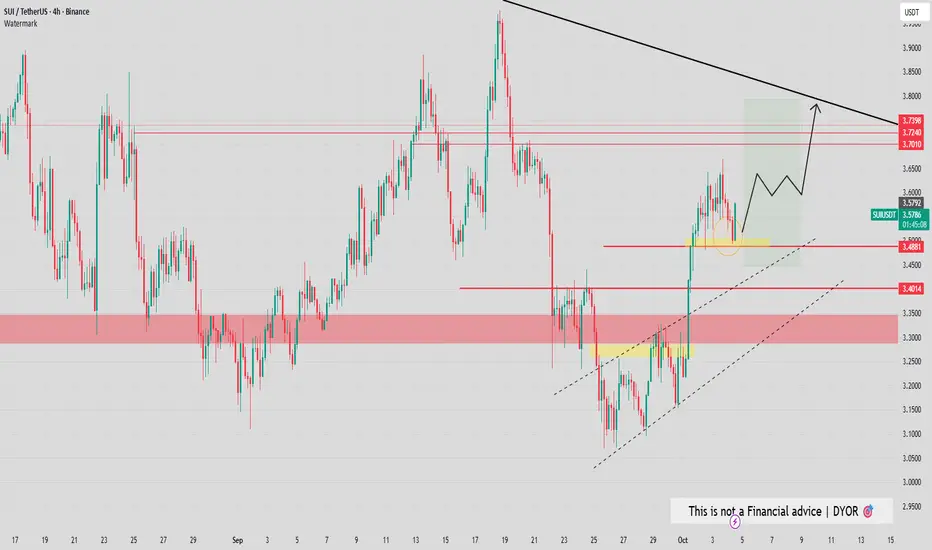
SUI - BULLS IN PLAYCRYPTOCAP:SUI - update:
Neutral on the daily & H4.
Following my previous outlook , price is consolidating nicely above the previous 50% fib level!
Hence, Im bullish above 3.4500$ support.
Price may visit the 3.720 - 3.78$ level next! 📈
DeGRAM | SUIUSD fixed above the $3.2 level📊 Technical Analysis
● Price respects a broad descending channel but just bounced from the lower support line with a long-wick rejection; bullish divergence and a sequence of higher lows from June signal a turn.
● Break back above the mid-channel and a short bull flag point to a run toward the upp
SUI — Critical $3 ZoneSince completing its 5-wave impulse on July 28, SUI has been in a corrective phase for the past two months. The structure remains clean, with invalidation zones well-defined.
Looking ahead, there’s potential for an ascending triangle formation but for that to play out, it’s crucial that SUI holds t

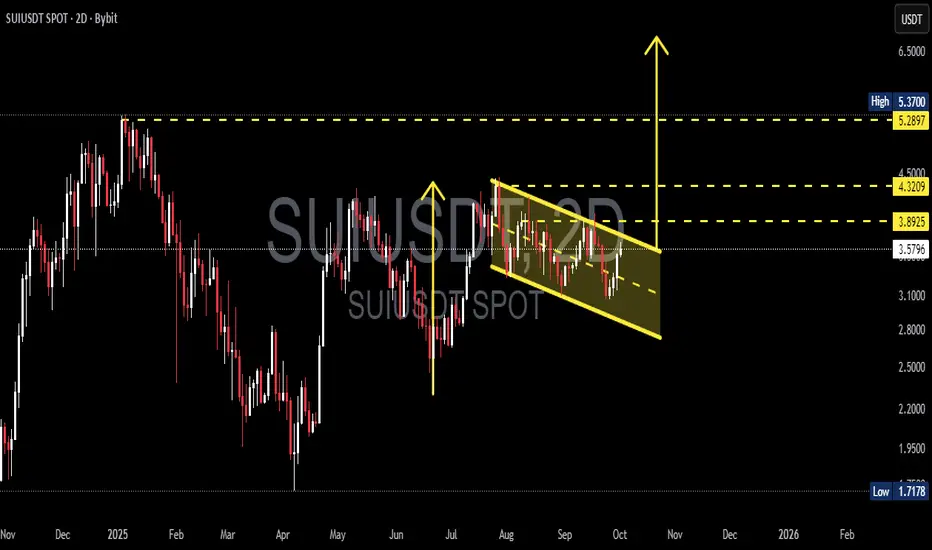
SUI/USDT — Bullish Flag, Consolidation Before the Next Rally?📌 Pattern Overview
SUI is currently forming a Bullish Flag pattern, which consists of:
Flagpole: the strong rally from June–July that pushed the price significantly higher.
Flag: a downward-sloping consolidation channel (descending channel) since August.
This pattern typically indicates a healt
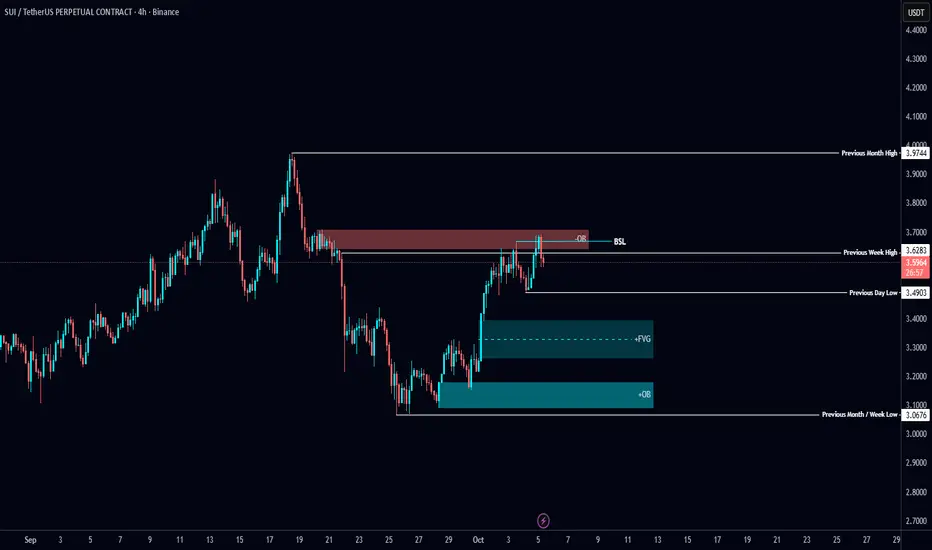
$SUI Analysis🚨 CRYPTOCAP:SUI Analysis 🚨
CRYPTOCAP:SUI just swept the BSL inside the bearish Order Block 👀
This opens the door for short setups from here 📉
📌 Key levels to watch:
Bullish FVG below
Bullish OB resting lower
Plenty of clean opportunities on both sides✅
SUI/USDT; BUYERS INHello friends
Given that the price has reached the specified support and the price is supported by buyers and the specified resistance has been broken, we can buy in steps with risk and capital management and move towards the specified goals.
*Trade safely with us*

SUI Bullish scenarioWatching SUI price retrace to possible support levels.
Potential for it to start a new bullish trend to the upside.
See all ideas
Summarizing what the indicators are suggesting.
Oscillators
Neutral
SellBuy
Strong sellStrong buy
Strong sellSellNeutralBuyStrong buy
Oscillators
Neutral
SellBuy
Strong sellStrong buy
Strong sellSellNeutralBuyStrong buy
Summary
Neutral
SellBuy
Strong sellStrong buy
Strong sellSellNeutralBuyStrong buy
Summary
Neutral
SellBuy
Strong sellStrong buy
Strong sellSellNeutralBuyStrong buy
Summary
Neutral
SellBuy
Strong sellStrong buy
Strong sellSellNeutralBuyStrong buy
Moving Averages
Neutral
SellBuy
Strong sellStrong buy
Strong sellSellNeutralBuyStrong buy
Moving Averages
Neutral
SellBuy
Strong sellStrong buy
Strong sellSellNeutralBuyStrong buy
Displays a symbol's price movements over previous years to identify recurring trends.