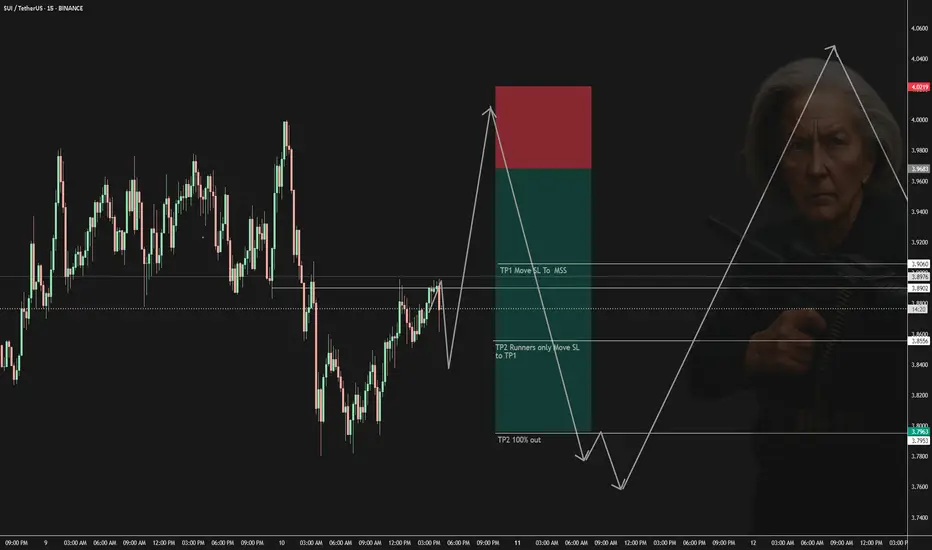
08/10-08/12/25 SUI SHORTCould go lower at first but will end up grabbing liquidity higher, form SMT, then entry model, then targets hit as chart shows.
Trigger:
A wick into $3.95–$4.00
Targets:
TP1: $3.90 (minor intraday support)
TP2: $3.85 (recent local low)
TP3: $3.78 (major 1H structure low)
Trade ideas
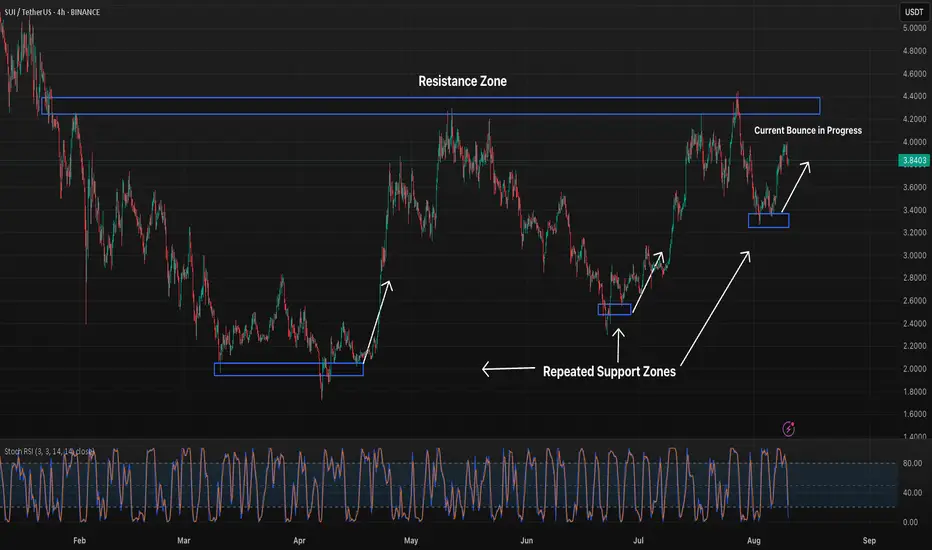
SUI 4H Bounces Again, Eyeing Key Resistance ZoneSUI has repeatedly found strong buying interest at the same support level, each time leading to a sharp rally. Price is once again bouncing from this zone, with momentum building toward the $4.20–$4.40 resistance area. A breakout above this zone would mark the first higher high since July, while rejection could keep price range-bound.
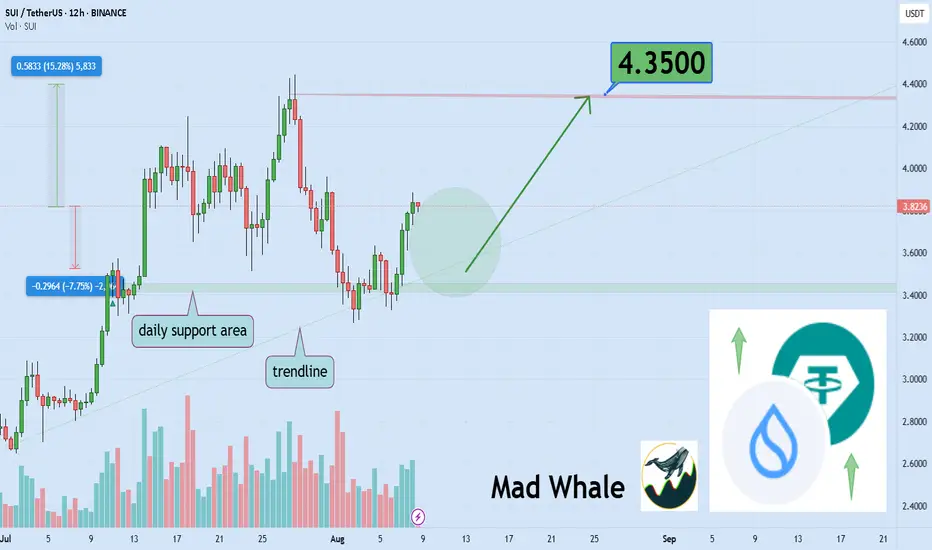
SUI Holds Final Support, Eyes 15% Rally Toward $4.35Hello✌️
Let’s analyze SUI’s price action both technically and fundamentally 📈.
🔍Fundamental analysis:
The SEC is looking at two SUI ETF proposals, with a decision expected by Jan 2026. Big banks and funds are getting involved, which could impact supply and demand.
📊Technical analysis:
BINANCE:SUIUSDT has lost all major Fibonacci supports, with daily support and trendline as final defenses 📉. If these hold and volume remains stable, a 15% rally toward \$4.35 is likely 🚀.
✨We put love into every post!
Your support inspires us 💛 Drop a comment we’d love to hear from you! Thanks, Mad Whale
SUI – Ready to Drop from the $3.96 Supply WallSUI has rallied right into a key confluence area — the strong supply zone & bearish order block at $3.90–$4.00, which also aligns perfectly with the descending channel’s upper boundary.
📌 Bearish Scenario (preferred):
If price shows rejection at this zone and breaks below $3.85, a corrective move toward $3.55–$3.60 is highly probable, with potential extension toward $3.35 demand zone.
📌 Invalidation:
A 4H candle close above $4.05 would invalidate the short setup and open the door for a continuation toward $4.25+.
💡 Note: Confluence of channel resistance + supply OB + psychological $4 level makes this a high-probability short area. Watch for lower-timeframe BOS or liquidity sweep before entering.

SUI/USDTTesting/tracking Elliot wave.
SUI/USDT weekly chart
Sui might be in this super cycle wave. Possible wave 3 top is around $20
Sub cycle wave top is at $8
Pullbacks are on the chart and I’ve tried to place them where I think it’ll happen. While Elliot waves cannot tell you when price targets will hit, I’ve lined them up to market cycles of potential corrections.

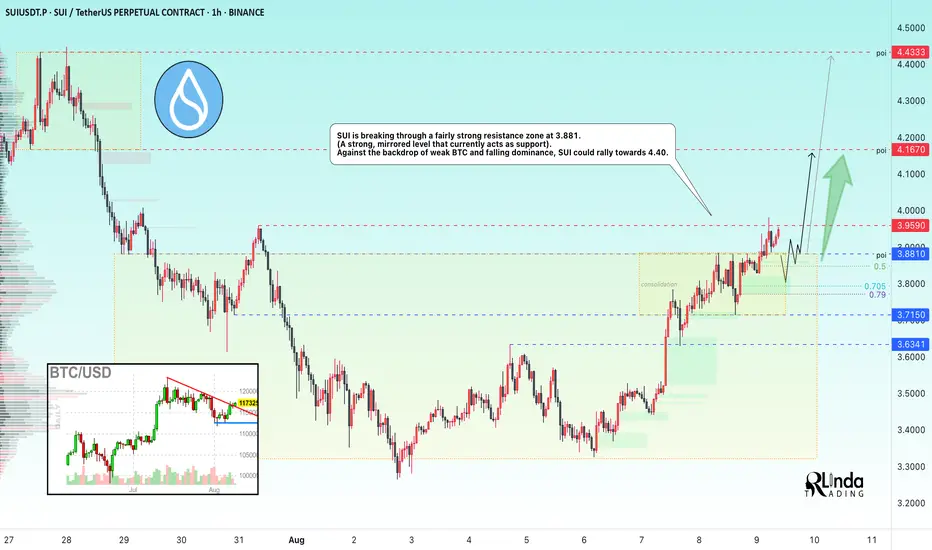
SUIUSDT → Resistance breakout and entry into the buying zoneBINANCE:SUIUSDT is breaking out of its trading range and local consolidation upward. Consolidation above the mirror level could trigger a continuation of the rally to 4.4 - 5.0.
Bitcoin has been trading in the red since the start of Saturday's session, but is gradually recovering. At this time, the altcoin market is rallying, while the Bitcoin dominance index is updating its decline
As for SUI, the coin is in a bullish trend both locally and globally, but ahead lies the 4.45 barrier, which separates the price from a rally to ATH. The coin is breaking through a fairly strong resistance zone at 3.881. (A strong, mirror level, which currently acts as support).
Resistance levels: 3.959, 4.167
Support levels: 3.881, 3.715
Since the price has entered the buying zone, there is a possibility of a retest of the mirror level and the liquidity zone that has formed below the specified support. If the bulls hold their defense above 3.88 - 3.9, then in the short and medium term, the price could show good growth...
Best regards, R. Linda!
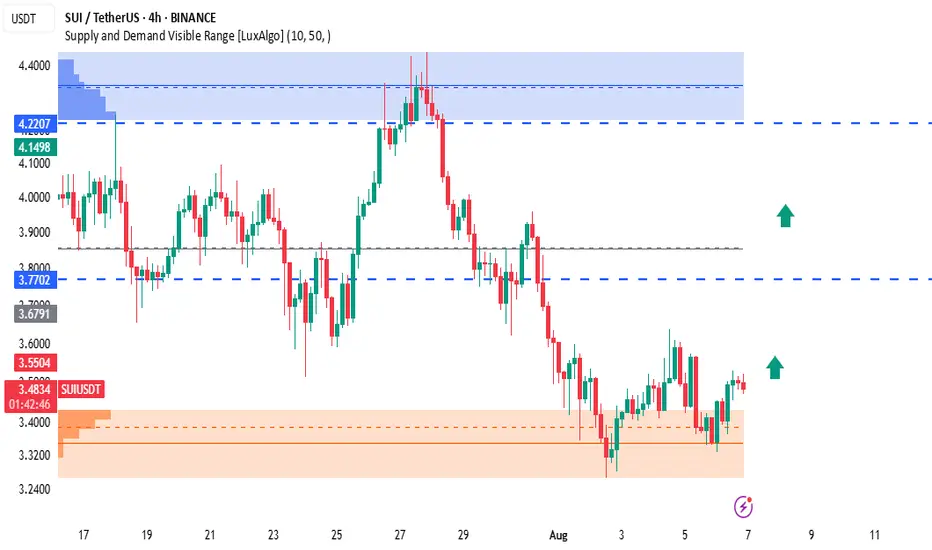
SUI/USDT Bullish Setup – Strong Rejection from Demand Zone!SUI is showing early bullish momentum after rebounding from a solid demand zone between $3.24 – $3.40. Buyers are defending this zone strongly, and price is now forming a higher low on the 4H timeframe, signaling potential upside continuation.
🔍 Technical Breakdown:
Demand Zone (Support): $3.24 – $3.40 (Highlighted in orange)
Current Price: $3.48 (Trading slightly above demand zone, showing bullish structure)
First Resistance (TP1): $3.7702 (prior support turned resistance)
Final Target (TP2): $4.1498 – $4.22 (major supply zone with historical selling pressure)
✅ Bullish Confluences:
Price formed double bottom at the demand zone
Bullish candle structure building up
Visible volume cluster supports bounce (LuxAlgo VRVP)
Clear upside imbalance toward $4.22
📌 Trade Setup:
If price continues to hold above $3.40 and breaks recent highs:
Entry: $3.45 – $3.50 (current breakout range)
SL: Below $3.24 (beneath the demand zone)
TP1: $3.7702
TP2: $4.1498
TP3 (extended target): $4.2207
🧠 Notes:
Watch for breakout above $3.55 for stronger momentum confirmation
Scaling out partially at $3.77 is wise due to previous resistance
Supply zone at $4.22 is a critical decision point
🟢 Bias: Bullish until $3.24 is broken
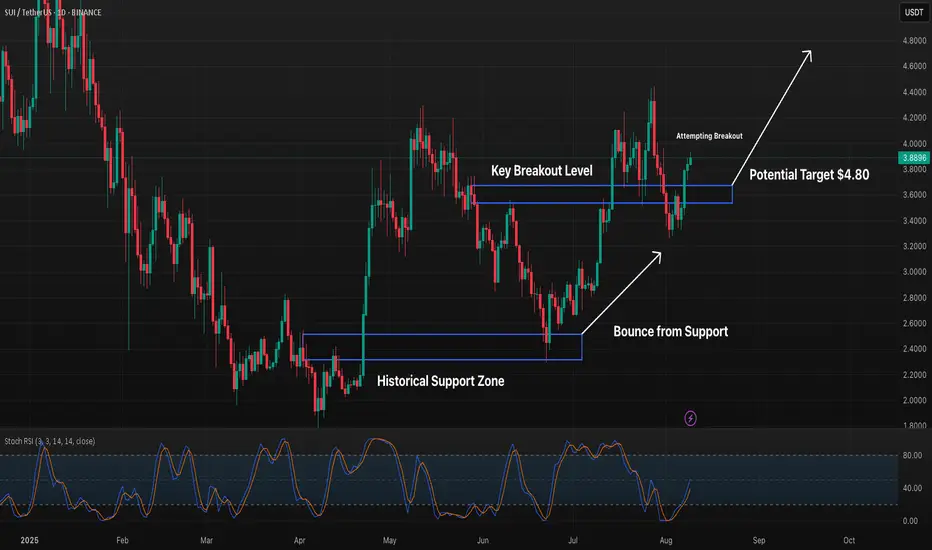
SUI 1D Breakout Attempt in PlaySUI has bounced strongly from its historical support zone, reclaiming the key breakout level near 3.75. Bulls are now pressing higher, aiming for the next major target around 4.80. A confirmed close above the breakout level would strengthen the bullish case, while failure to hold could see price revisit support in the 3.40–3.20 range. Momentum is improving, but follow-through is critical.
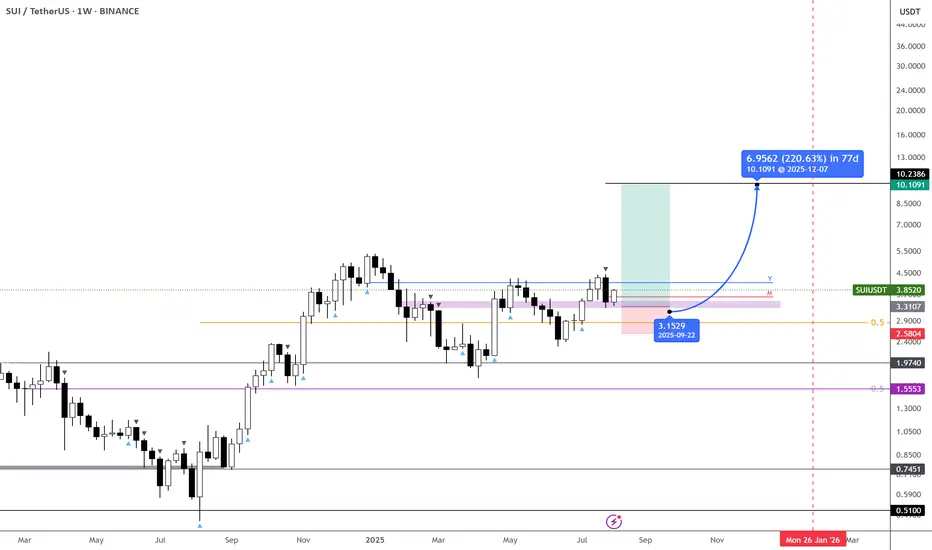
Long Signal on $SUI - $10 incoming?Sure, it’s been lagging compared to some other caps—but we finally have a strong monthly signal.
Constructive price action above the $3.30 pivotal zone makes this one a lot more appealing. It’s also setting up for a third attempt at $4, the last major level before a new ATH. Once this supply zone is cleared, the path toward double digits opens up.
Overall, BINANCE:SUIUSDT is one to keep on the list if you’re looking to play it a bit less aggressively over the coming months.
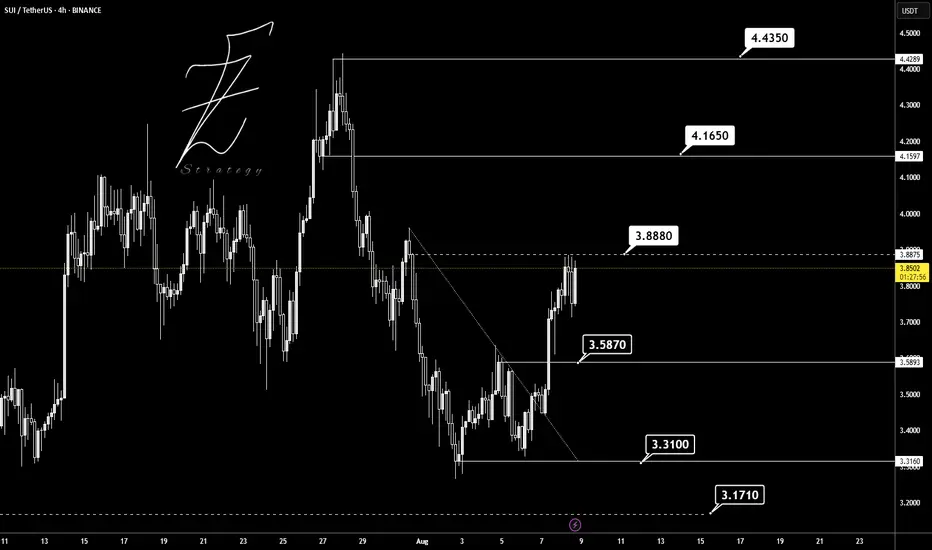
SUIUSDTI think will be bullish BINANCE:SUIUSDT if breaks above 3.88 $ and reach to 4.16 and 4.43 as the next target.
Supports: 3.58 - 3.31 - 3.17
Resistance: 3.88 - 4.16 - 4.43
Please control risk management ⚠️
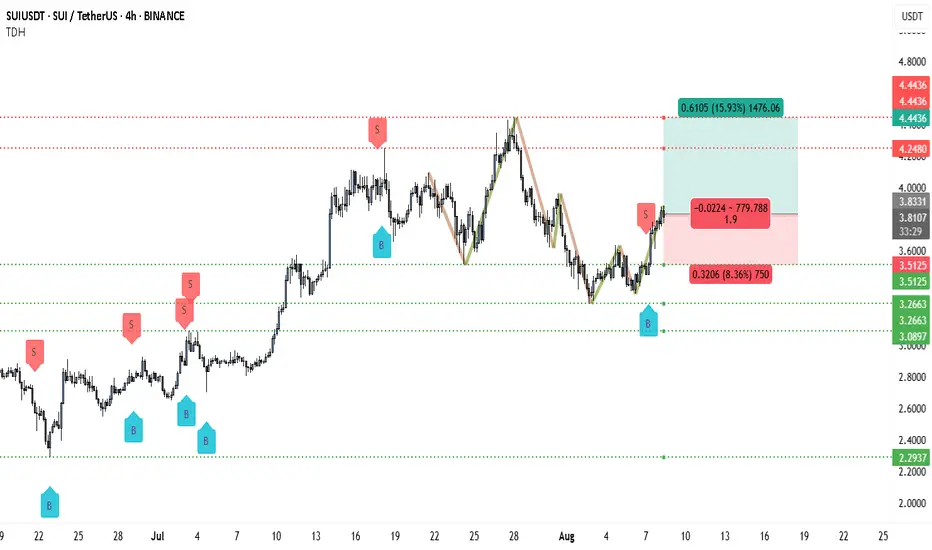
SUI Bulls Are Back – Target $4.44?SUI has rebounded strongly from the $3.089–$3.266 demand zone, establishing a clear higher low on the 4H chart. This bounce was followed by a decisive break above short-term resistance near $3.60, signaling renewed bullish momentum. Price is now around $3.83, just below the key $4 psychological barrier, where buyers appear poised to push toward higher resistance levels.
The structure favors continuation to the upside as long as $3.512 holds as support. A strong 4H close above $3.85–$3.90 could unlock the move toward $4.24 and potentially $4.44. Momentum indicators align with price action, suggesting the uptrend has further room to extend.
Trade Setup
• Entry: $3.83 (or pullback to $3.70–$3.75)
• Stop Loss: $3.512
• Target 1: $4.248 (~10.9%)
• Target 2: $4.443 (~15.9%)
• Partial Profit Plan: Take some profits near $4.24 to lock in gains, let the rest run toward $4.44 depending on momentum and your risk profile.
📌 It is recommended to book partial gains along the way and use trailing stops to protect profits while allowing the trade to capture extended upside moves.
SUI 1H – Trendline Break Confirmed, But Will 3.66 Hold Support?SUI broke above its descending trendline with strong momentum, confirmed by an EMA cross and clean breakout retest. Price pushed into the 3.75–3.80 range before pulling back toward the 3.66 support area.
If buyers hold this zone, the breakout structure remains intact and could fuel another leg higher. However, a break back below 3.66 would weaken the bullish bias and put the EMAs back under pressure.
Key watchpoints:
– Trendline break + EMA cross as bullish confluence
– 3.66 as immediate support
– Stoch RSI oversold, suggesting possible bounce potential

Last trade Explanation $SUITrade Setup: Liquidity Sweep / Manipulation Entry
Pair: SUI/USDT
Timeframe: 15-Minutes
Platform: Binance
Chart Type: Candlestick
Trade Concept
This trade is based on a liquidity sweep/manipulation trap, where the price fakes a breakdown below a key support to trap sellers before reversing.
Entry Rules
Identify Liquidity Zone:
Mark key support levels where multiple lows have formed (acting as liquidity pool).
Wait for a clear sweep below this level (price makes a lower low, triggering stop losses/sell orders).
Wait for Confirmation:
Do not enter on the sweep candle.
Wait for the next candle to close back above the broken support, confirming the reclaim.
Entry Point:
Enter after reclaim of the support (confirmation candle).
This confirms the seller’s trap/manipulation.
Stop Loss & Target
Stop Loss: Just below the sweep wick (to protect against actual breakdown).
Take Profit: Based on structure or previous resistance zones.
In this chart, a strong impulse followed the reclaim, allowing for a favorable risk-to-reward ratio.
Remarks
Risk Management: Only enter after confirmation to avoid false breakouts.
Psychological Note: This setup works on exploiting retail stop hunts and institutional reclaims.

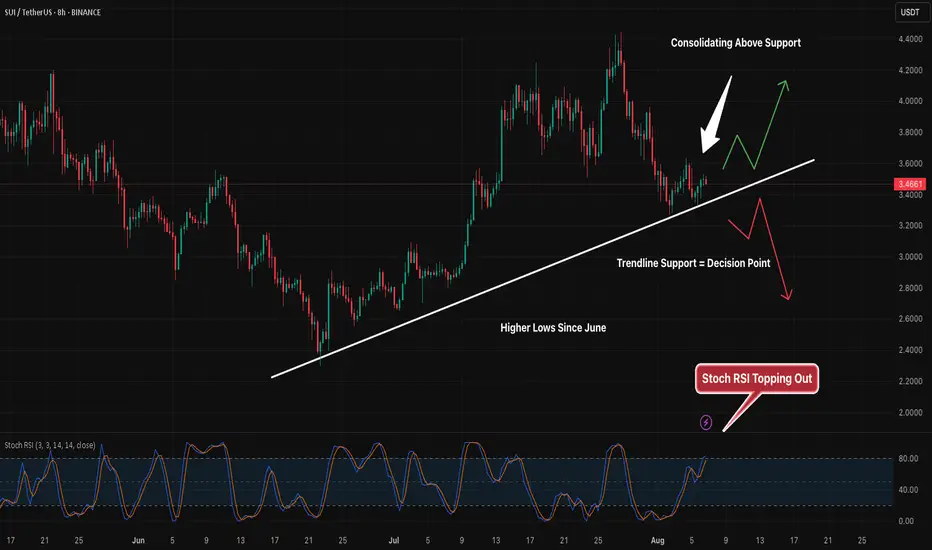
SUI 8H – Compression at Trendline, But Which Side Snaps 1st?SUI has been climbing a steady series of higher lows since mid-June — respecting this ascending trendline cleanly through every corrective phase. Now, price is pressing right into that same support again, but this time with bearish momentum behind it.
What makes this different?
Stoch RSI is topping out — suggesting we’re nearing short-term exhaustion
Recent candles are hugging the trendline, not bouncing off it with strength
Volume is low, structure is tight — this is where big moves are born
We’re compressing into the apex of this rising support line. If SUI holds and breaks north, the upside target sits above $4, retesting recent swing highs. If this trendline gives out, however, the next clean support is around the psychological $3.00 level — right in the middle of July’s accumulation range.
TradeCityPro | SUIUSDT Is the best time to buy ?👋 Welcome to TradeCityPro Channel!
Let's analyze and review one of the most popular coins in the market, sui, and update our previous analysis and find new triggers
🌐 Overview of Bitcoin
Before starting the analysis, I want to remind you again that we moved the Bitcoin analysis section from the analysis section to a separate analysis at your request, so that we can discuss the status of Bitcoin in more detail every day and analyze its charts and dominances together.
This is the general analysis of Bitcoin dominance, which we promised you in the analysis to analyze separately and analyze it for you in longer time frames.
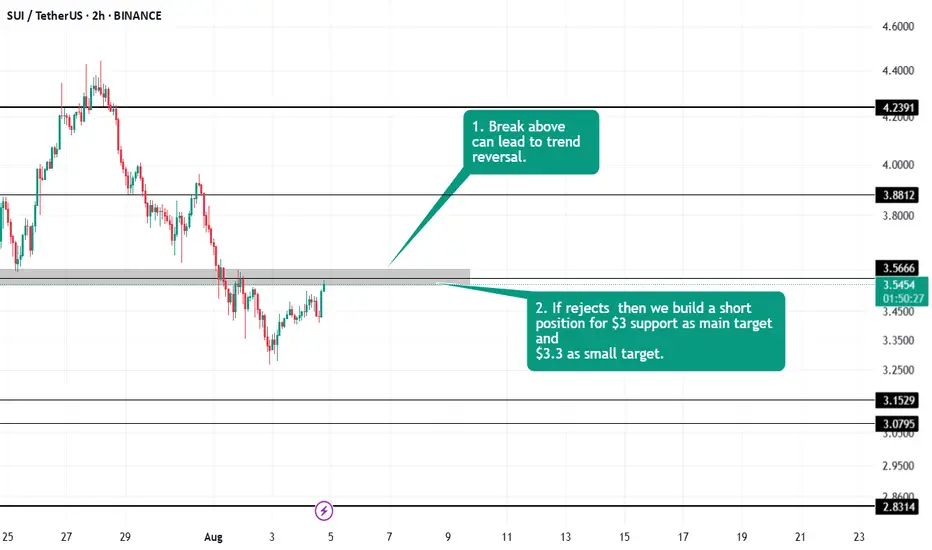
Very briefly, we are going to take a look at the SUI chart in a nutshell so that we don't miss the triggers
We are currently inside our 4-hour range box and are fluctuating between 3.31 and 3.59
After the 3.59 break or the 3.31 fake breakout, I will definitely try to open a long position and I also need volume confirmation for this.
For short positions, the 3.31 break is a very good trigger, but try to pay more attention to other charts. If you open with the failure of this trigger, try to save your profit very quickly.
📝 Final Thoughts
Stay calm, trade wisely, and let's capture the market's best opportunities!
This analysis reflects our opinions and is not financial advice.
Share your thoughts in the comments, and don’t forget to share this analysis with your friends! ❤️

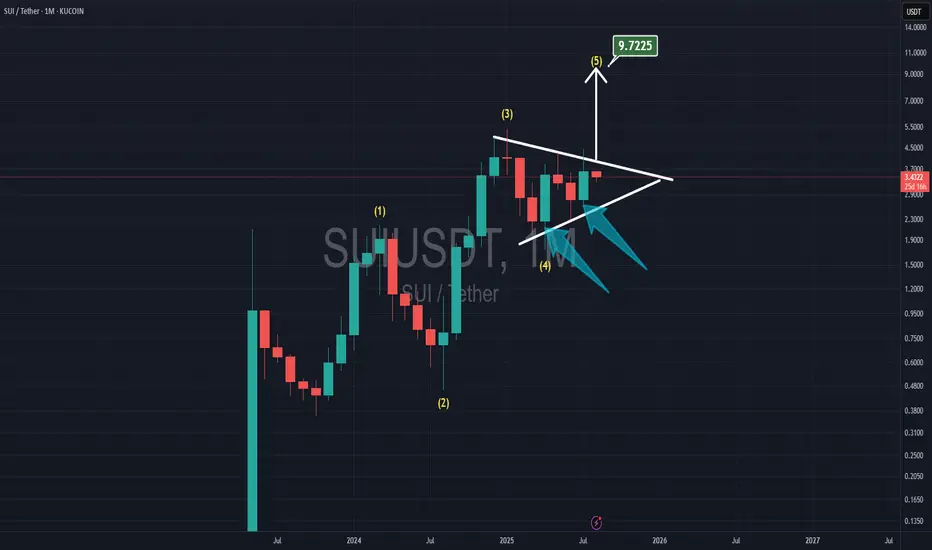
SUI TO $10.00With Elliot waves count, now SUI is in the 5th wave.
It has 2 bullish monthly candles for April & July, and SUI is playing inside the triangle which shows me with the breakthrough the resistance, the target is at $10
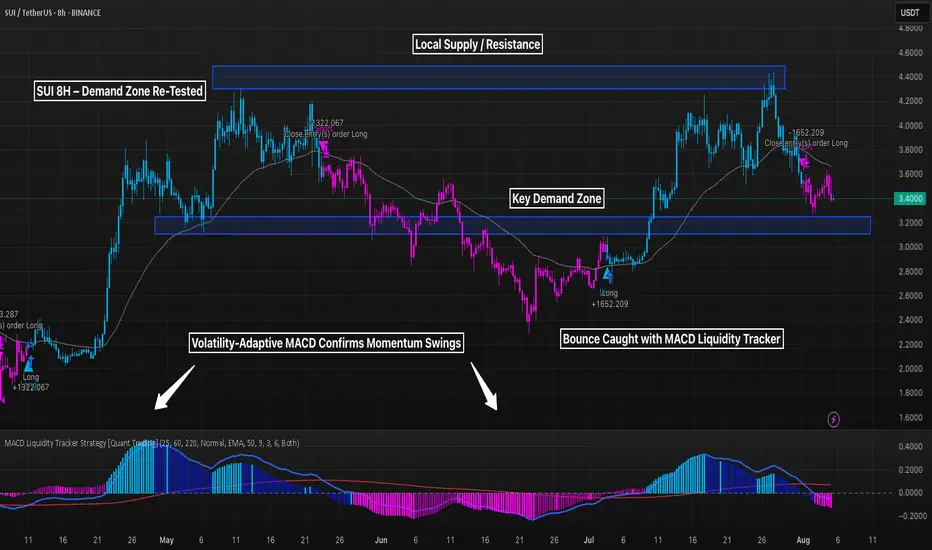
SUI 8H – Demand Zone Re-Tested, Will Strategy Fire Again Soon?SUI is approaching a major demand zone after rejecting from local highs near $4.60 — and the MACD Liquidity Tracker Strategy just closed its most recent long position. With momentum fading and price nearing structure, the next signal could be pivotal.
🔹 Strategy Settings
MACD: 25 / 60 / 220
System Type: Normal
MA Filter: EMA 50, VIDYA smoothing (9)
This configuration has historically excelled on volatile pairs like SUI — catching high-RR reversals from demand zones.
🔹 Price Structure
Key support sits between $3.10–$3.30 — a previous breakout base.
If price retests this zone and MACD curls, we may get another high-conviction entry.
Resistance remains at $4.50+, where the last major exit was triggered.
🔹 Momentum Check
MACD histogram flipped bearish, but flattening — suggesting weakening downside.
Strategy will likely stay flat until a new trend forms, giving traders time to prep.
Will the bot strike again at support — or is SUI setting up for something deeper?
Let’s analyze 👇
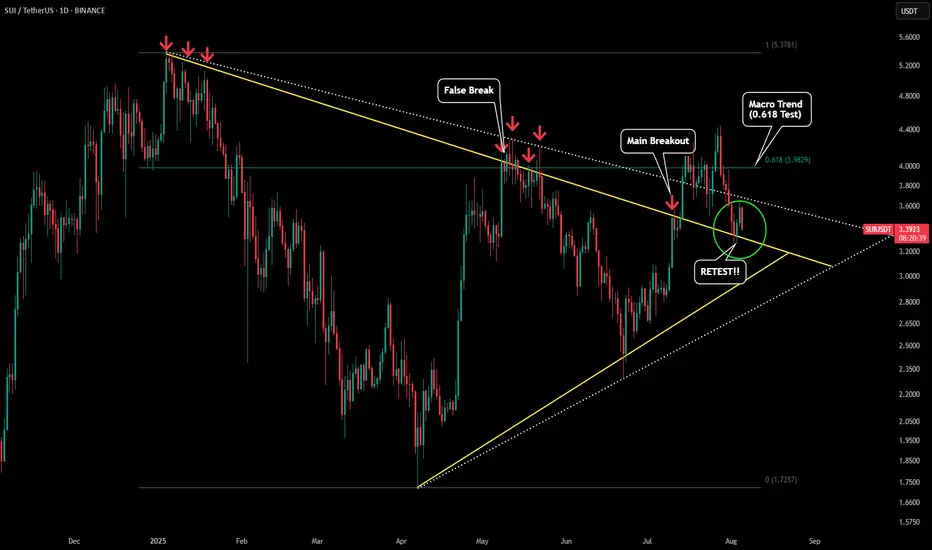
SUI - Retest in ProgressPlease refer to our previous post:
What we stated in this post from over three weeks ago was "If we get a retest and hold of that yellow trendline that will be the confirmation we need for a full blown breakout for SUI."
Current day we just got that retest! As you can see (green circle) both daily candles held the body above the yellow line giving us our first confirmation of a successful retest. If this retest remains successful we should see a continued move to around $5.50.
However due to BTC's current state we cant rule out the bearish scenario. If BTC starts to close below $112k then most likely SUI will fall below our triangle pattern. If SUI falls below and starts closing below the yellow line that would signal a false break. At the moment this is the less likely scenario given the market structure built, but something to watch closely.
SUI Swing Buy / Long SetupSui is on Strong and decision Order block on 1 day Timeframe, If we break this then SUI will take correction till recent weekly low. If we hold this then new ath. Book some or 80% on mentioned area, rest hold till 6$.

#SUI TRADE PLAN Closely monitoring the trade. Would update once a decision candle is formed.
Keep watching
SUI 8H – Trendline Bounce Into Layered Supply ZonesSUI just respected a multi-week ascending trendline on the 8H chart — marking its third major touch since June. After a strong bounce from the $3.35 region, price is now moving with momentum, aiming toward two clearly defined supply zones stacked above.
The structure sets up a textbook bullish continuation play, with confluence from Stoch RSI flipping upward and trendline support staying intact.
🔍 Key Zones:
– Trendline Support: Untouched since mid-June
– First supply zone (~$3.95–$4.10): Initial retest target
– Second supply zone (~$4.40–$4.65): Key breakout trigger zone
– Stoch RSI just reset and is now pushing upward = momentum confirmation
A clean rejection at the first box would suggest chop or potential fakeout — but a break and retest could open the door to retesting highs above $4.80+.
This chart tells a simple story: trend is still intact, and bulls are in control — unless proven otherwise.
👇 Bullish? Bearish? Let’s hear your take.

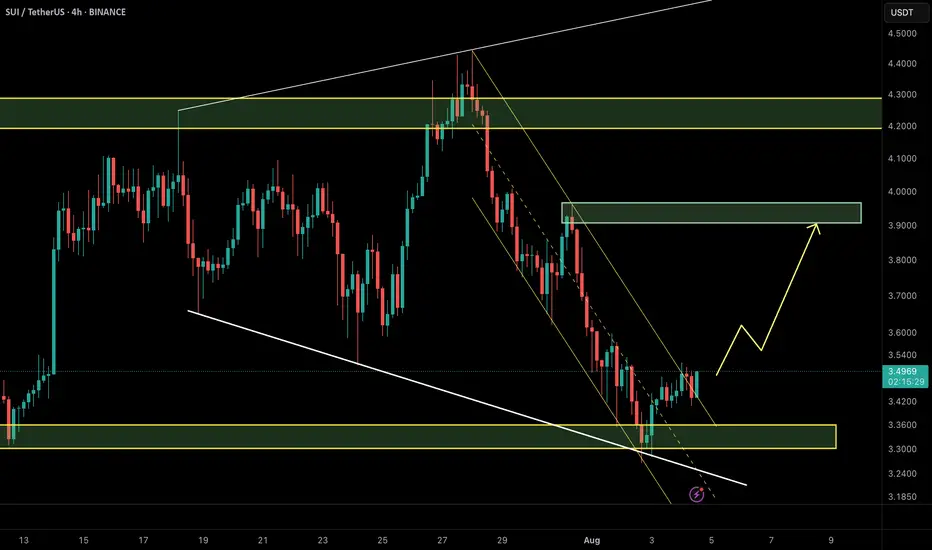
SUI/USDT – Price Outlook (2H TF)🔍 Updated Aug 4, 2025 | SMC + NeoWave
SUI has broken out of the descending channel and is currently holding above the strong demand zone around $3.35–$3.40. This zone overlaps with a bullish order block and prior trendline support.
📌 Bullish Scenario (preferred):
Price confirms support → Push toward $3.90–$4.00 supply zone.
📌 Invalidation:
A close below $3.35 invalidates the setup and suggests continuation of the correction.
💡 Tip: A breakout of structure (BOS) + mitigation of OB = solid confluence for long setups.
SUI | Sui Network - Swing Long Idea - Altcoin
📊 Market Sentiment
Market sentiment remains bullish, supported by expectations of a 0.25% rate cut at the upcoming FOMC meeting. The weakening USD and rising risk appetite across global markets are favoring crypto assets in particular.
📈 Technical Analysis
SUI recently gained bullish momentum, largely following Bitcoin's strength.
We’re now seeing a healthy retracement, which is expected after a strong move.
The break of the LTF bullish trendline suggests potential for a deeper pullback toward HTF confluence zones.
📌 Game Plan
I'm eyeing the HTF demand zone around $3.06, which aligns with the 0.5 Fibonacci retracement—a key discount zone.
Just below this, we also have a higher time frame bullish trendline, which could offer dynamic support.
These overlapping levels provide a strong confluence for a swing long idea.
🎯 Setup Trigger
I’ll wait for a 4H bullish break of structure and the formation of an LTF demand zone before entering.
📋 Trade Management
Stoploss: Below 4H demand swing low
Target: Up to $4.44
I’ll trail my stop to lock in profits aggressively along the way.
💬 Like, follow, and comment if this breakdown supports your trading!
More setups and market insights coming soon — stay connected!
