Sui chance for +60% on this zoneSui continue to grap liquidation but on the monthly and weekly timeframe we are still bullish.
I just saw good zone for trade. At 3.15 we have daily EMA + fibonacci 0.64 + Daily FVG.
I will suggest to add some leverage because invalidation is close to 2.9.
In this mid term bull market of altcoins we can see that SUI has good performance.
Ivan
Trade ideas

SUI formed the triangle ┆ HolderStatBINANCE:SUIUSDT is shaping a massive triangle formation after a series of consolidations. The structure highlights indecision, but traders should prepare for a potential breakout. An upside move could aim for the $4.20–$4.50 range, while a downside push would likely test the $3.20 support. Watching these levels closely will help identify whether accumulation or distribution is underway.

SUI — Where Liquidity Turns Into OpportunitySUI has been trading sideways for the past 40 days, offering solid swing opportunities both long and short. At the moment, there is one long setup that stands out → the $3.33 zone, where multiple layers of confluence align.
🧩 Confluence Factors: 5
1.0 Trend-Based Fib Extension: $3.3319
Prior Low: $3.3272 → potential liquidity sweep (SSL)
Anchored VWAP: Supporting the zone
Weekly 21 EMA / SMA: Acting as dynamic support
40d Range Context: Range low positioning
🟢 Long Trade Setup
Entry Zone: ~$3.33 (liquidity sweep into support)
Stop-Loss: Below $3.25
Target: Range highs near $4.20
R:R Potential: 1:10+
Note: Wait for bullish confirmation (order flow or strong reaction) before entering.
Technical Insight
The $3.33 level combines liquidity, fib projection, VWAP support, and the weekly 21 EMA/SMA → all pointing to a high-probability reaction zone. In sideways environments, such confluence at range lows often defines pivot points for the next swing move. If defended, upside targets remain the range high around $4.20.
🔍 Indicators used
Multi Timeframe 8x MA Support Resistance Zones → to identify support and resistance zones such as the weekly 21 EMA/SMA.
➡️ Available for free. You can find it on my profile under “Scripts” and apply it directly to your charts for extra confluence when planning your trades.
_________________________________
💬 If you found this helpful, drop a like and comment!

$SUI vs $SEI – History Repeats?Both charts are following a nearly identical 1-2-3-4 pattern.
👀 CRYPTOCAP:SUI already printed a +1,000% move from the local bottom at step 3.
🔥 Now NYSE:SEI looks like it's entering the same phase.
🧠 Is SEI the next SUI?
I’ve been tracking both since early 2024, and this setup looks 🔥
Don’t fade the fractals.

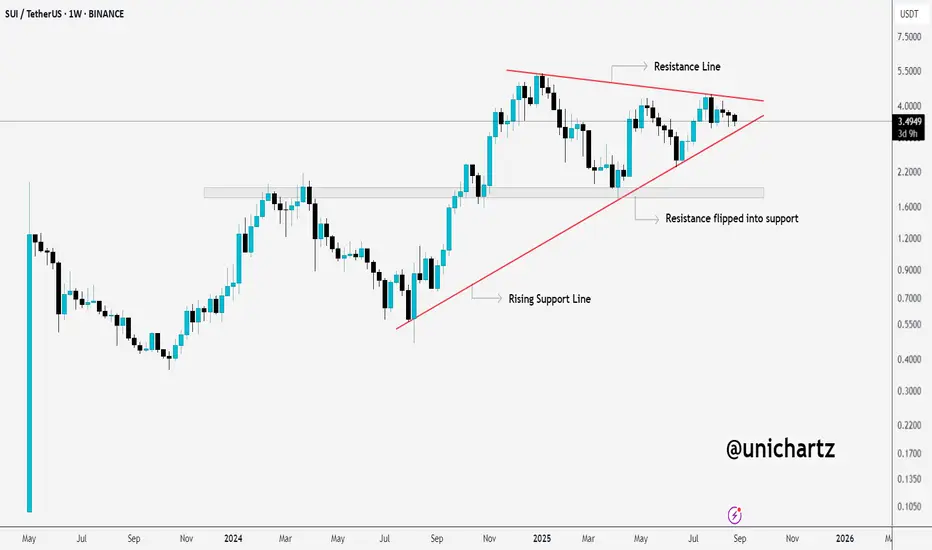
SUI Coiling for Big Move – Watch the ApexCRYPTOCAP:SUI is currently consolidating inside a symmetrical triangle, squeezed between a descending resistance line and a rising support line. This tightening structure suggests that a breakout move is on the horizon.
What’s notable is that a key resistance zone has now flipped into support, which gives bulls a solid base to defend. As long as SUI holds this rising trendline, the bias remains bullish.
DYOR, NFA
#PEACE
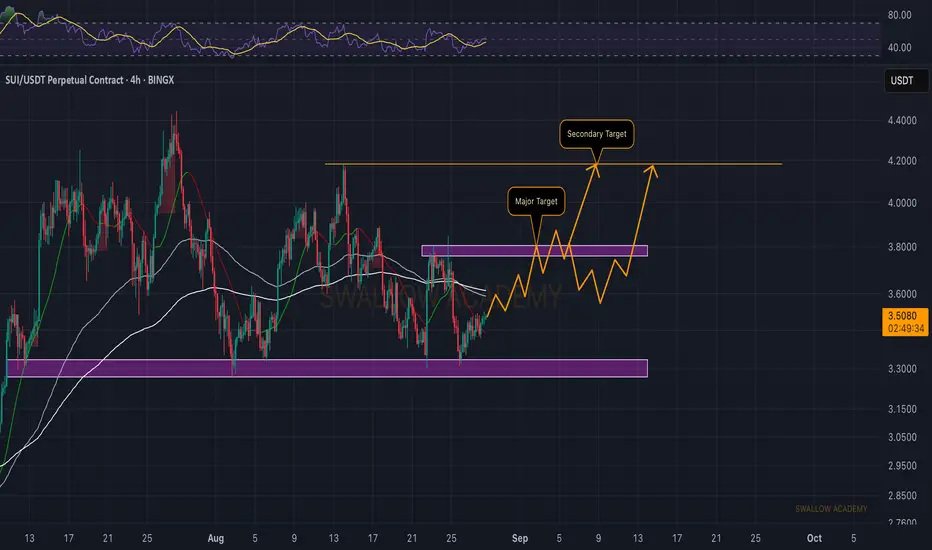
Sui (SUI): Most Probably We Will See $3.80SUI is cooking something up after that successful bounce from the support zone, which is giving us a decent opportunity for another bounce to the next resistance area (which as of now is sitting at $3.80).
So we are looking for $3.80 to be reached and once the price is there, we are going to look for either a breakout or a rejection (depending on market structure development, ofc).
Swallow Academy
SUI : Heavy fall or stunning growth!Hello friends
Given the good growth we had, the price has pulled back well and has managed to hold itself well in the specified support area.
Now, given the lack of decline and weakening of sellers, we must wait for the reaction of buyers to see whether they will support the price in the support areas or not?
Given the good conditions of the currency pair, I buy in steps in the support areas and move with it to the specified goals, with capital and risk management.
*Trade safely with us*

SUI1D Technical Analysis for CRYPTOCAP:SUI at Supply Zone $3.087
On the daily timeframe, CRYPTOCAP:SUI is currently trading slightly above the psychological and technical supply zone at $3.087. This level represents a significant area where sellers previously stepped in, creating overhead resistance that could cap upward momentum.
Price action in recent sessions shows CRYPTOCAP:SUI facing selling pressure near this zone, with multiple wick rejections on the daily candles hinting at potential resistance holding firm.
Volume around the supply zone maintains moderate levels, suggesting active battle between buyers and sellers but no overwhelming dominance.
The RSI at a near-neutral level (~52) on the daily suggests indecision and room for further moves either way without being overbought or oversold.
MACD and short-term EMAs display mixed signals: momentum is balanced but leaning slightly bullish if price can defend above this zone.
If CRYPTOCAP:SUI can decisively break and hold above $3.087 supply, it would likely open path targets around $3.45–$4.00, with analyst resistance clusters noted near $3.67 and $4.00 in the medium term. Failure to hold above this supply zone risks a rejection down to strong support areas closer to $2.50–$2.70, which aligns with previous consolidation ranges and long-term demand.
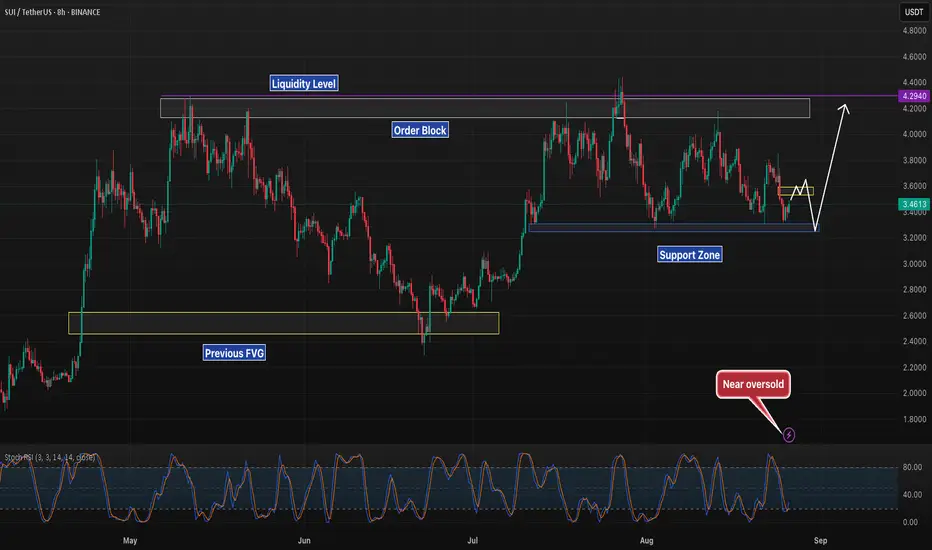
SUI 8H – Testing Support, Bounce or Break Toward Liquidity?SUI is sitting on the support zone after rejecting from the minor resistance box.
Bullish path: A hold here could send price back toward the order block, with liquidity resting above 4.29.
Bearish path: A breakdown under support risks continuation lower, revisiting deeper structure before another attempt higher.
Stoch RSI near oversold suggests momentum is positioned for a reaction from this level.
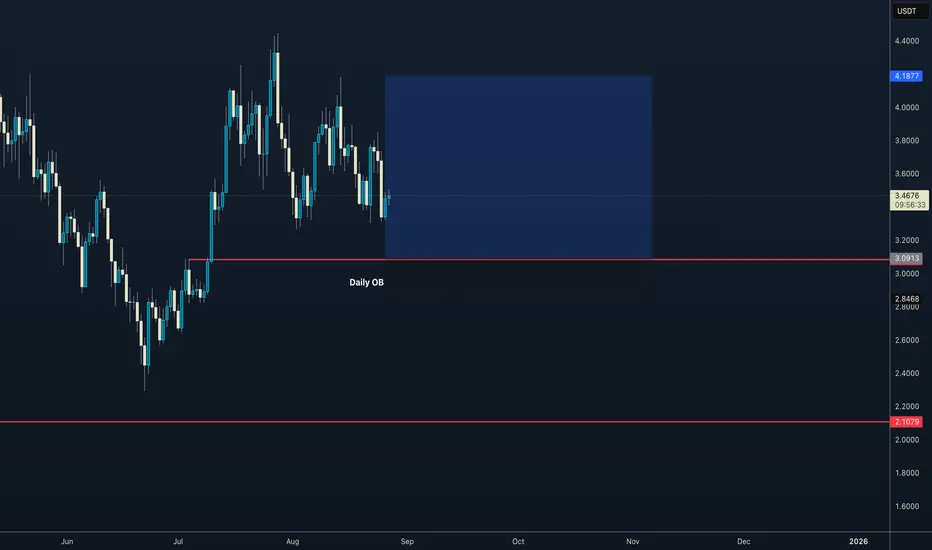
A beautiful 3RR trade for SUISUI looks ready for another leg up. Just need a tap into this high liquidity area with a daily OB BINANCE:SUIUSDT

12345 SUI!! Fractal Scenario – Market Outlook
This is a working projection, not a fixed forecast.
Market behavior evolves constantly. Based on Elliott Wave Theory, this scenario is subject to change and may invalidate our current bias at any time.
---
🧠 Key Considerations:
• Always validate with your personal strategies or systems.
• Look for confluence across multiple indicators or frameworks.
• Chart analysis is in Log Scale for accuracy on macro structures.
---
🚨 DISCLAIMER 🚨
This is not financial advice.
We're sharing this as part of our market study and journey—not as a signal to buy or sell. The market is volatile, and risk is always present.
You are fully responsible for your own trades.
Please DYOR (Do Your Own Research) and trade within your risk tolerance

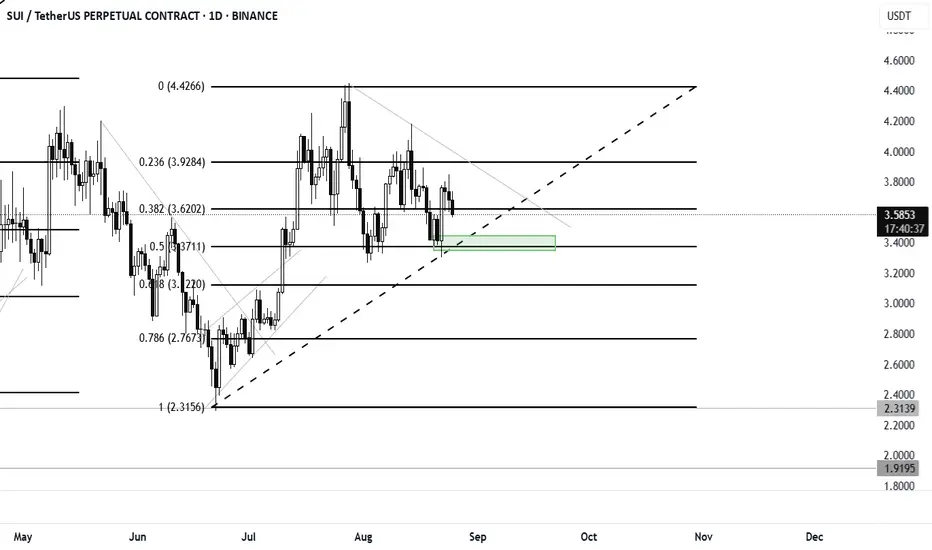
$SUI new Entry Points after rejectionCRYPTOCAP:SUI had heavy take profits at the resistance.
Marked is the new entry point at 0.5 Fib level.
I will be looking to long at 3.40$ and stoploss at 3.29
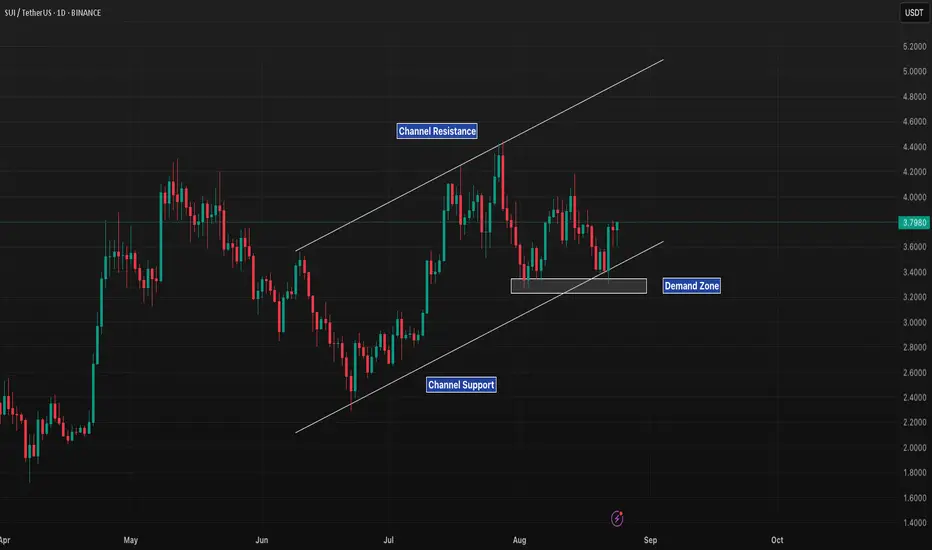
SUI 1D – Holding Channel Support, Next Leg to $5?SUI continues to respect its ascending channel, bouncing cleanly from the $3.20–3.30 demand zone and holding trendline support. Price is now testing mid-channel levels around $3.80, with momentum consolidating before the next directional move.
Bullish case: If the channel structure holds, SUI could target the upper boundary around $4.80–5.00, maintaining its higher-low formation.
Bearish case: A break back below the $3.20 demand zone would weaken structure, exposing downside toward $2.80–3.00.
The Stoch RSI is neutral, leaving room for momentum to swing either way depending on whether buyers or sellers take control here.
Key levels:
Demand support: $3.20–3.30
Channel resistance: $4.80–5.00
Breakdown risk: $2.80–3.00
SUI remains constructive while inside the channel — the next reaction at support will decide if this trend extends higher.
SUIUSDT: Price Action AnalysisGiven that we had an accelerated move upwards, so it needs a break and correction. It seems that liquidity has not yet been filled at low prices, so it is expected that the trend will start to decline after reaching the 3.75 point and correct to the 3.4 point and continue its growth again.

SUIUSDT.P LONGWaiting for this Bomb to explode..
Let it come to our level and show some bullish pattern we are in guys.
Always wait for the entry,
Always put s.l ..
Always take some profit at our 50% level, And bring s.l to entry.
We can just predict the market we cannot run it. So always be cautious.
Happy trading guys..
Please support me and follow me.

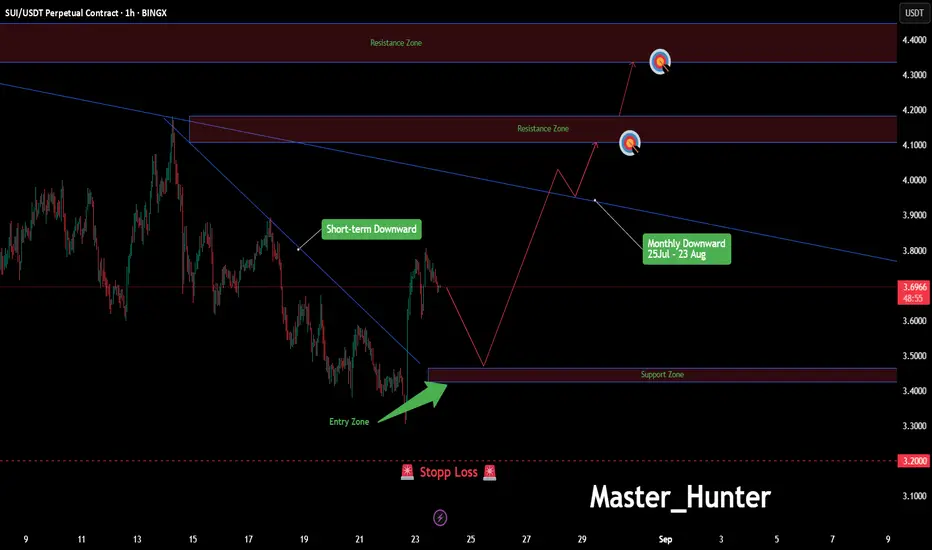
SUI/USDT: Bullish Blast to 4.44?BINGX:SUIUSDT.P is heating up on the 1-hour chart , with an entry zone between 3.465-3.425 near a key support and bullish divergence. 🎯 First target at 4.105-4.180 hits initial resistance, while the second target at 4.330-4.440 could spark a major breakout! 📈 Set a stop loss on a daily close below 3.2 to keep risk tight. 🌟 A break above 3.5 with strong volume could ignite this move, driven by market hype and altcoin momentum. Watch for confirmation candles! 💡 Ready to ride this wave? Drop your take below!
📝 Trade Plan:
✅ Entry Zone: 3.465 – 3.425 (support area + divergence)
❌ Stop Loss: Daily close below 3.20 to keep risk tight
🎯 Target 1: 4.105 – 4.180 (first resistance)
🎯 Target 2: 4.330 – 4.440 (major breakout zone)
#SUIUSDT #CryptoTrading #TechnicalAnalysis #TradingView #Altcoins #DayTrading #MarketSignals #Altseason
Lingrid | SUIUSDT Potential Following Pattern BreakoutBINANCE:SUIUSDT has bounced from support after a period of consolidation and is holding inside a broader resistance zone. The structure shows a descending triangle pattern forming under the downward trendline, with higher lows providing a base for pressure. A breakout above the resistance line could confirm upside continuation toward the next target zone. Broader momentum remains bullish as long as price sustains above support and higher lows hold the structure.
📉 Key Levels
Buy trigger: Break above descending triangle resistance
Buy zone: 3.50–3.60 accumulation area
arget: 4.18
Invalidation: A close below 3.00 support
💡 Risks
Failure to sustain above the higher low could trigger renewed bearish momentum.
Broader crypto market weakness or negative sentiment could stall breakout attempts.
Upcoming macro data or unexpected events could increase volatility and reject breakout.
If this idea resonates with you or you have your own opinion, traders, hit the comments. I’m excited to read your thoughts!

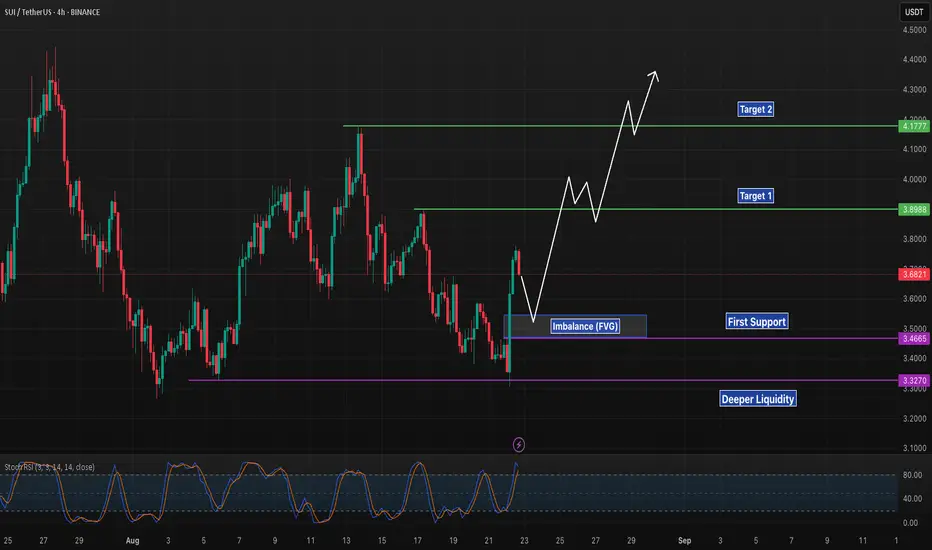
SUI 4H – Demand Retest for Higher Targets?SUI bounced sharply after sweeping liquidity near 3.32 and is now testing the 3.55–3.47 demand zone.
Key structure:
A successful retest at this demand could fuel continuation toward the upside targets at 3.89 and 4.17.
If buyers fail to hold above 3.46, deeper liquidity at 3.32 may be revisited before any rally.
Momentum favors the bullish retest scenario, but confirmation at demand is crucial before chasing higher levels.
SUI – The Next Solana in the Making target final 🔹 Why Whales Are Eyeing SUI
Accumulation Zone: $3.42 — prime entry for large positions
Short-term Breakout: $4 → $5 — first wave of upward momentum
Mid-term Momentum: $7 → $10 → $15 → $20 — strong moves as resistance levels are taken
Long-term Surge: $25 → $35 → $45 → $55 — potential parabolic move with whale inflows
💎 Key Points
SUI is a next-gen scalable blockchain with increasing adoption
Perfect low-risk, high-reward zones for whales
Clear roadmap from support → resistance → targets — no guesswork
🐋 Whales are circling — next breakout could ignite a massive rally. Stack now or miss the rocket! 🚀

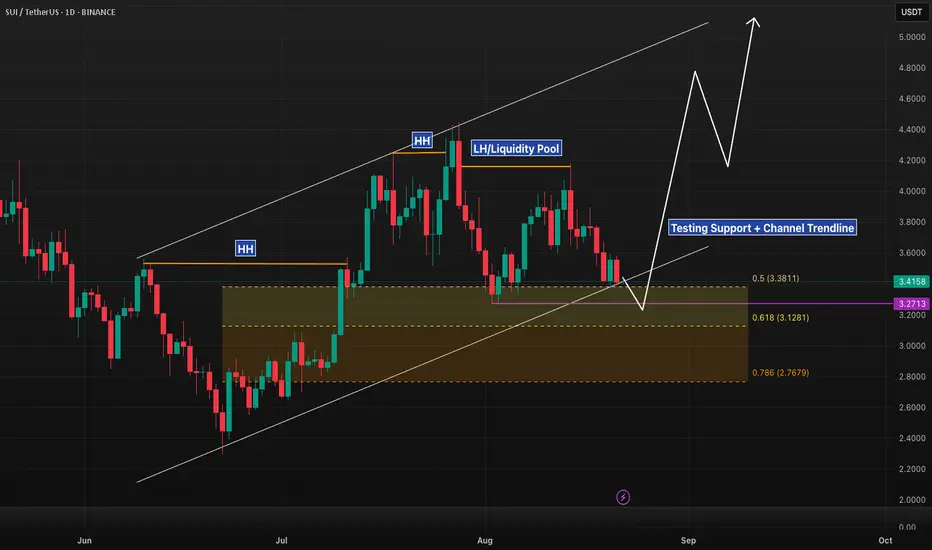
SUI 1D – Holding Channel Support, Watching Liquidity PoolSUI continues to respect its ascending channel, despite recent weakness.
Structure shows higher highs, followed by a lower high into liquidity pool.
Price is now testing the 3.27 support, aligning with the ascending channel trendline.
Holding this level could set up a rotation higher, targeting the 4.2 liquidity pool first, then possibly extending toward 5.0.
Breakdown below 3.27 would invalidate the bullish structure and shift focus lower.
This chart highlights how liquidity pools form at prior highs/lows and why channel support confluence can be a pivotal decision zone.
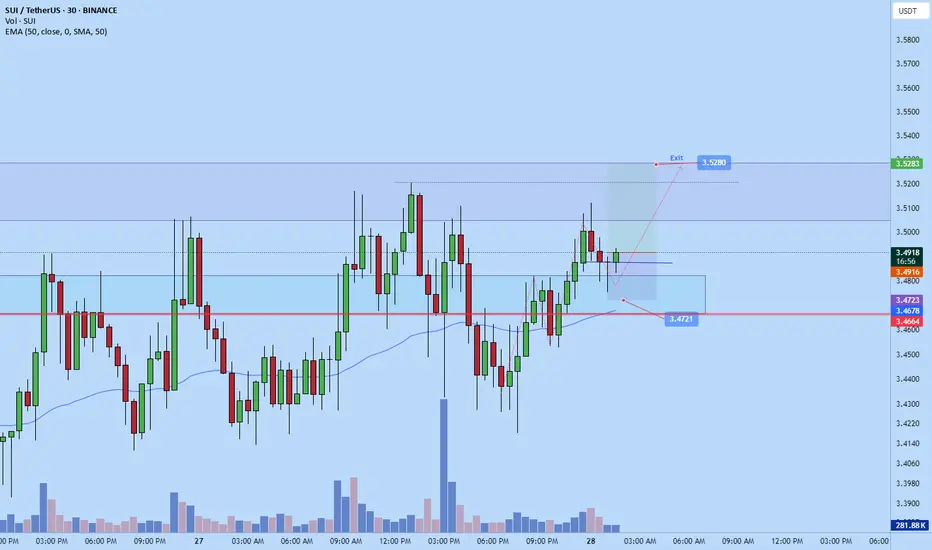
SUI SCALP Long / Buy SetupIt's a scalp setup, don't hold any trade for so long, must use sl and never use more than 2% of your wallet size on SL. Market is risky can take a sharp movement any side, So be careful. Reason for this trade is, it has taken downside SL and didn't close the candle, So we can take the long trade n target early shorters sl. If tp hits first then ignore the trade.

SUI 4H – FVG Rejection Targeting Liquidity?SUI rejected cleanly from the 3.95–4.05 FVG, failing to reclaim imbalance. Price is now trading back below the zone, pointing toward liquidity grabs lower unless bulls can recover the level.
FVG (3.95–4.05): Clear rejection block.
Liquidity Below: 3.33 is the next downside draw.
Liquidity Above: 4.37 only comes into play if bulls reclaim the FVG.
Momentum: Stoch RSI overbought, aligning with rejection bias.
Bias favors a liquidity sweep into 3.33 unless buyers step in with strength.
