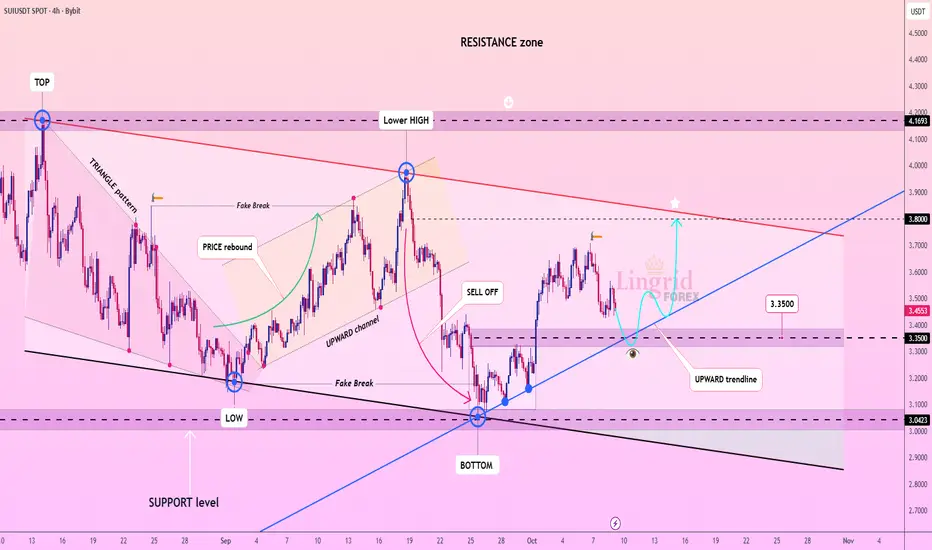
Lingrid | SUIUSDT Support Hold Recovery StabilizationBINANCE:SUIUSDT is pulling back to support 3.35 and upward trendline after a sharp rebound from support zone. The structure shows a recovery attempt within a broader upward correction, suggesting potential move toward 3.80. As long as price holds above 3.35 support, a bullish continuation toward 3.80 remains valid. Momentum is stabilizing, hinting that buyers may regain strength for another test of the upper resistance channel.
⚠️ Risks:
A close below 3.35 could trigger a retest of 3.00 support.
Weakness across major altcoins may limit upside recovery.
Unexpected market sentiment shifts or BTC corrections could suppress the rebound attempt.
If this idea resonates with you or you have your own opinion, traders, hit the comments. I’m excited to read your thoughts!
Trade ideas
SUI 1D Analysis - Key Triggers Ahead☃️ Welcome to the cryptos winter , I hope you’ve started your day well.
⏰ We’re analyzing SUI on the 1-Day timeframe .
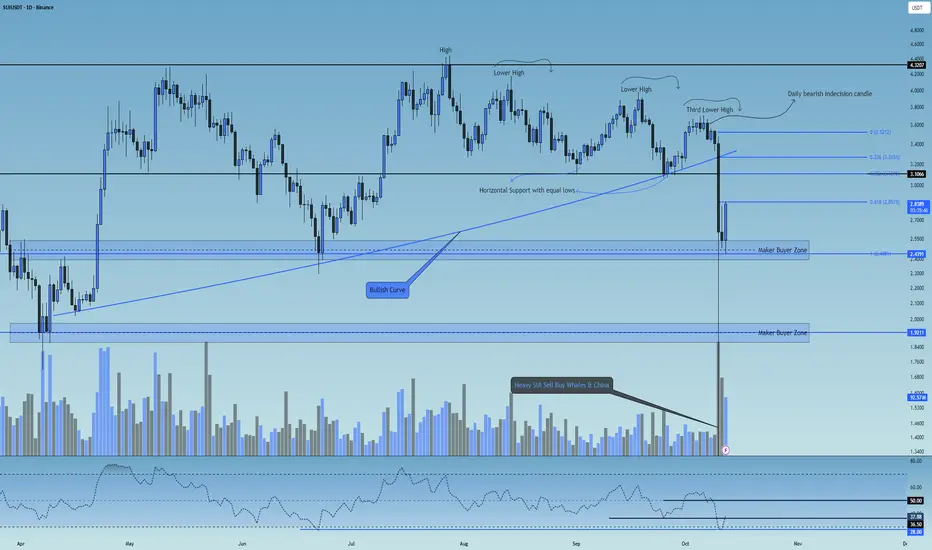
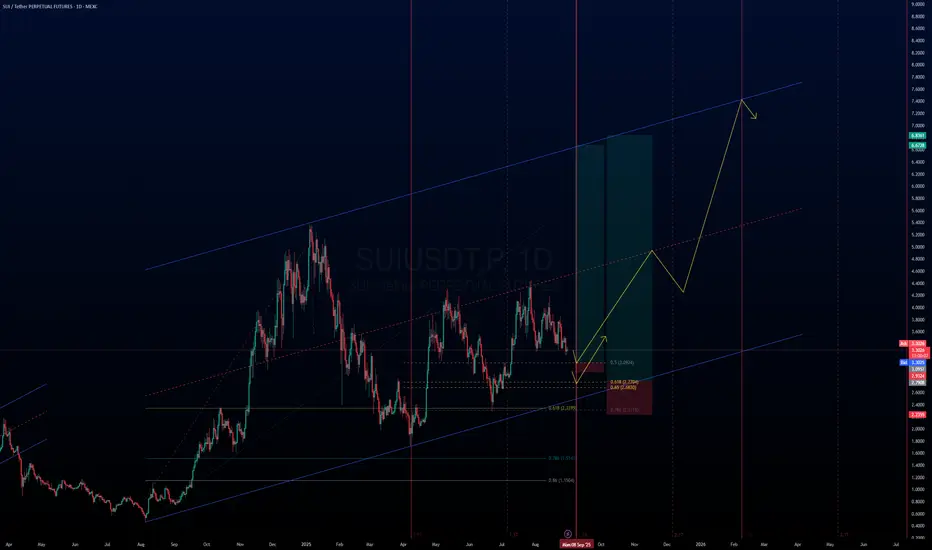
👀 On the daily timeframe of the SUI coin, we can see that SUI was moving along a slightly upward curved line, continuously forming higher highs and higher lows. After creating a top around the $4.3 zone, it faced a strong rejection and dropped toward the $3.3 support area. From there, it started forming lower highs and lower lows, practically entering a descending channel.
At the third and final lower high, SUI formed a strong daily indecision candle, which broke its multi-timeframe support at the $3.5 zone and continued moving downward. During the historic flash crash night of crypto, SUI opened around $3.4, then plunged to $0.5. Following exchange buybacks and market maker interventions, it made a massive upper shadow wick back toward the $2.6 zone, where it finally closed its daily candle.
🧮 Looking at the RSI oscillator, SUI experienced a heavy rejection from the 57 level, dropping below 50 and moving toward its daily oversold zone. The key RSI levels are currently around 36.5 and 50, with the 36.5 zone acting as the nearest crucial pivot level. A bounce from this region would slightly reduce the fear and FOMO of a deeper drop among traders.
🎮 A Fibonacci retracement drawn from $3.5 down to the market maker support zone at $2.43 reveals several important resistance levels. The 0.618 zone serves as a major resistance level—if this level breaks, it could lead to a higher low formation above $2.5, signaling a potential bullish reversal. The next resistance lies around 0.382, which is currently out of buyers’ immediate reach.
🕯 The recent candle sizes and volumes indicate strong selling pressure and rapid price teleportation downward. Signs of this drop could already be seen through the bearish indecision daily candle, but such an extreme dump couldn’t have been predicted purely by technicals. This crash was largely caused by Chinese fund managers selling their holdings, with large wallets entering risk-off mode, unwilling to take further losses. They, along with the Chinese government, sold off their SUI positions to prevent deeper damage—a case of “prevention is better than cure.”
During the recovery phase, exchanges executed significant buybacks, and because the price had fallen to major discounts, many market-making buyers placed strong limit orders at low levels, which helped drive the price back upward.
🪙On the weekly timeframe (SUI/BTC pair), this trading symbol has an extremely critical bottom—losing it could lead to a deep correction that would heavily impact SUI’s core structure. Thanks to buyer support and exchange buybacks, this bottom hasn’t yet been broken in the current weekly candle. There’s also a dynamic resistance trendline pressing down on its relative value; currently, SUI is in the final third of this price compression phase. If this trendline breaks, SUI could gain relative strength against Bitcoin and move upward.
🧠 Currently, SUI sits below its key resistance zone at $2.85. A break and daily close above this level could allow SUI to form a higher low compared to its flash crash bottom, retracing part of the recent drop and providing a better exit opportunity for many holders and traders.
This scenario will be updated with more precision and detail in future analyses.
❤️ Disclaimer : This analysis is purely based on my personal opinion and I only trade if the stated triggers are activated .
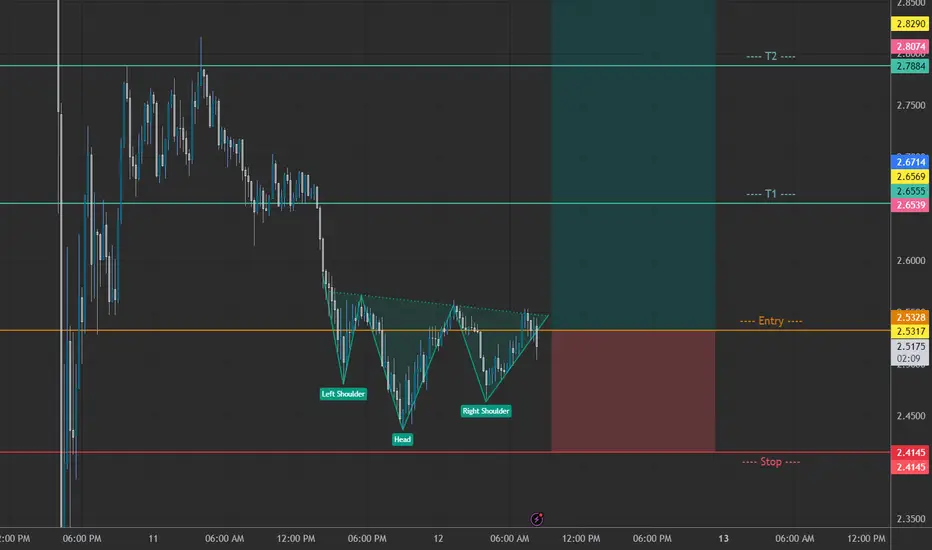
SUI 15m - Head and Shoulders LongNice H&S formation. Considerably Low risk. Only once price breaks at the neckline, I'll be entering long. My plan below:
Entry: 2.530
TP1: 2.655
TP2: 2.785
TP3: 3.033
SL: 2.410
Not advice. Safe trading!
TradeCityPro | SUI: Approaching Key Breakout From Channel👋 Welcome to TradeCity Pro!
In this analysis, I want to review the SUI coin for you, one of the coins that gained significant attention in 2024 and currently ranks 14th on CoinMarketCap with a market cap of $13.22 billion.
📅 Daily Timeframe
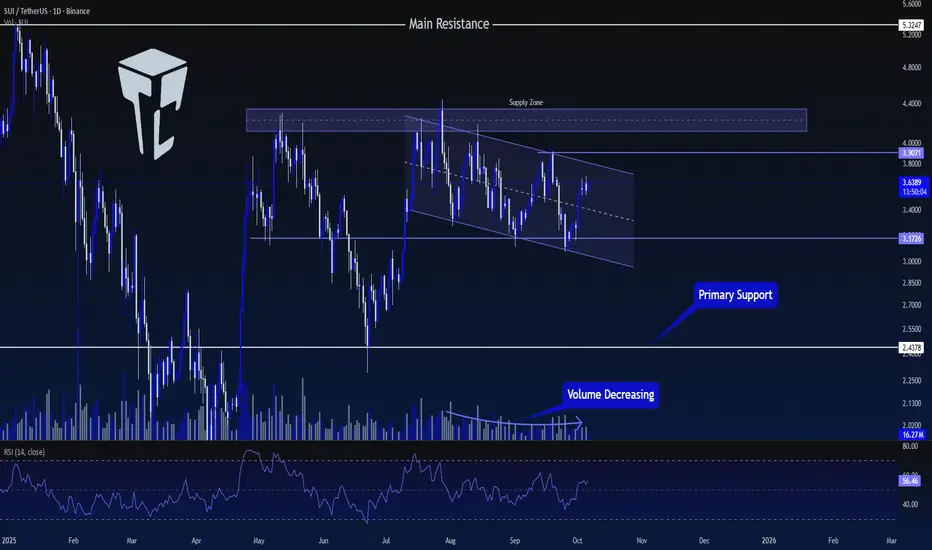
On the daily timeframe, this coin has formed a supply zone near $4, and for the past few months, the price has been struggling with it.
⭐ At the moment, after the latest rejection from this zone, a descending channel has formed, guiding the price slowly downward.
✅ The support level that the price has recently built is 3.1726, which has been tested twice, and now the price is moving toward the top of the channel.
🎲 If the channel breaks to the upside, we can consider opening a long position. The main bullish confirmation will come after breaking the upper resistance zone, but an early long position can be opened upon the breakout of 3.9071.
🔍 If the downward movement resumes and 3.1726 breaks, the move could extend to the next support area at 2.4378.
📝 Final Thoughts
Stay calm, trade wisely, and let's capture the market's best opportunities!
This analysis reflects our opinions and is not financial advice.
Share your thoughts in the comments, and don’t forget to share this analysis with your friends! ❤️
#SUI/USDT Bullish scenario#SUI
The price is moving within a descending channel on the 1-hour frame, adhering well to it, and is heading for a strong breakout and retest.
We have a bearish trend on the RSI indicator that is about to be broken and retested, which supports the upward breakout.
There is a major support area in green at 2.61, representing a strong support point.
We are heading for consolidation above the 100 moving average.
Entry price: 2.81
First target: 2.96
Second target: 3.11
Third target: 3.30
Don't forget a simple matter: capital management.
When you reach the first target, save some money and then change your stop-loss order to an entry order.
For inquiries, please leave a comment.
Thank you.

SUI/USDT ; A decline is the best buying opportunity.Hello friends
Given the price decline that we are witnessing, the price has created good channels at the specified support and buyers have entered and supported the price, which is a good sign for the currency.
Now, given the trend reversal and the price being pushed up by buyers, we can buy in steps with risk and capital management and move towards the specified targets.
We have also identified an important level that if the price reaches it, a correction can be expected and it is very important to take profits in these areas.
*Trade safely with us*
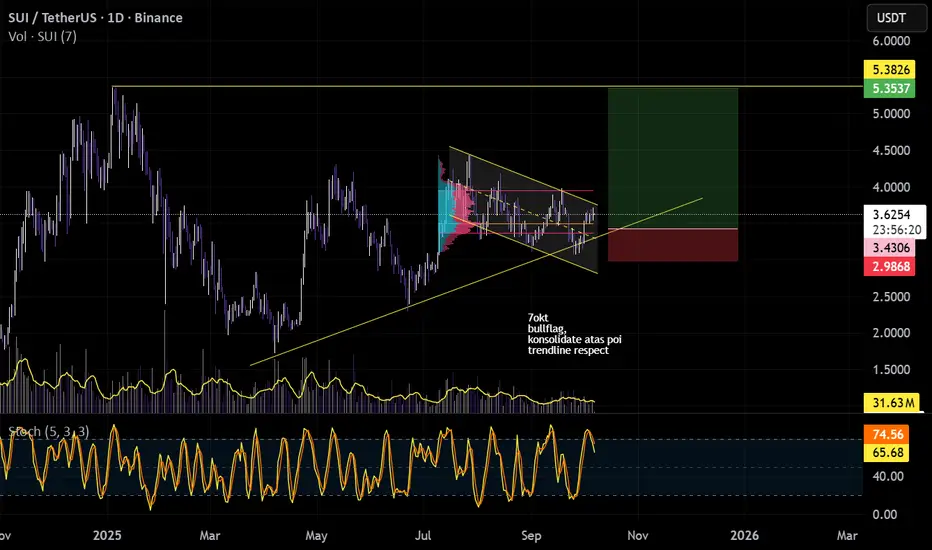
LONG SUIentry according to picture or market price
- consolidate above poi
- bullflag pattern
- trendline respect
- altszn incoming
- btc ath
- crypto sentiment bullish
- q4 rally
- ratecut
- lastpump
-btc.d downtrend
SUI Eyes 20% Rebound Toward Key Resistance at 3.78Hello✌️
Let’s analyze SUI’s price action both technically and fundamentally 📈.
🔍Fundamental analysis:
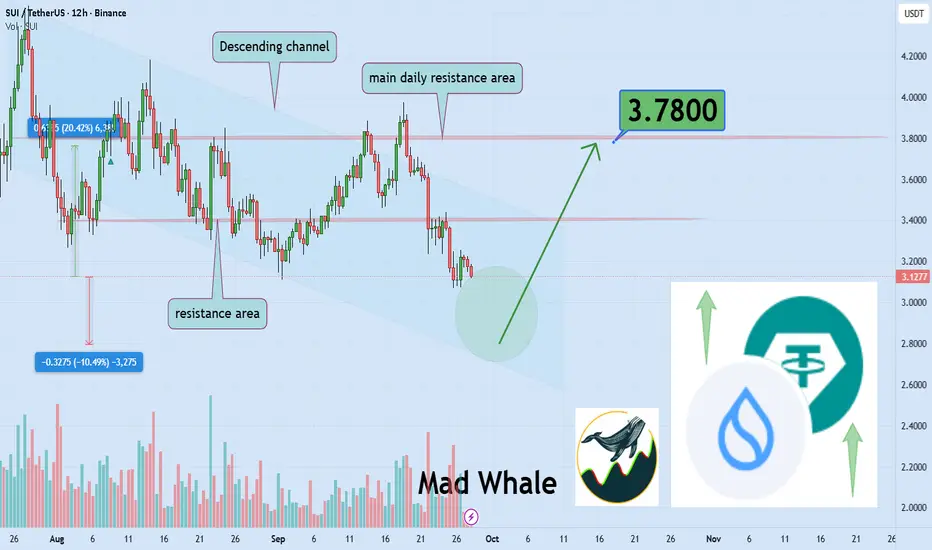
SEC is reviewing Spot SUI ETF proposals, and approval could bring big money from institutions. Past moves show SUI reacts strongly to ETF news, just like Bitcoin did.
📊Technical analysis:
SUI is currently moving within a descending channel, and as long as the lower boundary holds as support, a potential rebound of around 20% remains on the table, with the next key target located near 3.78$. 📉
📈Using My Analysis to Open Your Position:
You can use my fundamental and technical insights along with the chart. The red and green arrows on the left help you set entry, take-profit, and stop-loss levels, serving as clear signals for your trades.⚡️ Also, please review the TradingView disclaimer carefully.🛡
✨We put love into every post!
Your support inspires us 💛 Drop a comment we’d love to hear from you! Thanks, Mad Whale
SUI/USDT; BUYERS INHello friends
Given that the price has reached the specified support and the price is supported by buyers and the specified resistance has been broken, we can buy in steps with risk and capital management and move towards the specified goals.
*Trade safely with us*

SUI Bullish scenarioWatching SUI price retrace to possible support levels.
Potential for it to start a new bullish trend to the upside.
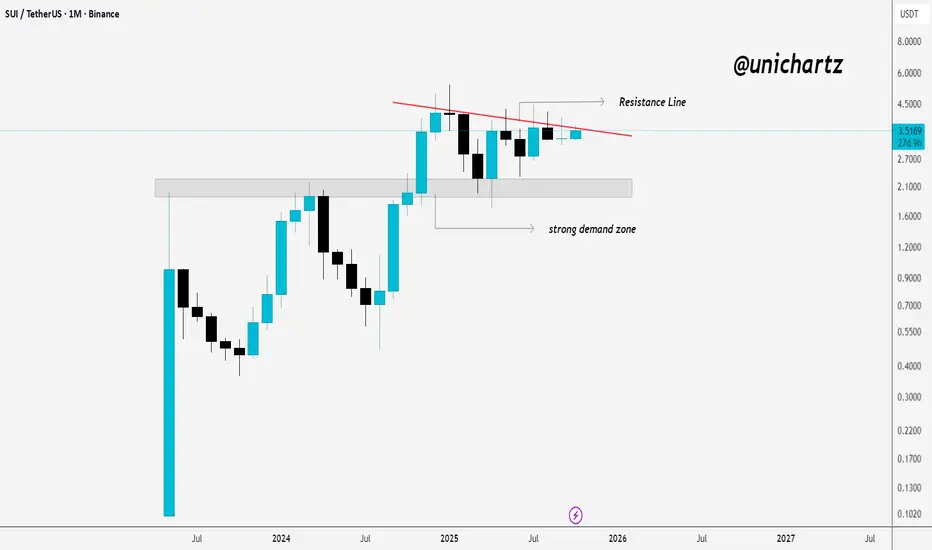
SUI Testing Monthly Resistance$SUI/USDT Monthly Chart
SUI is holding firm above the demand zone near $2.2, showing solid buyer interest. Price is now testing a descending resistance line that has capped previous rallies.
A monthly close above $3.8–$4 would signal a potential breakout and shift momentum toward the $5 zone. Until then, pullbacks to the demand area remain healthy for accumulation.
DYOR, NFA
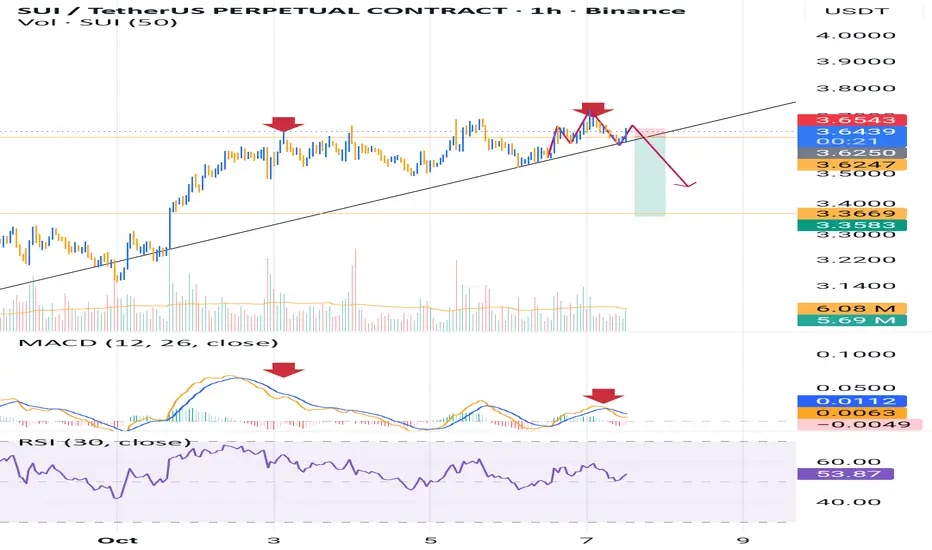
SUIUSDT potential breakdown?? Intraday playJournal entry #18
The market showing a bearish divergence,
A potential Head and shoulder pattern,
And a potential breakdown on the trendline.
We should patiently wait for a possible shorting play.
Disclaimer: this is my analysis and sharing it for educational purposes, likewise for my self journal/notes too.
SUI - BULLS IN PLAYCRYPTOCAP:SUI - update:
Neutral on the daily & H4.
Following my previous outlook , price is consolidating nicely above the previous 50% fib level!
Hence, Im bullish above 3.4500$ support.
Price may visit the 3.720 - 3.78$ level next! 📈
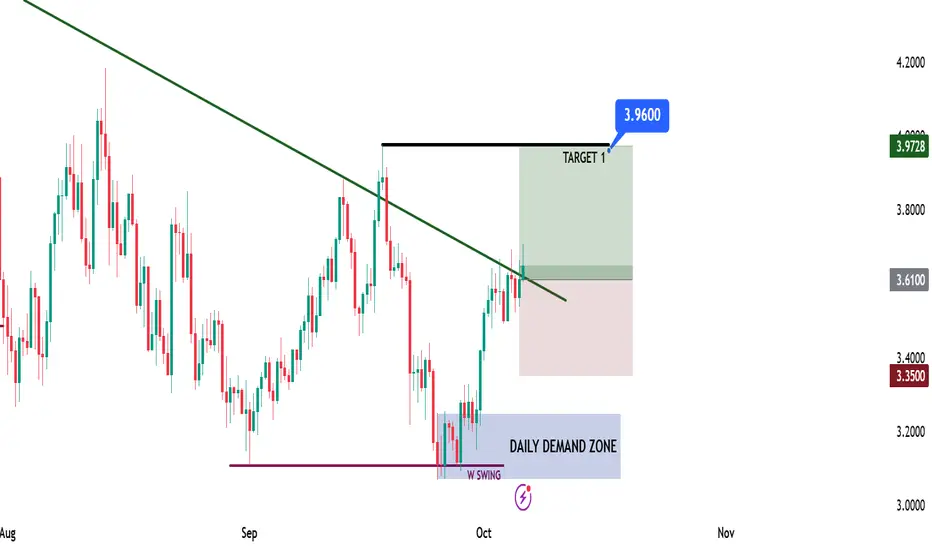
SUI Long Opportunity – DTB ModelSUI Long Opportunity – DTB Model
📊 Market Sentiment
FED has resumed its rate-cutting cycle with a 0.25% cut in September and two more expected. Institutional liquidity inflows are accelerating as the U.S. officially adopts crypto as part of its reserves. Despite persistent inflation, a weakening labor market is forcing the FED to ease, driving capital into risk-on assets like crypto.
📈 Technical Analysis
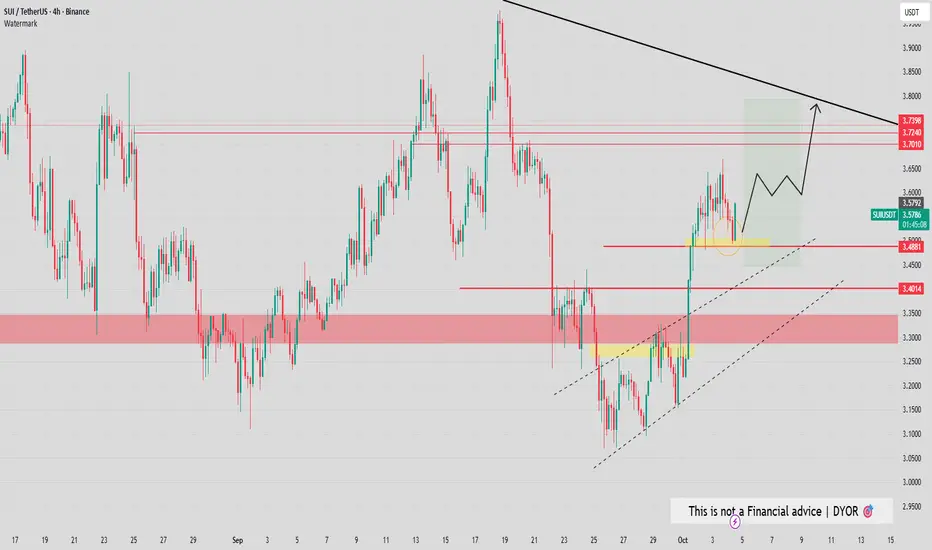
Price remains in a strong HTF bullish trend, so I’ll only be looking for long setups.
After running HTF swing liquidity, price broke structure and created a daily demand zone. The first tap to this zone generated a solid rejection, confirming its validity.
Recently, price closed above the LTF bearish trendline — signaling potential continuation for the next bullish leg.
📘 Model to be used – Demand Bounce to Trendline Break (DTB Model)
1-Identify the HTF trend and trade only in that direction.
2-Wait for a strong bounce from a confirmed demand zone.
3-Look for a break of the lower time frame bearish trendline.
4-Enter on breakout confirmation after two consecutive body closes.
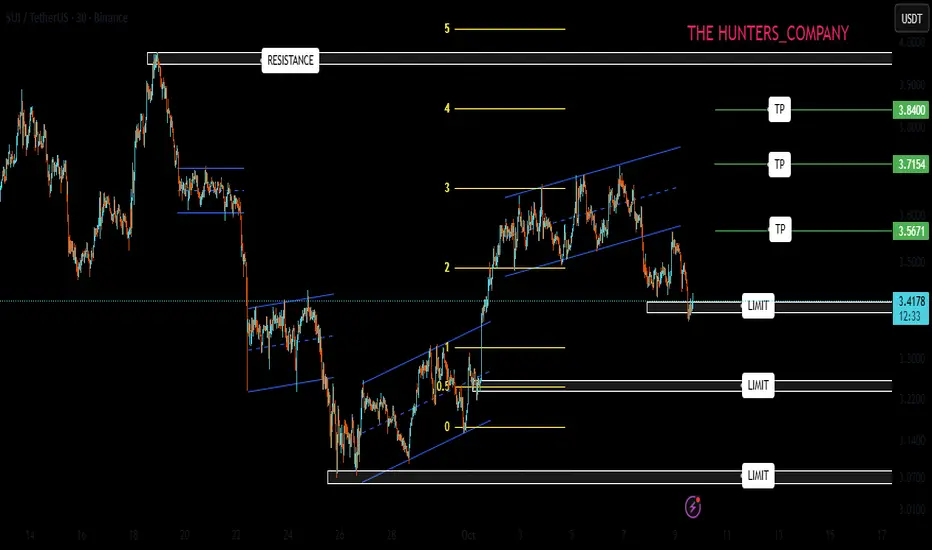
📌 Game Plan
Position entered after 4H trendline break confirmation (two body closes above). Entry taken around $3.61, aligning with HTF bullish bias and demand confluence.
🎯 Setup Trigger
4H body close confirmation above bearish trendline.
📋 Trade Management
Entry: $3.61
Stoploss: $3.35
Target: $3.96
💬 Like, follow, and comment if this breakdown supports your trading! More setups and insights coming soon — stay connected!
⚠️ Disclaimer: This content is for informational and educational purposes only and does not constitute financial, investment, or trading advice. Always DYOR before making any financial decisions.
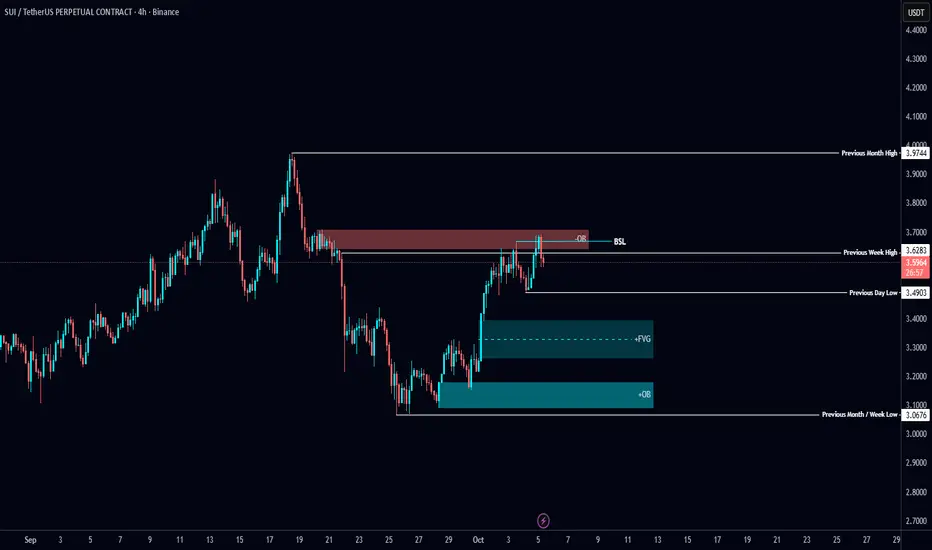
$SUI Analysis🚨 CRYPTOCAP:SUI Analysis 🚨
CRYPTOCAP:SUI just swept the BSL inside the bearish Order Block 👀
This opens the door for short setups from here 📉
📌 Key levels to watch:
Bullish FVG below
Bullish OB resting lower
Plenty of clean opportunities on both sides✅
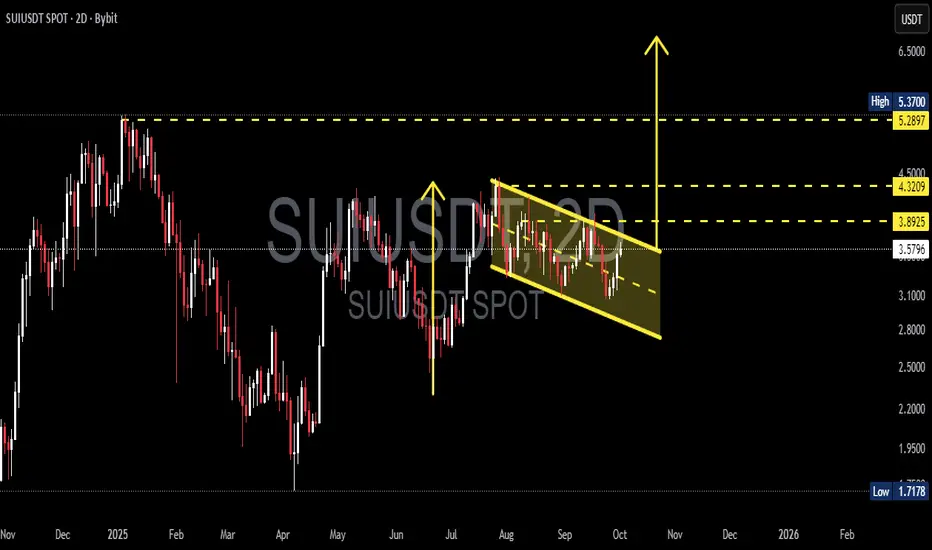
SUI/USDT — Bullish Flag, Consolidation Before the Next Rally?📌 Pattern Overview
SUI is currently forming a Bullish Flag pattern, which consists of:
Flagpole: the strong rally from June–July that pushed the price significantly higher.
Flag: a downward-sloping consolidation channel (descending channel) since August.
This pattern typically indicates a healthy pause after a strong uptrend, often followed by another bullish continuation.
---
🔍 Technical Analysis
Current Price: $3.58.
Upper flag line (resistance): around $3.89–$3.90.
Lower flag line (support): around $2.80.
Key horizontal levels: $3.89 → $4.32 → $5.29/$5.37 (previous high).
---
📈 Bullish Scenario (Valid Flag Breakout)
Confirmation: A breakout above the upper flag line with a strong 2D candle close and rising volume.
Flagpole projection target:
Previous flagpole measured from ~$2.0 → ~$5.3 = ~$3.3 move.
Breakout above ~$3.9 projects a target near $7.0 – $7.2.
Upside targets (step by step):
Target 1: $3.89 (first resistance).
Target 2: $4.32 (mid resistance).
Target 3: $5.29–$5.37 (previous top).
Extended target: $7.0 (flagpole projection).
Stop-loss: Below the breakout point or below the lower flag line (~$2.80).
---
📉 Bearish Scenario (Failed Flag)
Confirmation: Rejection at the upper flag line, or a breakdown below the channel.
Downside targets:
$2.80 (intra-flag support).
$2.20 → $1.72 (major support levels).
Extended target near $1.28 if a full breakdown occurs and the flag invalidates.
---
⚖️ Extra Confirmations
1. Volume: Breakout should be accompanied by a clear volume spike.
2. RSI: A move above 50–60 strengthens the bullish case.
3. MACD: Bullish crossover supports momentum continuation.
---
🎯 Conclusion
SUI is consolidating inside a Bullish Flag, a classic continuation pattern. A confirmed breakout could trigger a move towards $5.37, with an extended upside target near $7.0. Failure to break out, however, would bring price back to supports around $2.80 – $1.72.
Traders should wait for confirmation via candle close and volume before entering, and maintain strict risk management in case of pattern failure.
---
#SUI #SUIUSDT #Crypto #Altcoins #TechnicalAnalysis #BullishFlag #Breakout #PriceAction #CryptoTrading
#SUI/USDT mid-term I believe this one will pump#SUI
The price is moving within a descending channel on the 1-hour frame, adhering well to it, and is heading for a strong breakout and retest.
We have a bearish trend on the RSI indicator that is about to be broken and retested, which supports the upward breakout.
There is a major support area in green at 3.27, representing a strong support point.
We are heading for consolidation above the 100 moving average.
Entry price: 3.30
First target: 3.38
Second target: 3.46
Third target: 3.56
Don't forget a simple matter: capital management.
When you reach the first target, save some money and then change your stop-loss order to an entry order.
For inquiries, please leave a comment.
Thank you.

Long trade
1Hr Tf overview
📘 Trade Journal Entry
Pair: SUIUSDT.P
Date: Mon 13th Oct 25
Time: 10:30 am
Session: London → New York Session AM
Direction: Buyside Trade
Timeframe: 4-Hour
🔹 Trade Details
Entry: 2.8172
Profit Level: 3.2539 (+15.50%)
Stop Level: 2.7944 (–0.81%)
Risk-Reward (RR): 19.15
🔸 Technical Context
Model Type: Accumulation → Consolidation → Breaker Block → FVG Continuity
Narrative:
Price consolidated within a compression phase at the base of the prior liquidity sweep. The reaccumulation formed after a deep mitigation into a 4H FVG, aligning with the 50 EMA reclaim and VWAP equilibrium retest.
4Hr
CHOCH and BOS confirm directional shift from previous markdown.
FVG cluster at 2.80–2.85 served as the low-risk entry zone.
Volume expansion and liquidity absorption are evident around 2.81.
The target region is mapped to the prior imbalance and breaker block at 3.25
(HTF premium zone). Market structure gap fills coincide with 0.75 Fibonacci projection — confirming confluence for TP.
🧠 Sentiment Context
Market sentiment remains risk-on, as broader altcoin rotation regains traction after weeks of compression. The Fear & Greed Index showing recovery above 45 suggests returning investor confidence. SUI fundamentals (emphasis on scalable gaming-focused blockchain) further align with speculative inflows into high-throughput L1 ecosystems.
⏱️ Trade Management Notes
Entry confirmation via a break of micro-swing high and volume-backed displacement.
Partial profits recommended at 3.10 (mid-range liquidity). Continue monitoring reaction around 3.25 — a likely short-term distribution point before next accumulation.

$SUI Analysis 🚨 CRYPTOCAP:SUI Analysis 🚨
Watching both sides here 👀
📉 Short idea: looking for confirmation above PDH before entering
📈 Long idea: eyeing the demand zone — with an FVG sitting right above it for confluence
Just waiting for price to show its hand🔥
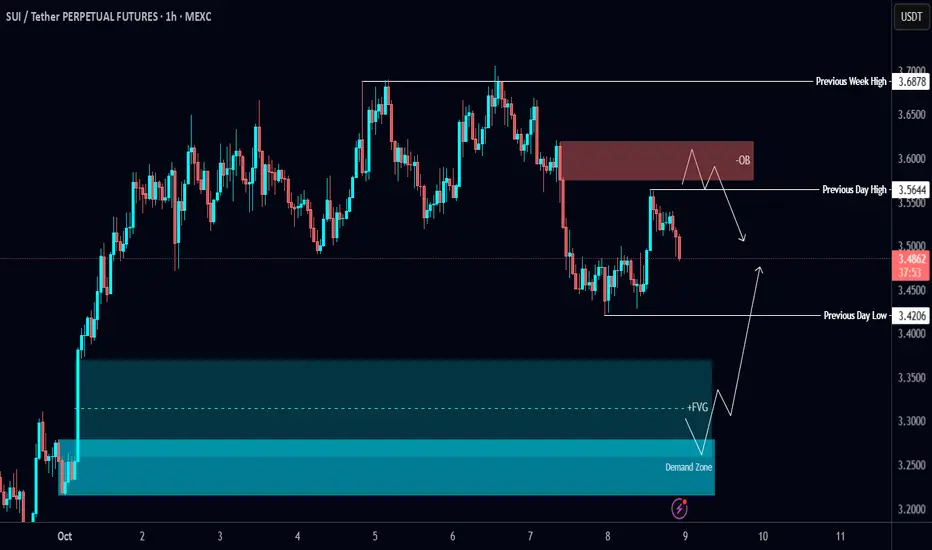
$SUI Analysis🚨 CRYPTOCAP:SUI Analysis 🚨
Watching for a clean setup here 👀
Ideally, I want to see a sweep of the PDL and a tap into the 4H FVG or demand zone before any upside move — that’s my long area 📈
Everything lines up nicely with the OTE zone too ✅

Sui false breakdown, ready to pumpSui show sign of strength pull back up from ytd drop.
Price action managed pullback up from wicked low, sp area from accumulation.
Price could be fire up and pump to the moon by trapping shorties.

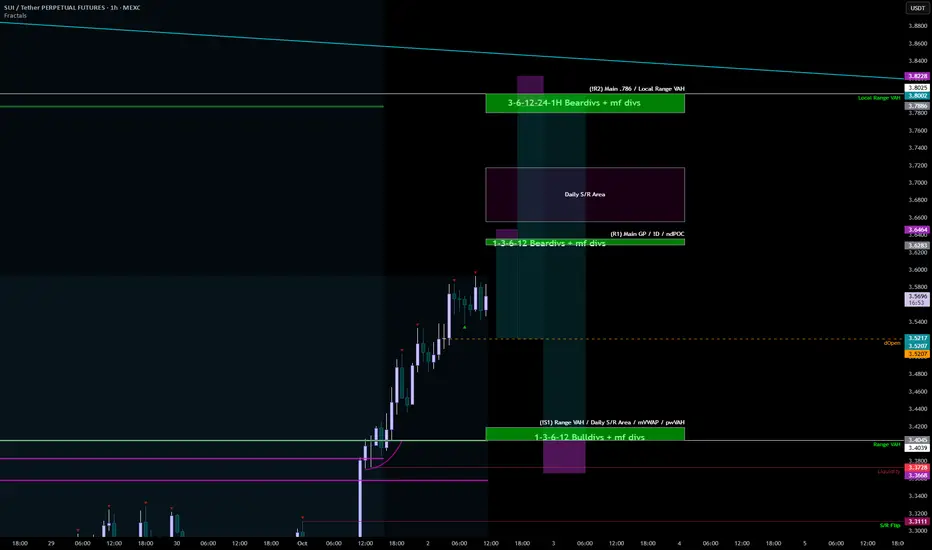
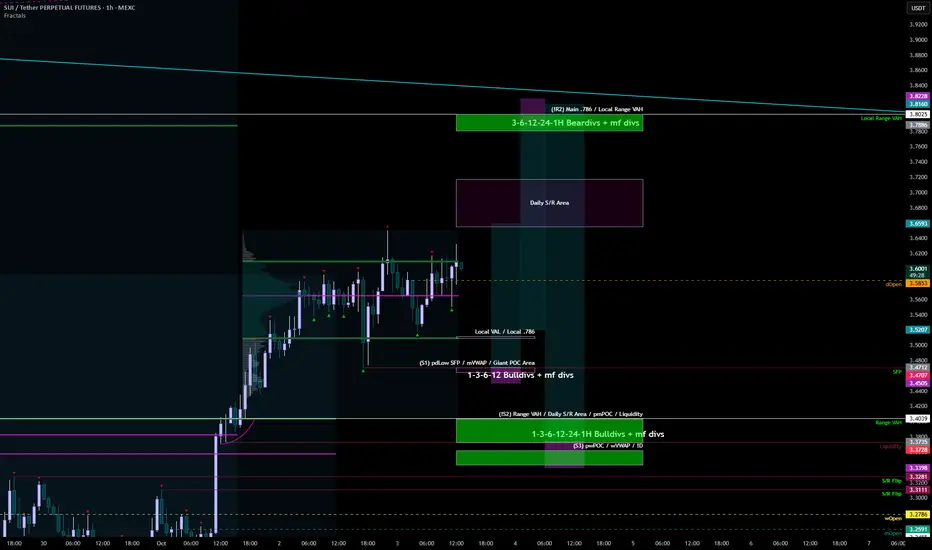
SUI 03.10R1 reacted yesterday at 10 PM, without any bearish divergences, even on LTF. We're moving in a strictly bullish direction, with the closest strong resistance already at 3.8. Locally, in theory, we could drop to S2, which we wouldn't want to lose for further growth.
Support zones:
3.465-3.47
3.403-3.372
3.343-3.362
Resistance zones:
3.78-3.8
4.05-4.1
SUI 02.10Just as the sol easily broke above the local overbought zone around 3.4, there was no retest, so S1 is where we can retest, and losing this support is highly undesirable for further growth. The nearest resistance zones are 3.63, 3.8, and the main resistance zone is 4.05-4.10.
Support zones:
3.40-3.42
Resistance zones:
3.628-3.635
3.78-3.8
4.05-4.1