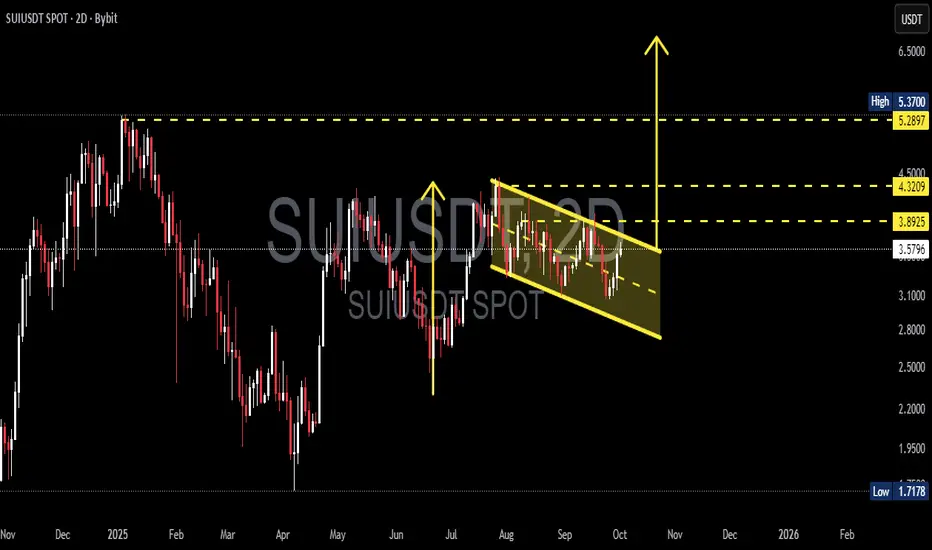
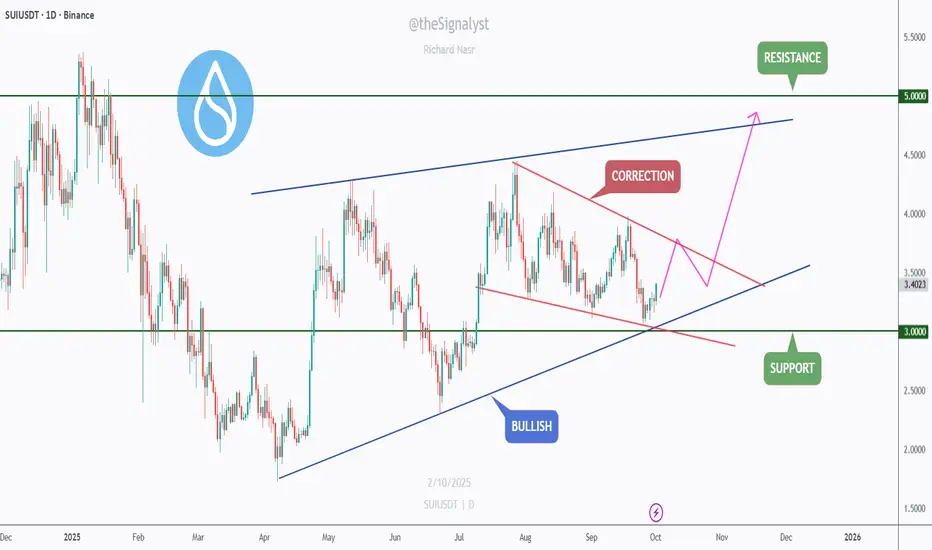
SUI/USDT — Bullish Flag, Consolidation Before the Next Rally?📌 Pattern Overview
SUI is currently forming a Bullish Flag pattern, which consists of:
Flagpole: the strong rally from June–July that pushed the price significantly higher.
Flag: a downward-sloping consolidation channel (descending channel) since August.
This pattern typically indicates a healthy pause after a strong uptrend, often followed by another bullish continuation.
---
🔍 Technical Analysis
Current Price: $3.58.
Upper flag line (resistance): around $3.89–$3.90.
Lower flag line (support): around $2.80.
Key horizontal levels: $3.89 → $4.32 → $5.29/$5.37 (previous high).
---
📈 Bullish Scenario (Valid Flag Breakout)
Confirmation: A breakout above the upper flag line with a strong 2D candle close and rising volume.
Flagpole projection target:
Previous flagpole measured from ~$2.0 → ~$5.3 = ~$3.3 move.
Breakout above ~$3.9 projects a target near $7.0 – $7.2.
Upside targets (step by step):
Target 1: $3.89 (first resistance).
Target 2: $4.32 (mid resistance).
Target 3: $5.29–$5.37 (previous top).
Extended target: $7.0 (flagpole projection).
Stop-loss: Below the breakout point or below the lower flag line (~$2.80).
---
📉 Bearish Scenario (Failed Flag)
Confirmation: Rejection at the upper flag line, or a breakdown below the channel.
Downside targets:
$2.80 (intra-flag support).
$2.20 → $1.72 (major support levels).
Extended target near $1.28 if a full breakdown occurs and the flag invalidates.
---
⚖️ Extra Confirmations
1. Volume: Breakout should be accompanied by a clear volume spike.
2. RSI: A move above 50–60 strengthens the bullish case.
3. MACD: Bullish crossover supports momentum continuation.
---
🎯 Conclusion
SUI is consolidating inside a Bullish Flag, a classic continuation pattern. A confirmed breakout could trigger a move towards $5.37, with an extended upside target near $7.0. Failure to break out, however, would bring price back to supports around $2.80 – $1.72.
Traders should wait for confirmation via candle close and volume before entering, and maintain strict risk management in case of pattern failure.
---
#SUI #SUIUSDT #Crypto #Altcoins #TechnicalAnalysis #BullishFlag #Breakout #PriceAction #CryptoTrading
Trade ideas
SUI 02.10Just as the sol easily broke above the local overbought zone around 3.4, there was no retest, so S1 is where we can retest, and losing this support is highly undesirable for further growth. The nearest resistance zones are 3.63, 3.8, and the main resistance zone is 4.05-4.10.
Support zones:
3.40-3.42
Resistance zones:
3.628-3.635
3.78-3.8
4.05-4.1
#SUI/USDT mid-term I believe this one will pump#SUI
The price is moving within a descending channel on the 1-hour frame, adhering well to it, and is heading for a strong breakout and retest.
We have a bearish trend on the RSI indicator that is about to be broken and retested, which supports the upward breakout.
There is a major support area in green at 3.27, representing a strong support point.
We are heading for consolidation above the 100 moving average.
Entry price: 3.30
First target: 3.38
Second target: 3.46
Third target: 3.56
Don't forget a simple matter: capital management.
When you reach the first target, save some money and then change your stop-loss order to an entry order.
For inquiries, please leave a comment.
Thank you.

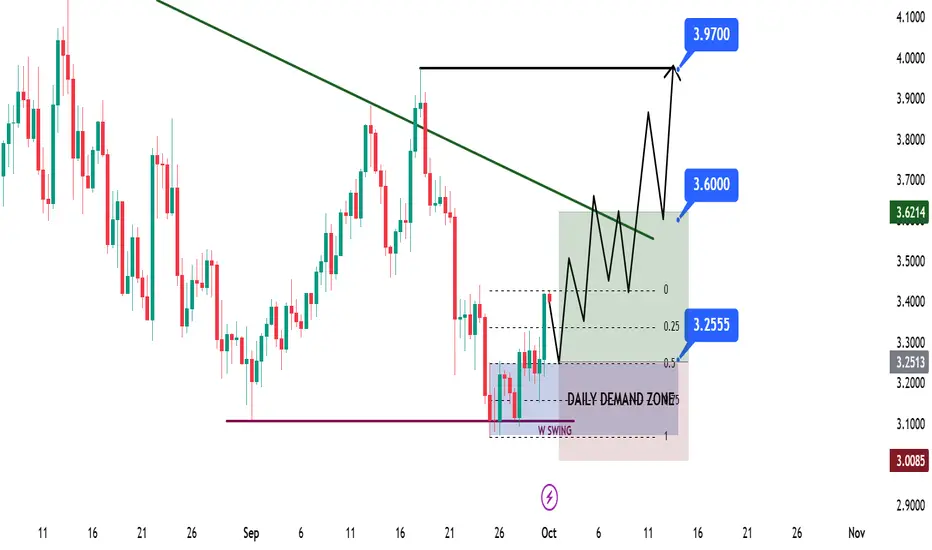
SUI Swing Long Opportunity - HDDZ Model SUI Swing Long Opportunity – HTF Demand w/ Discount Zone (HDDZ Model)
📊 Market Sentiment
FED has resumed its rate-cutting cycle, starting with a 0.25% cut in September, with two more expected. Institutional liquidity inflows have accelerated as the U.S. officially adopts crypto as part of its reserves. Despite elevated inflation, a weakening labor market is forcing the FED to ease, pushing more capital into risk-on assets.
📈 Technical Analysis
SUI is bullish on HTF, so only long setups are considered. Price recently swept the weekly swing liquidity and closed above, then broke market structure on LTF — confirming bullishness and creating a valid Daily Demand zone. Price has already tested this zone once and found rejection, validating its significance.
Currently, price is rejecting from the bearish LTF trendline above, which remains a key resistance. A retest of the confluence at 3.25$ (Daily Demand + Discount Zone) offers a strong setup for continuation higher.
📘 Model to be used – HDDZ (HTF Demand w/ Discount Zone)
In this model, I first confirm HTF bias. Then, I look for creation of HTF Demand zones. Finally, I use Fibonacci retracement to locate the discount zone. When both the demand zone and discount zone align, it creates a strong confluence for trade entries.
📌 Game Plan
1-Wait for price to revisit 3.25$ confluence zone.
2-Carry trade toward bearish LTF trendline, securing profits early if price rejects.
🎯 Setup Trigger
Entry confirmation once price hits 3.25$.
📋 Trade Management
Stoploss: 2.97$
Targets:
TP1: 3.61$
TP2: 3.97$
After TP1, move SL to breakeven to secure the position.
💬 Like, follow, and comment if this breakdown supports your trading! More setups and insights coming soon — stay connected!
⚠️ Disclaimer: This content is for informational and educational purposes only and does not constitute financial, investment, or trading advice. Always DYOR before making any financial decisions.
Here is the great place to buy SUI📍 Today, the price has broken the key resistance level of $3.36, which is a strong signal for the upcoming bullish trend. From this point, I expect the beginning of a new upward rally and the breakout of the trend line. The current level is suitable for entry
🎯 next targets are 3.9$, 4.3$, 4.8$

$SUI - Correction within an Uptrend: Eyes on $3.0 → $5.0SUI is respecting a broader rising structure while carving a descending correction (red channel/wedge) on the daily.
Price just bounced from the trendline + $3.00 support, a clean confluence area where bulls typically reload.
Trend context: Macro higher-lows intact (bullish). Micro still corrective until the wedge breaks.
Key levels
Support: $3.00 (structure + rising trendline)
Resistance: $3.55–$3.60 (wedge cap / first hurdle), then $5.00 (major ceiling)
Confluence 🔑
Rising blue trendline + horizontal $3.00 + corrective wedge = high-interest decision zone.
Scenarios
Bullish 📈Hold $3.00 and break above $3.55–$3.60 → momentum extension toward $4.20–$4.50, then the $5.00 range high.
Bearish 📉Daily close below $3.00 → risk of a deeper pullback before the uptrend resumes.
Do you think SUI clears the wedge on this attempt, or does it need one more higher-low above $3 first? 🤔
⚠️ Disclaimer: This is not financial advice. Always do your own research and manage risk properly.
📚 Stick to your trading plan regarding entries, risk, and management.
Good luck! 🍀
All Strategies Are Good; If Managed Properly!
~Richard Nasr
DeGRAM | SUIUSD fixed above the $3.2 level📊 Technical Analysis
● Price respects a broad descending channel but just bounced from the lower support line with a long-wick rejection; bullish divergence and a sequence of higher lows from June signal a turn.
● Break back above the mid-channel and a short bull flag point to a run toward the upper boundary/summer swing highs; invalidation below the last swing low and trendline.
💡 Fundamental Analysis
● Recent coverage highlights Sui’s fast-growing ecosystem and listings despite prior unlock risks; sentiment improved as builders/TVL expand and overhang fades.
✨ Summary
● Long SUI: buy pullbacks above trendline support; target the channel top / prior highs; watch the last swing low as a stop. Potential boosted by ecosystem growth noted in recent Yahoo/FxStreet reports.
-------------------
Share your opinion in the comments and support the idea with a like. Thanks for your support!
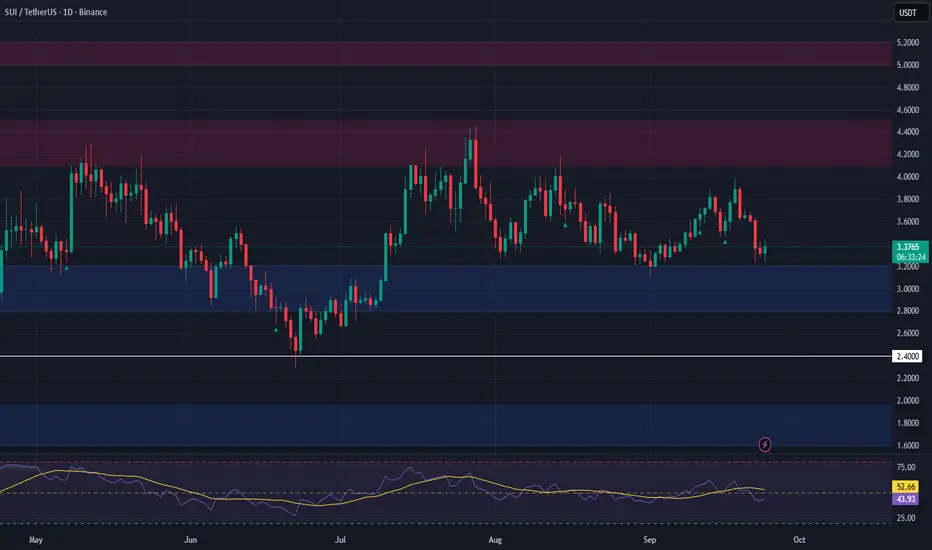
Sui market insightQuick summary
Right now SUI is trading around $3.18–$3.27 (mid-$3.2s) and overall the picture is sideways-to-slightly-bullish intraday, but mixed to neutral on the daily — momentum is not decisively trending.
Key indicator readouts (latest)
RSI (14): roughly ~48–57 depending on the feed/timeframe — near neutral territory (no strong overbought/oversold). This suggests range-bound behaviour rather than a strong trend.
MACD (12,26): slightly negative / near zero — weak bearish bias on some feeds but essentially flat — supports the “no clear momentum” view.
Moving averages: short-term MAs (MA5/MA10/MA20) are clustering near price (mixed buy/sell signals), MA50–MA200 are slightly above price on some feeds — overall moving averages give a neutral-to-mild-buy tilt intraday but not a strong trend. Example numeric MAs (Investing): MA5 ≈ 3.18–3.23, MA20 ≈ 3.22, MA50 ≈ 3.25, MA200 ≈ 3.25–3.29.
ADX: ~26–29 (near the 25 threshold) — indicates a weak-to-developing trend but not strong.
ATR(14): ~0.03–0.033 (USD) — current average true range suggests typical intraday volatility around ~$0.03. Use this for volatility-based stops.
Practical support / resistance / pivots (short-term)
Immediate support zone: $3.15–3.18 (recent intraday lows / pivot S1).
Immediate resistance: $3.29–3.32 (recent highs / pivot R1).
Key pivot median: ~$3.18–3.24 (price is oscillating around these).
(These pivot ranges come from the same technical tables / pivot outputs.)
Short-term trading setups (ideas, not advice)
Scalp / intraday (if you trade fast): look to buy quick pullbacks into $3.16–3.19 with a tight stop ~ATR × 1.5 (~$0.05 below entry) and target the next resistance $3.28–3.32 for a ~1:1–1.5:1 RR. Volume confirmation and price holding above MA10/MA20 improves odds.
Breakout (if price clears resistance): a clean daily close above $3.33 with rising volume and MACD turning positive would validate a bullish continuation; target measured moves using recent swing height.
Short / mean-reversion: if price fails to hold $3.15 with momentum and ADX rising, consider shorting toward the next structural support (watch liquidity/exchange spreads). Use ATR-based stops.
Risk management (practical)
Use position sizing so your max risk per trade ≤ 1–2% of equity.
Place stops visually beyond structure and scaled to ATR (e.g., stop = entry − 1.5–2 × ATR). With ATR ≈ $0.03, a 1.5× ATR stop ≈ $0.045.
How I’d watch this over the next 24–72 hours
Watch volume on moves above $3.29 or below $3.15 — volume confirms breakout/failure.
Watch MACD crossing and RSI moving decisively above 60 (bull) or below 40 (bear) for trend confirmation.
If ADX climbs >30 while price is moving, trend-following setups gain edge.
Sources & live-data references
I pulled live technical tables, moving averages, RSI/MACD/ATR and pivot levels from Investing.com (SUI/USD technical pages), and live price ticks from major exchanges / market aggregators.

SUI — Critical $3 ZoneSince completing its 5-wave impulse on July 28, SUI has been in a corrective phase for the past two months. The structure remains clean, with invalidation zones well-defined.
Looking ahead, there’s potential for an ascending triangle formation but for that to play out, it’s crucial that SUI holds the $3 psychological level.
Support Zone ($3.11–$2.93)
0.618 Fib retracement: $3.115
0.702 Fib retracement: $2.934
60 Weekly EMA $2.93 / SMA $3.036
Potential ascending triangle lower support line
📌 This is the last key support zone for bullish momentum. Losing it would break structure, holding it keeps the bullish case alive.
Resistance Zone ($4.12–$4.59)
Yearly Open (yOpen): $4.122 → key level bulls must reclaim
Swing Highs: $4–$4.5
0.786 Fib retracement: $4.59
15B Market Cap: $4.2
This area is loaded with resistance confluence and will act as the major target zone for longs.
🟢 Long Setup
Entry Zone: Between current price and $2.9 → ladder down into support
Stop-Loss: Below 0.702 Fib retracement
Take Profits: TP1 → $3.49, TP2 → $3.89, TP3 → $4.12 (yOpen)
R:R: ~1:4+
Potential Gain: +35%
This is a make-or-break zone for SUI. The $3 level is stacked with support confluences and must hold to keep the bullish structure intact. If bulls reclaim the yearly open at $4.122, momentum could carry toward $4.6.
🔍 Indicators used
DriftLine — Pivot Open Zones → For identifying key yearly/monthly/weekly/daily opens that act as major S/R reference points
Multi Timeframe 8x MA Support Resistance Zones → to identify support and resistance zones such as the weekly 60 EMA/SMA.
Fair Value Trend Model → Calculates a regression-based fair value curve
➡️ Available for free. You can find it on my profile under “Scripts” and apply it directly to your charts for extra confluence when planning your trades.
_________________________________
💬 If you found this helpful, drop a like and comment!

SUI's Momentum Picking Up SUI recently projected an equal lows or often called double bottom as seen in the 4H Timeframe. Also we can see a 4H trendline break and RSI going to the upside.
BTC has pumped( breaking 112.4 K into 114.1K ) on the NYSE Open on Monday(Sept.29,2025) and inclined the crypto sentiment into a recovery.
If the trend continues, we can expect SUI to reach the 0.382 and 0.5 levels on the range of 3.45-3.55 .
Traders, what are your thoughts?

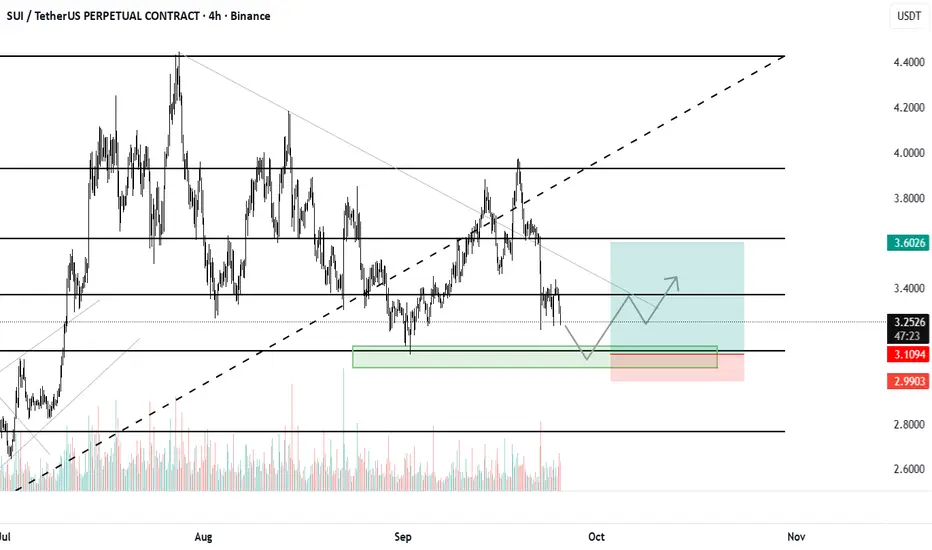
SUI 29.09Currently, it's hovering in the local neutral zone between the important resistance of 3.27-3.3 and 3.17-3.2. The only coin in my TDA toolkit that I believe hasn't reached the crucial zone around $3.00 and has reversed, also leaving a ton of liquidity.
Main trading zones: Longs S1, S3, S4 and Shorts R3, R4. The rest are scalps based on the situation.

SUIUSDT Forming Falling WedgeSUIUSDT is currently trading within a falling wedge pattern, a classic bullish reversal setup that often signals the end of a downtrend and the start of a new upward rally. The price has been consolidating in a narrowing range, reflecting reduced selling pressure and a potential buildup for a breakout. With good volume supporting this pattern, the technical outlook is strengthening, pointing towards a possible 40% to 50%+ gain in the near term once a confirmed breakout occurs.
The falling wedge indicates that bears are losing control while bulls are preparing to push prices higher. Historically, this pattern leads to strong rallies as traders and investors anticipate a shift in momentum. If SUIUSDT breaks through its key resistance levels, it could trigger significant buying interest, opening the way for a sharp upward move.
Investor attention towards this project has also been growing, which further reinforces the bullish outlook. Market sentiment, coupled with favorable technicals, suggests that SUIUSDT could be at the beginning of a potential trend reversal. This makes it an attractive opportunity for those monitoring breakout setups in the crypto market.
✅ Show your support by hitting the like button and
✅ Leaving a comment below! (What is You opinion about this Coin)
Your feedback and engagement keep me inspired to share more insightful market analysis with you!

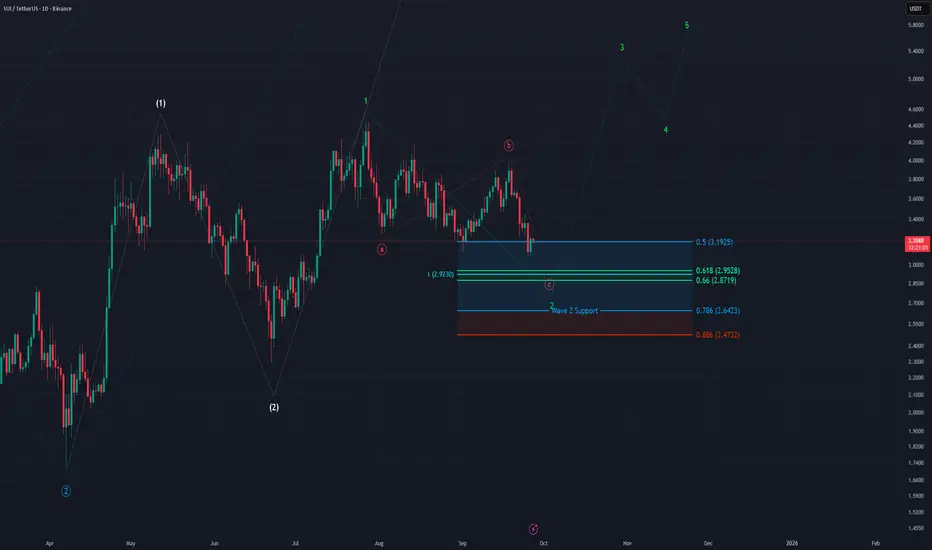
SUI - 1D Elliott Wave Analysis - 27.09.25Welcome
For SUI not much has changed, we are still looking for a multi 1-2 set up and a strong rally from the support area soon. We initially saw a bounce after the first touch of the support area but recently we came back to it which we just see as an extension of the correction in the red ABC. The next target for the red Wave C is the 1 to 1 FIB at 2.9230 USD which is within the golden pocket of the Wave 2 support area.
The green Wave 2 support area is between the 0.5 FIB at 3.1925 USD which we touched today and the 0.786 FIB at 2.6424 USD. A break below this area suggest a reset of the white Wave 2 or something more bearish. If this set up hold we are looking to see a strong Wave 3 rally afterwards which would take us to a new ATH.
Thanks for reading.
NO FINANCIAL ADVICE.
SUIUSDTThe overall trend is bearish BINANCE:SUIUSDT , but the 2.90 USD area seems to be a crucial level for a potential trend reversal, with a possibility of price bouncing back. The price is currently near the initial support at 2.92 USD, and it is likely to move upwards in reaction to this level. A buy signal is triggered at 2.9264 USD with a stop loss at 2.77 USD. The next price targets are 3.250 USD, 3.600 USD, 3.800 USD, and 4.28 USD.
📈 Buy Signal: Entry at 2.9264 USD
🚫 Stop Loss: 2.77 USD
🎯 Targets: 3.250 USD | 3.600 USD | 3.800 USD | 4.28 USD

Sui short to $3.00Just opened up a short on sui. Aiming for $3.00 area
sl: 3.27
Potential early targets on chart $3.089, $3.04
Time sensitive
2 RR if full tp gets hit

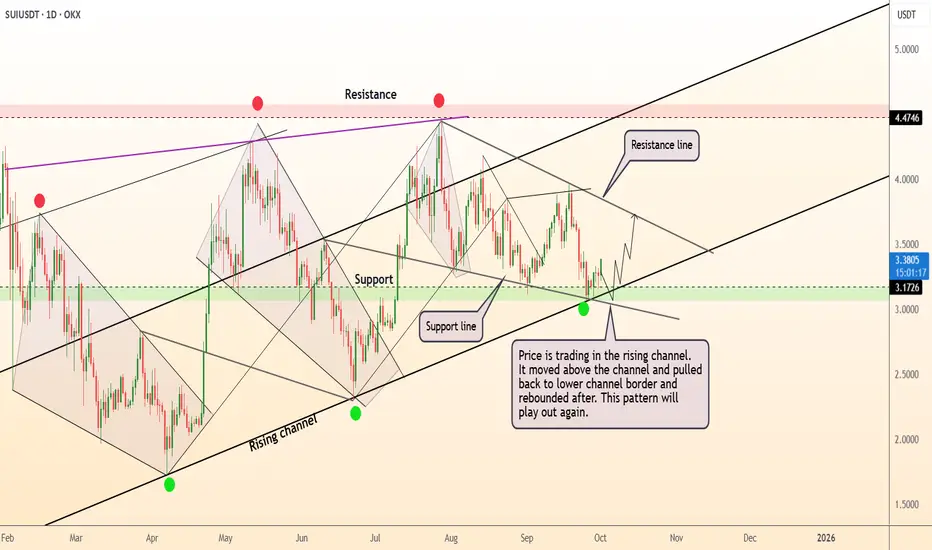
Sui (SUI): Still Supreme Bullish Setups Building Up HereSUI continues to respect the bullish channel, with the price holding above the midline and defending the EMAs during recent volatility.
The game plan remains the same: as long as the channel holds, the upside structure is intact, and we’ll be looking for continuation toward higher targets. A breakout above $4 would confirm momentum picking up, while losing this channel would shift our attention back to the lower support zone.
Swallow Academy
$sui chart analysis Sui correcting and almost in our entry zone i will be taking long entry with tight stop loss from marked zones. it has to flip that trend line for even bullish structure.
SUI Swing Trade Setup – Accumulation at Key SupportSUI has retraced to a major support zone, presenting a potential long swing setup. Price action is showing signs of a possible base, with another dip into early September likely before a reversal.
The strategy here is to ladder into long positions between $2.80–$3.20, aiming for a bounce toward previous resistance zones. Risk is managed with a tight invalidation below the last major support.
• Entry Zone: $2.80–$3.20
• Targets: $4.10–$4.50, $5.00–$5.20
• Stop Loss: Below $2.40
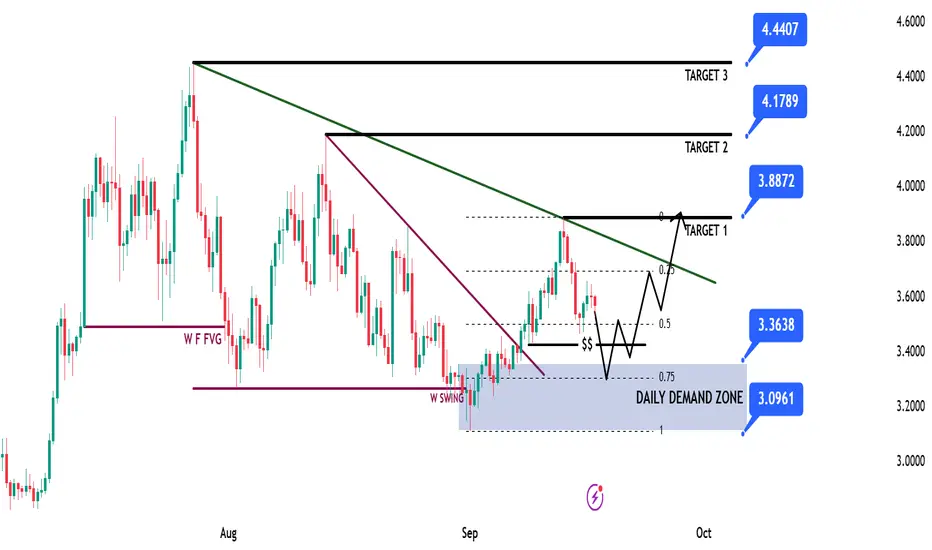
SUI Game Plan - Suinetwork📊 Market Sentiment
Market sentiment remains strongly bullish as the FED is expected to deliver a 0.25% rate cut, with speculation building for a possible 0.5% cut in September. Monetary policy shifts are being driven by both inflation trends and weakening labor market data. The latest August and September job reports were soft, signaling that the economy is cooling rapidly. This environment continues to fuel expectations for a major bullish run in the weeks ahead.
📈 Technical Analysis
Price is on HTF bullish trend so we will be looking only long setups.
Price ran HTF liquidity and closed above then broke the market on daily-weekly timeframe, creating the Daily Demand Zone.
Moreover, price broke the bearish trendline and closed above, giving strong upward momentum. Now price is retracing back into the Daily Demand Zone.
📌 Game Plan
1-Price to hit back to Daily Demand Zone
2-Price to hit possibly 0.75 max discount range zone. If not, I’ll still enter with LTF confirmation.
🎯 Setup Trigger
4H break of structure after hitting 3.36$ level. I won’t enter unless I see the 4H BOS.
📋 Trade Management
Stoploss: Below 4H swing low responsible for BOS
Targets:
TP1: 3.88$
TP2: 4.17$
TP3: 4.44$
💬 Like, follow, and comment if you find this setup valuable!
⚠️ Disclaimer: This content is for informational and educational purposes only and does not constitute financial, investment, or trading advice. Always DYOR before making any financial decisions.
SUI/USDTBINANCE:SUIUSDT has dropped right to the intersection of its ascending support and horizontal support zone.
This is a key demand area where buyers could step in and take control.
As long as SUI stays above $3.11, there’s no major concern yet.
I’ll update if needed.

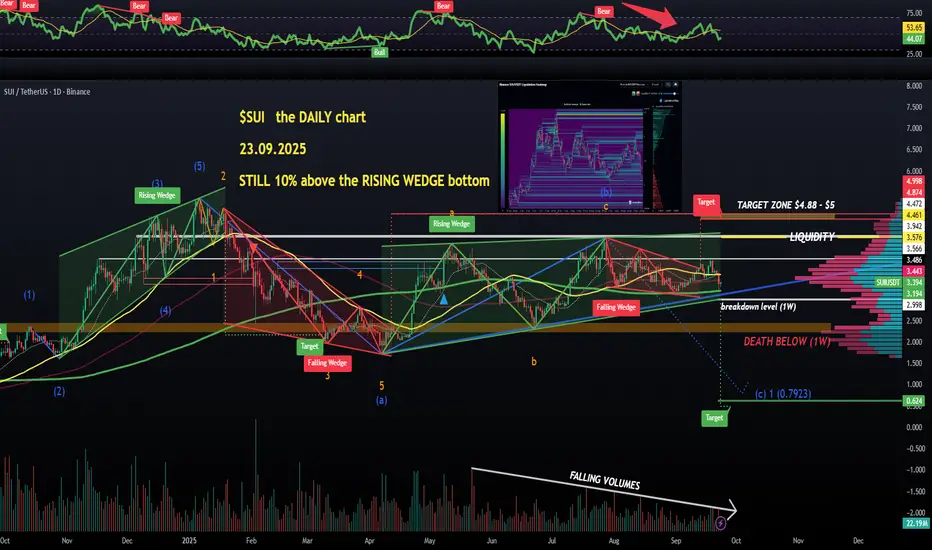
$SUI the DAILY chart: still in a troublesome RSING WEDGEOkay, so I did drop the CRYPTOCAP:SUI weekly timeframes analysis yesterday (see the post I'm quoting), and this asset was showing a 5-month old bearish RISING WEDGE, so here I am zooming in on the DAILY chart for a more detailed view.
The wedge remains the main focus on the daily chart and a closer look is telling us that the lower trendline of this pattern is supported by the 200 MA (green line at $3.19 atm).
200 MA on 1D is widely considered as a BULL/BEAR market division line, so we really don't want to lose this RISING WEDGE/200 MA.
Now for any BULLISH moves, we first MUST see a breakout above $3.95. That will make the price action bullish on all smaller timeframes. Obviously nothing good will happend until CRYPTOCAP:BTC dominance starts showing weakness.
Based on the WEEKLY and DAILY alone, I'm not going to get involved with #SUI🔥 until it starts showing ACTUAL strenght.
For example, the volumes need to start picking up, the way they have been.. Falling volumes are never good for the BULLS👽💙
SUIUSDT #001 ( You see what I see ? ) Hello dear traders.
Good days .
First of all thanks for your support and comments.
——————————————————————————
On Bullish weekly Gann square SUIUSDT , I can see the collecting spring for breaking 0.5 Gann square price zone . On daily time frame as you can see after finishing Bearish Gann Square bullish move on bullish Gann Square filled 0.75 up to 1 of Gann Box price level which it’s repeated in all cycles .
On daily bearish Gann square price correct itself up to 0.75 Gann price level and aspected with small decline to the 0.5 Bearish Gann Square ( about 3.45$ - 3.55$ ) will be good opportunity for next Bull run .
In detail buy zone will updated .
Good luck and safe trades.

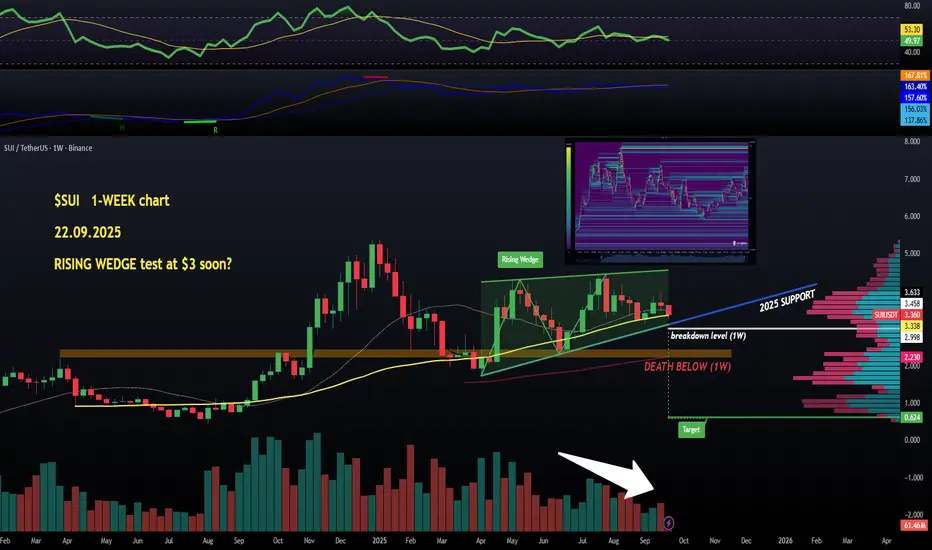
$SUI - RSISNG WEDGE test at $4 soon?Alright, so CRYPTOCAP:SUI is the most requested coin for me to cover, let's go starting with the WEEKLY view, the DAILY, 4-hour and the HOURLY charts in next posts later on this evening.
So the weekly has got one chart pattern to worry about, the 5-month-old RISING WEDGE which is basically a red flag despite making higher highs and higher low (bullish market structure intact).
#SUİ is still a touch above the yellow (50 MA) line, and key levels to watch are the $3 mark (breakdown level) and the blue rising support. We really don't want to lose any of these levels.
Actually, I will look for some shorts below $3.
Liquidity wise, not much to clear below the price, and a lot of it above the last local highs. See the attached Liquidity Map.
Next posts to continue the analysis on shorter timeframes☝️👽