SUNUSDT 12H#SUN has broken above the falling wedge pattern on the 12H timeframe chart and is currently facing the Ichimoku cloud and the 12H SMA100, which may cause a pullback to retest the wedge. In case of a breakout above these levels, the potential targets are:
🎯 $0.02287
🎯 $0.02416
🎯 $0.02545
🎯 $0.02674

How Market Fluctuations Shape the Global Economy1. Understanding Fluctuations in the Global Economy
Fluctuations refer to periodic or unpredictable changes in economic indicators such as GDP growth, employment levels, inflation, or market prices. These shifts can be short-term (cyclical), medium-term (structural), or long-term (systemic).
Types

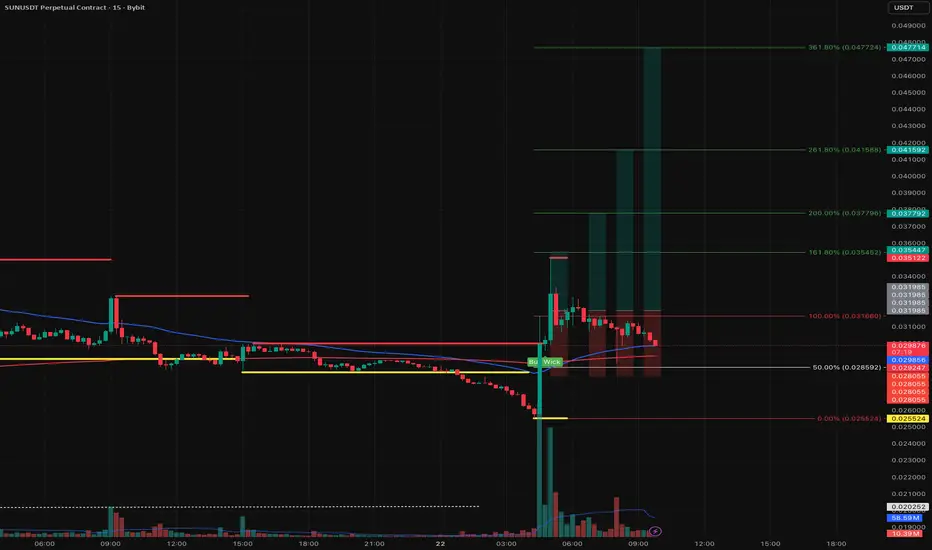
Quick Scalp or Just a Dump?Market’s showing some dumping pressure right now, but that also opens the door for a fast recovery. This is a pure scalp setup — could play out in just minutes.
High risk, quick trade, nothing long-term — but sometimes these fast ideas are worth a shot. Let’s see how it works out! 👀🔥
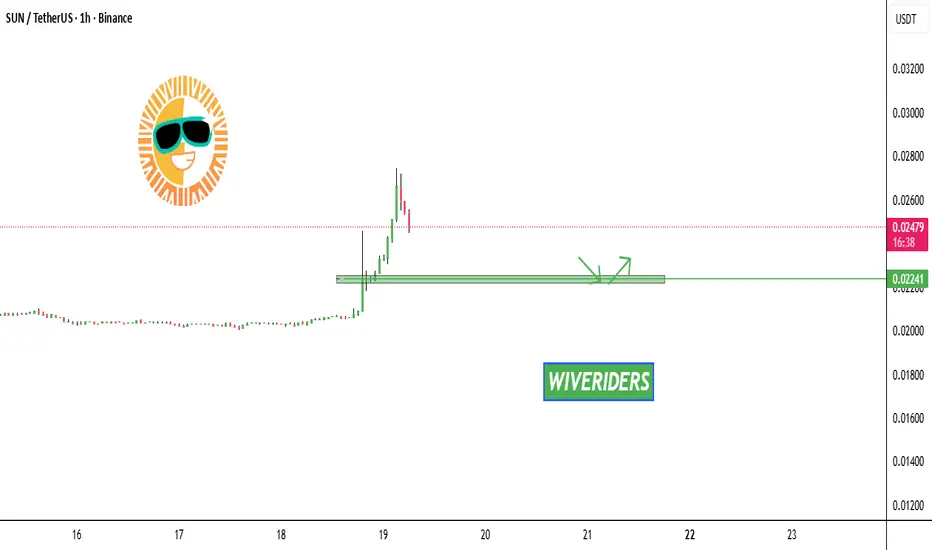
SUN Market Update📊 NYSE:SUN Market Update
📉 If SUN retraces to the 🟢 green zone level, it could provide a better 🎯 entry or re-entry opportunity with confirmation — where buyers previously accumulated.
SUN/USDT ENTERING INTO IMPORTANT INCREASE BOXthere’s a good chance we could see SUN/USDT increase in the coming timeframes, as an important TA cross signals a potential new trend breakout. However, this will depend on the data
Reason of follow is the high chance of break.

Explode Your Gains: Epic $SUN Trading Breakthrough Awaits!BINANCE:SUNUSDT
Explode Your Gains: Epic NYSE:SUN Trading Breakthrough Awaits!
Key Patterns:
The uptrend forms a clear parabolic rise with increasing volatility (longer wicks on candles).
The downtrend resembles a "dump" phase, with a near-vertical drop, possibly driven by profit-taking or ma
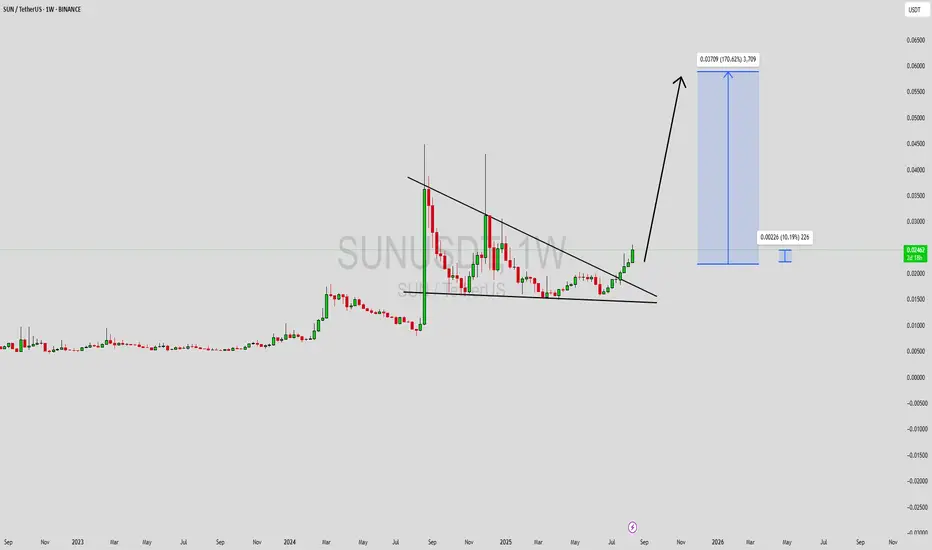
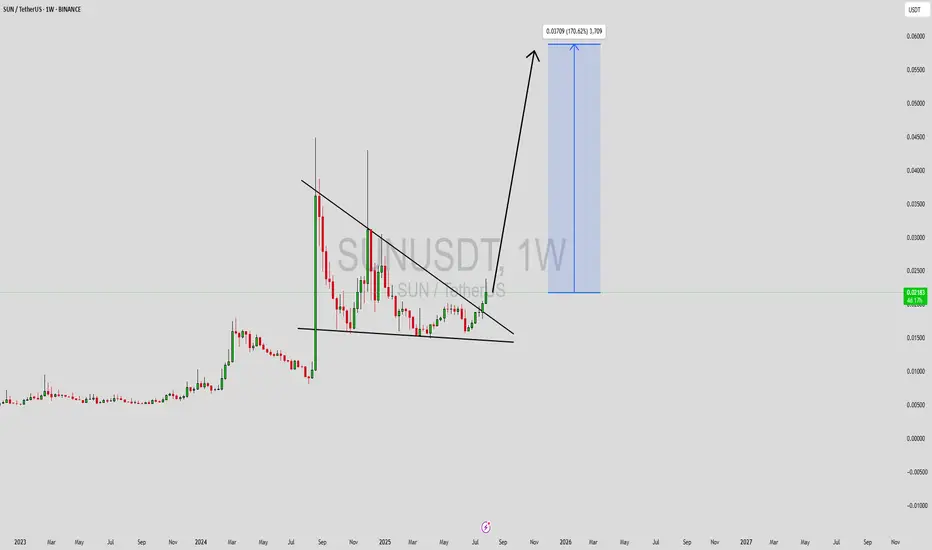
SUNUSDT Forming Descending TriangleSUNUSDT is showing a strong bullish breakout from a long-term descending triangle, a formation that often precedes explosive price action. The weekly chart reveals a sustained breakout above the multi-month trendline resistance, indicating a shift in market structure and signaling that bulls are gai
Sun Token Prepares Major Rise · No ResistanceSun Token (SUN) has been rising. It has been rising short-term, long-term and at all times. It has been green now seven weeks and I am publishing because I see a major advance starting. Something like August 2024 or February-March 2024. Something like this.
SUNUSDT hit bottom November 2022 and it h

SUNUSDT Forming Potential BreakoutSUNUSDT is currently forming a promising potential breakout pattern that traders and investors should closely watch. The price action has shown a period of consolidation near key support zones, building a strong base for a potential explosive move. With volume gradually increasing and bulls taking c
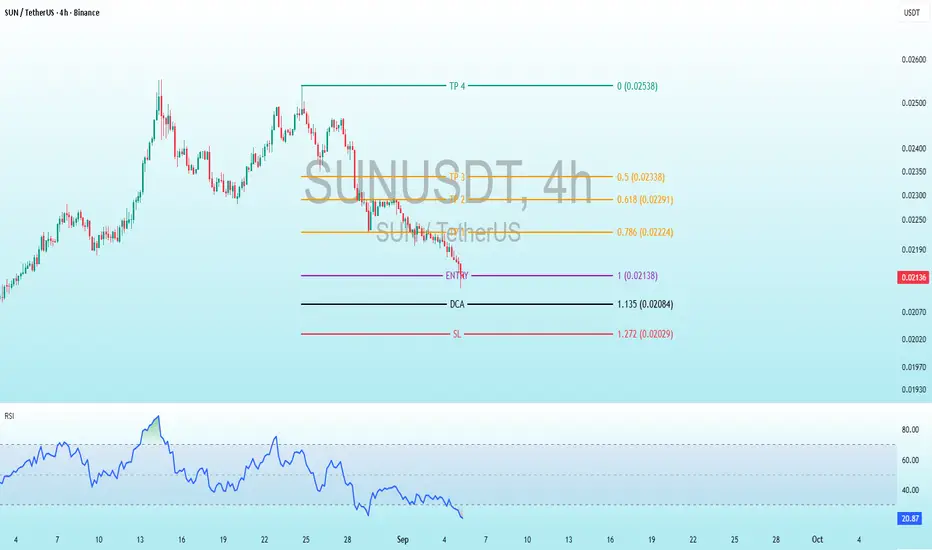
SUN Bearish DivergenceBINANCE:SUNUSDT
Trade Setup:
Target 1: 0.01978 (0.50 Fibonnaci Golden Zone).
Target 2: 0.01883 (0.618 Fibonnaci Golden Zone).
Target 3: 0.01747 (0.786 Fibonnaci Golden Zone).
Target 4: 0.01574 (1 Fibonnaci).
Stop Loss: 0.02382 (above recent high, ~25% above current price).
RSI Analysis: The RSI

See all ideas
Summarizing what the indicators are suggesting.
Oscillators
Neutral
SellBuy
Strong sellStrong buy
Strong sellSellNeutralBuyStrong buy
Oscillators
Neutral
SellBuy
Strong sellStrong buy
Strong sellSellNeutralBuyStrong buy
Summary
Neutral
SellBuy
Strong sellStrong buy
Strong sellSellNeutralBuyStrong buy
Summary
Neutral
SellBuy
Strong sellStrong buy
Strong sellSellNeutralBuyStrong buy
Summary
Neutral
SellBuy
Strong sellStrong buy
Strong sellSellNeutralBuyStrong buy
Moving Averages
Neutral
SellBuy
Strong sellStrong buy
Strong sellSellNeutralBuyStrong buy
Moving Averages
Neutral
SellBuy
Strong sellStrong buy
Strong sellSellNeutralBuyStrong buy
Displays a symbol's price movements over previous years to identify recurring trends.