How Market Fluctuations Shape the Global Economy1. Understanding Fluctuations in the Global Economy
Fluctuations refer to periodic or unpredictable changes in economic indicators such as GDP growth, employment levels, inflation, or market prices. These shifts can be short-term (cyclical), medium-term (structural), or long-term (systemic).
Types
Related pairs

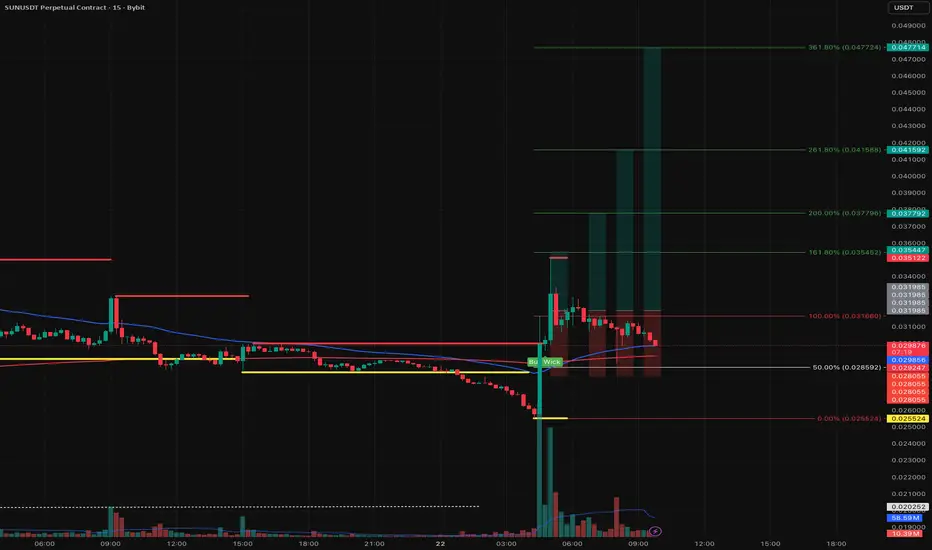
Quick Scalp or Just a Dump?Market’s showing some dumping pressure right now, but that also opens the door for a fast recovery. This is a pure scalp setup — could play out in just minutes.
High risk, quick trade, nothing long-term — but sometimes these fast ideas are worth a shot. Let’s see how it works out! 👀🔥
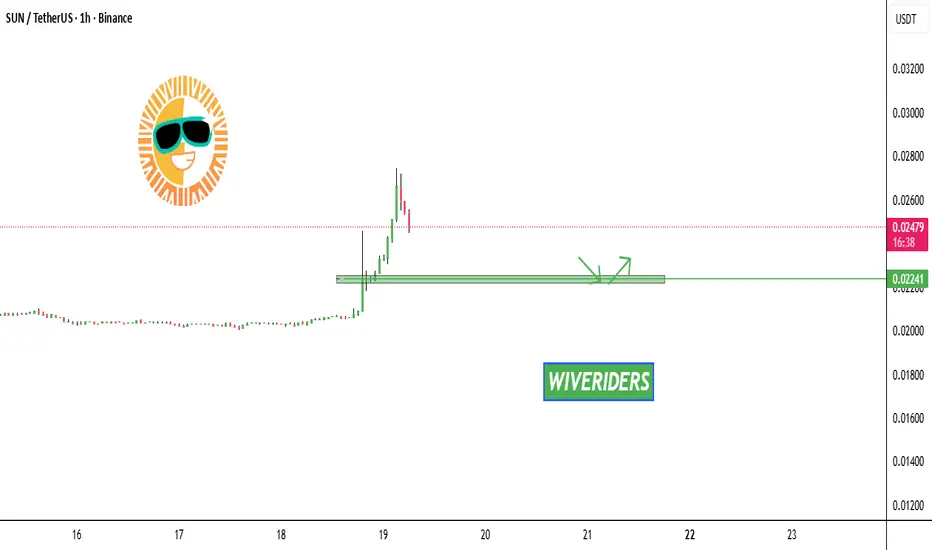
SUN Market Update📊 NYSE:SUN Market Update
📉 If SUN retraces to the 🟢 green zone level, it could provide a better 🎯 entry or re-entry opportunity with confirmation — where buyers previously accumulated.
SUN/USDT ENTERING INTO IMPORTANT INCREASE BOXthere’s a good chance we could see SUN/USDT increase in the coming timeframes, as an important TA cross signals a potential new trend breakout. However, this will depend on the data
Reason of follow is the high chance of break.

Explode Your Gains: Epic $SUN Trading Breakthrough Awaits!BINANCE:SUNUSDT
Explode Your Gains: Epic NYSE:SUN Trading Breakthrough Awaits!
Key Patterns:
The uptrend forms a clear parabolic rise with increasing volatility (longer wicks on candles).
The downtrend resembles a "dump" phase, with a near-vertical drop, possibly driven by profit-taking or ma
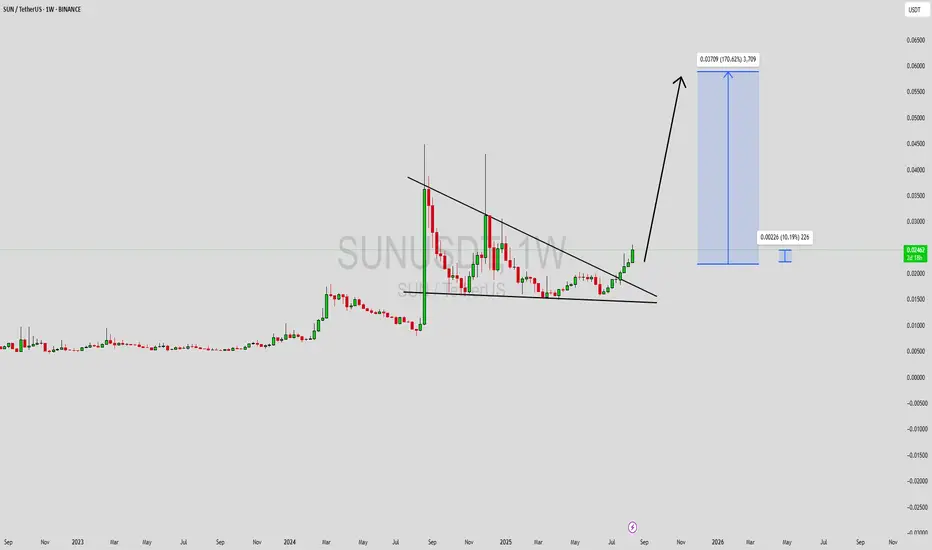
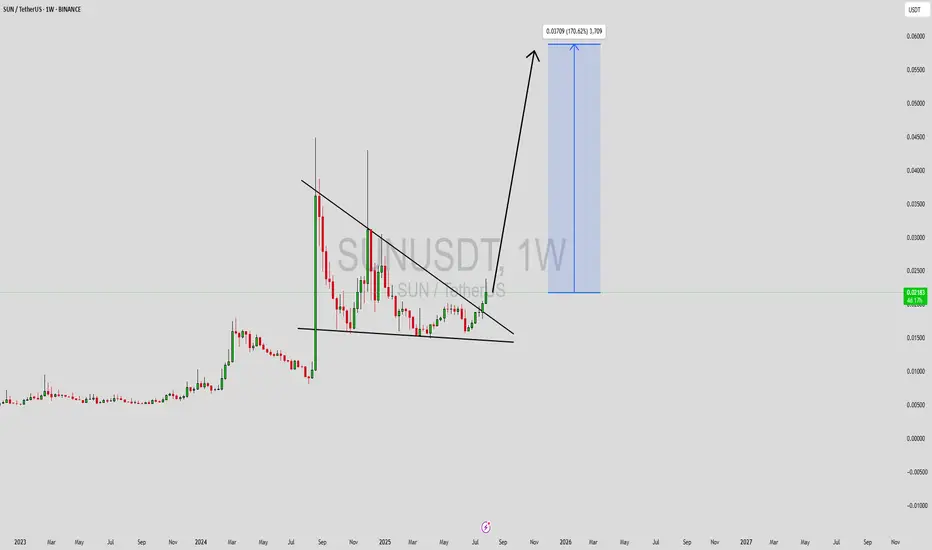
SUNUSDT Forming Descending TriangleSUNUSDT is showing a strong bullish breakout from a long-term descending triangle, a formation that often precedes explosive price action. The weekly chart reveals a sustained breakout above the multi-month trendline resistance, indicating a shift in market structure and signaling that bulls are gai
Sun Token Prepares Major Rise · No ResistanceSun Token (SUN) has been rising. It has been rising short-term, long-term and at all times. It has been green now seven weeks and I am publishing because I see a major advance starting. Something like August 2024 or February-March 2024. Something like this.
SUNUSDT hit bottom November 2022 and it h

SUNUSDT Forming Potential BreakoutSUNUSDT is currently forming a promising potential breakout pattern that traders and investors should closely watch. The price action has shown a period of consolidation near key support zones, building a strong base for a potential explosive move. With volume gradually increasing and bulls taking c
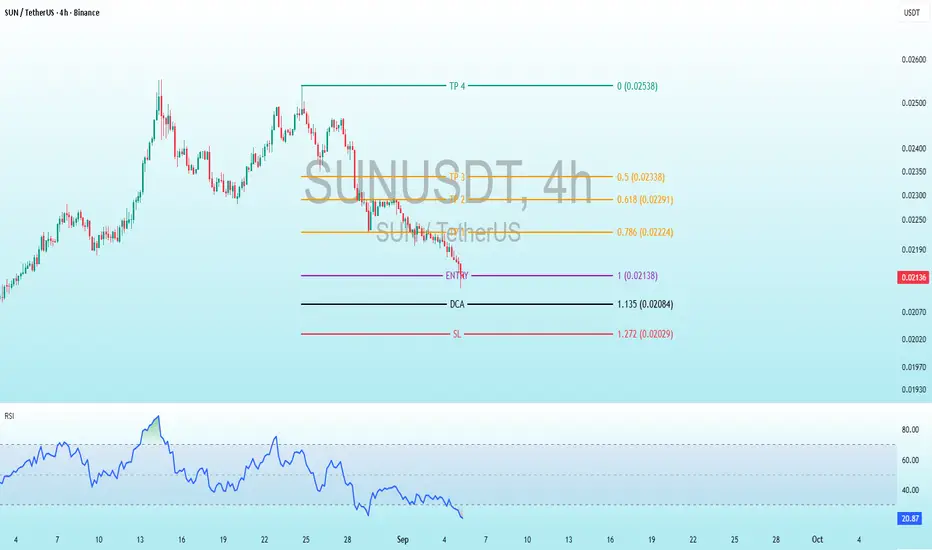
SUN Bearish DivergenceBINANCE:SUNUSDT
Trade Setup:
Target 1: 0.01978 (0.50 Fibonnaci Golden Zone).
Target 2: 0.01883 (0.618 Fibonnaci Golden Zone).
Target 3: 0.01747 (0.786 Fibonnaci Golden Zone).
Target 4: 0.01574 (1 Fibonnaci).
Stop Loss: 0.02382 (above recent high, ~25% above current price).
RSI Analysis: The RSI

SUNUSDT – One Chart, Three Opportunities☀️ In SUN/USDT, three distinct blue box zones stand out. Each offers its own kind of opportunity — but only if you approach them with structure and discipline.
🎯 Here's How to Use Them
📍 Zone 1 → potential for short-term gains
📍 Zone 2 → better suited for medium-term positioning
📍 Zone 3 → promisin

See all ideas
Summarizing what the indicators are suggesting.
Oscillators
Neutral
SellBuy
Strong sellStrong buy
Strong sellSellNeutralBuyStrong buy
Oscillators
Neutral
SellBuy
Strong sellStrong buy
Strong sellSellNeutralBuyStrong buy
Summary
Neutral
SellBuy
Strong sellStrong buy
Strong sellSellNeutralBuyStrong buy
Summary
Neutral
SellBuy
Strong sellStrong buy
Strong sellSellNeutralBuyStrong buy
Summary
Neutral
SellBuy
Strong sellStrong buy
Strong sellSellNeutralBuyStrong buy
Moving Averages
Neutral
SellBuy
Strong sellStrong buy
Strong sellSellNeutralBuyStrong buy
Moving Averages
Neutral
SellBuy
Strong sellStrong buy
Strong sellSellNeutralBuyStrong buy
Displays a symbol's price movements over previous years to identify recurring trends.
Frequently Asked Questions
The current price of SUN / UST (SUN) is 0.02227300 USDT — it has fallen −1.19% in the past 24 hours. Try placing this info into the context by checking out what coins are also gaining and losing at the moment and seeing SUN price chart.
SUN / UST price has risen by 3.26% over the last week, its month performance shows a −7.94% decrease, and as for the last year, SUN / UST has increased by 4.19%. See more dynamics on SUN price chart.
Keep track of coins' changes with our Crypto Coins Heatmap.
Keep track of coins' changes with our Crypto Coins Heatmap.
SUN / UST (SUN) reached its highest price on Jun 20, 2021 — it amounted to 159,440.00000000 USDT. Find more insights on the SUN price chart.
See the list of crypto gainers and choose what best fits your strategy.
See the list of crypto gainers and choose what best fits your strategy.
SUN / UST (SUN) reached the lowest price of 0.00111110 USDT on Jun 22, 2021. View more SUN / UST dynamics on the price chart.
See the list of crypto losers to find unexpected opportunities.
See the list of crypto losers to find unexpected opportunities.
The safest choice when buying SUN is to go to a well-known crypto exchange. Some of the popular names are Binance, Coinbase, Kraken. But you'll have to find a reliable broker and create an account first. You can trade SUN right from TradingView charts — just choose a broker and connect to your account.
Crypto markets are famous for their volatility, so one should study all the available stats before adding crypto assets to their portfolio. Very often it's technical analysis that comes in handy. We prepared technical ratings for SUN / UST (SUN): today its technical analysis shows the sell signal, and according to the 1 week rating SUN shows the neutral signal. And you'd better dig deeper and study 1 month rating too — it's buy. Find inspiration in SUN / UST trading ideas and keep track of what's moving crypto markets with our crypto news feed.
SUN / UST (SUN) is just as reliable as any other crypto asset — this corner of the world market is highly volatile. Today, for instance, SUN / UST is estimated as 1.21% volatile. The only thing it means is that you must prepare and examine all available information before making a decision. And if you're not sure about SUN / UST, you can find more inspiration in our curated watchlists.
You can discuss SUN / UST (SUN) with other users in our public chats, Minds or in the comments to Ideas.