Supreme Industries probable price projectionAs it is clear form the chart that
1. price may take support from the channel and move upwards
2. if price breaks the level then it travels lower side
Next report date
—
Report period
—
EPS estimate
—
Revenue estimate
—
66.75 INR
9.61 B INR
103.82 B INR
60.15 M
About Supreme Industries Limited
Sector
Industry
CEO
Mahaveer Prasad S. Taparia
Website
Headquarters
Mumbai
Founded
1942
ISIN
INE195A01028
FIGI
BBG000D0M8G5
Supreme Industries Ltd. engages in the business of manufacturing plastic products. Its product segments include plastic piping, industrial, packaging, consumer, and others. The company was founded on February 17, 1942 and is headquartered in Mumbai, India.
Related stocks

Supreme Industries BuySupreme Industries seems to take support from trend line. Buy @CMP (4236) with SL of 4060 and Target of 4400, 4700 & 5150

SUPREME INDUSTRIESSupreme Industries Ltd. (currently trading at ₹4598) is India’s largest plastics processor, with a diversified portfolio spanning piping systems, material handling products, protective packaging, performance films, and furniture. Founded in 1942 and headquartered in Mumbai, the company operates 25+

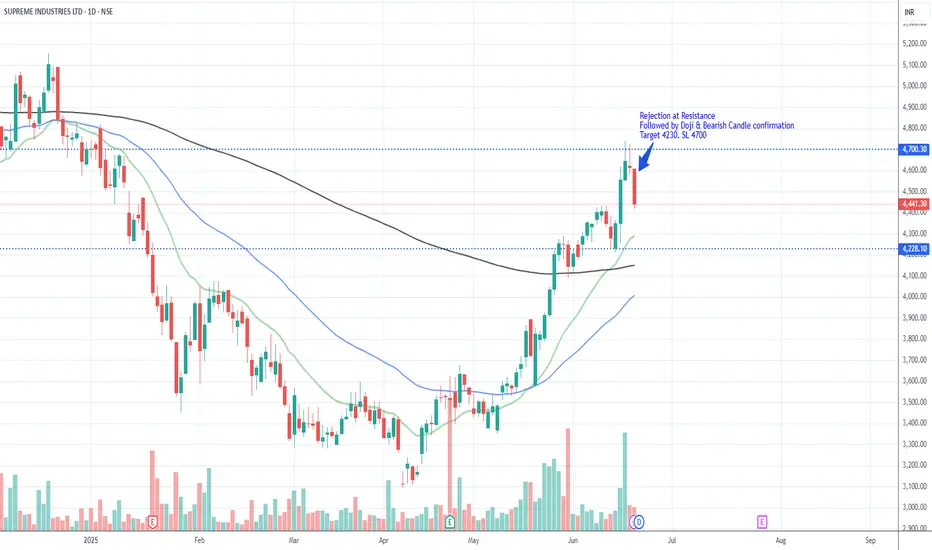
SupremeIND_Price rejection @ Resistance_ShortRejection at Resistance
Followed by Doji & Bearish Candle confirmation
Target 4230. SL 4700
SUPREME INDUSTRIES SHORT TO MEDIUM TERM ANALYSISSupreme Industries is looking positive post recent short covering , now trading at 4165 indicating upside momentum to continue . An important level to watch for further upside would be 4244 and it can continue its upside upto levels of 4695-4830 in the short to medium term . On the downside, imp sup

SUPREME INDUSTRIES LTD SWING TRADE SETUP📊 Price Action & Trend Analysis
Analyzing market trends using price action, key support/resistance levels, and candlestick patterns to identify high-probability trade setups.
Always follow the trend and manage risk wisely!
Price Action Analysis Interprets Market Movements Using Patterns And Trend

SUPREME INDUSTRIES: Key Support Zone – Accumulation or Relief ?📉 Stock Correction: Supreme Industries has seen a sharp decline of nearly 45% from its all-time high, bringing it down to a critical support zone.
📊 Technical Setup:
✅ 200-Week SMA Test: The stock is currently hovering around its 200-week simple moving average (SMA), considered strong support

bouncing from Montlhly demand ,With Just 8% Stop lossCMP: 4560 on 11 Nov 2024
Stock bouncing from Montlhly demand with Daily confirmation on 8th Nov bullish candle.
With Just 8% Stop loss, you can expoect ~ 45% gain.
I would also prefer for long term( 5 years) investment perspaective

SUPREME S/R Support and Resistance Levels:
Support Levels: These are price points (green line/shade) where a downward trend may be halted due to a concentration of buying interest. Imagine them as a safety net where buyers step in, preventing further decline.
Resistance Levels: Conversely, resistance levels (re

MV's 3C Pattern20 EMA>100EMA>200EMA>500EMA. price above 20 EMA and 50 % retracement from ATH. RSI is in bull range.Already given breakout. Good time to enter.

See all ideas
Summarizing what the indicators are suggesting.
Neutral
SellBuy
Strong sellStrong buy
Strong sellSellNeutralBuyStrong buy
Neutral
SellBuy
Strong sellStrong buy
Strong sellSellNeutralBuyStrong buy
Neutral
SellBuy
Strong sellStrong buy
Strong sellSellNeutralBuyStrong buy
An aggregate view of professional's ratings.
Neutral
SellBuy
Strong sellStrong buy
Strong sellSellNeutralBuyStrong buy
Neutral
SellBuy
Strong sellStrong buy
Strong sellSellNeutralBuyStrong buy
Neutral
SellBuy
Strong sellStrong buy
Strong sellSellNeutralBuyStrong buy
Displays a symbol's price movements over previous years to identify recurring trends.
EEDM
iShares IV PLC - iShares MSCI EM ESG Enhanced CTB UCITS ETF Unhedged USDWeight
0.14%
Market value
11.22 M
USD
Explore more ETFs
Frequently Asked Questions
The current price of SUPREMEIND is 3,475.30 INR — it has decreased by −2.62% in the past 24 hours. Watch Supreme Industries Limited stock price performance more closely on the chart.
Depending on the exchange, the stock ticker may vary. For instance, on NSE exchange Supreme Industries Limited stocks are traded under the ticker SUPREMEIND.
SUPREMEIND stock has fallen by −9.31% compared to the previous week, the month change is a −17.11% fall, over the last year Supreme Industries Limited has showed a −24.66% decrease.
We've gathered analysts' opinions on Supreme Industries Limited future price: according to them, SUPREMEIND price has a max estimate of 5,186.00 INR and a min estimate of 3,308.00 INR. Watch SUPREMEIND chart and read a more detailed Supreme Industries Limited stock forecast: see what analysts think of Supreme Industries Limited and suggest that you do with its stocks.
SUPREMEIND reached its all-time high on Jun 12, 2024 with the price of 6,460.00 INR, and its all-time low was 3.50 INR and was reached on Sep 21, 2001. View more price dynamics on SUPREMEIND chart.
See other stocks reaching their highest and lowest prices.
See other stocks reaching their highest and lowest prices.
SUPREMEIND stock is 3.04% volatile and has beta coefficient of 1.02. Track Supreme Industries Limited stock price on the chart and check out the list of the most volatile stocks — is Supreme Industries Limited there?
Today Supreme Industries Limited has the market capitalization of 441.09 B, it has increased by 0.05% over the last week.
Yes, you can track Supreme Industries Limited financials in yearly and quarterly reports right on TradingView.
Supreme Industries Limited is going to release the next earnings report on Jan 26, 2026. Keep track of upcoming events with our Earnings Calendar.
SUPREMEIND earnings for the last quarter are 13.00 INR per share, whereas the estimation was 15.77 INR resulting in a −17.56% surprise. The estimated earnings for the next quarter are 17.19 INR per share. See more details about Supreme Industries Limited earnings.
Supreme Industries Limited revenue for the last quarter amounts to 23.94 B INR, despite the estimated figure of 24.11 B INR. In the next quarter, revenue is expected to reach 28.14 B INR.
SUPREMEIND net income for the last quarter is 1.65 B INR, while the quarter before that showed 2.02 B INR of net income which accounts for −18.57% change. Track more Supreme Industries Limited financial stats to get the full picture.
Supreme Industries Limited dividend yield was 0.99% in 2024, and payout ratio reached 44.95%. The year before the numbers were 0.71% and 35.62% correspondingly. See high-dividend stocks and find more opportunities for your portfolio.
As of Nov 23, 2025, the company has 21.9 K employees. See our rating of the largest employees — is Supreme Industries Limited on this list?
EBITDA measures a company's operating performance, its growth signifies an improvement in the efficiency of a company. Supreme Industries Limited EBITDA is 13.41 B INR, and current EBITDA margin is 13.58%. See more stats in Supreme Industries Limited financial statements.
Like other stocks, SUPREMEIND shares are traded on stock exchanges, e.g. Nasdaq, Nyse, Euronext, and the easiest way to buy them is through an online stock broker. To do this, you need to open an account and follow a broker's procedures, then start trading. You can trade Supreme Industries Limited stock right from TradingView charts — choose your broker and connect to your account.
Investing in stocks requires a comprehensive research: you should carefully study all the available data, e.g. company's financials, related news, and its technical analysis. So Supreme Industries Limited technincal analysis shows the strong sell today, and its 1 week rating is strong sell. Since market conditions are prone to changes, it's worth looking a bit further into the future — according to the 1 month rating Supreme Industries Limited stock shows the sell signal. See more of Supreme Industries Limited technicals for a more comprehensive analysis.
If you're still not sure, try looking for inspiration in our curated watchlists.
If you're still not sure, try looking for inspiration in our curated watchlists.