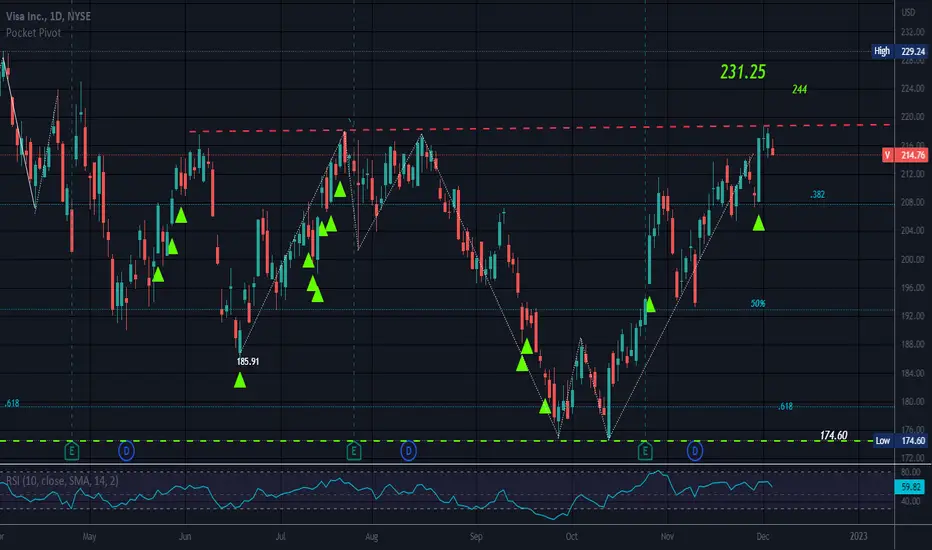
Selling Visa at swing highs.Visa - 30d expiry - We look to Sell at 216.49 (stop at 223.41)
We are trading at overbought extremes.
Bearish divergence can be seen on the daily chart (the chart makes a higher high while the oscillator makes a lower high), often a signal of exhausted bullish momentum, or at least a correction lower.
Bearish divergence is expected to cap gains.
We look for a temporary move higher.
The previous swing high is located at 217.61. 218.07 has been pivotal.
Preferred trade is to sell into rallies.
Our profit targets will be 199.22 and 195.22
Resistance: 215 / 218 / 225
Support: 206 / 200 / 195
Disclaimer – Saxo Bank Group.
Please be reminded – you alone are responsible for your trading – both gains and losses. There is a very high degree of risk involved in trading. The technical analysis , like any and all indicators, strategies, columns, articles and other features accessible on/though this site (including those from Signal Centre) are for informational purposes only and should not be construed as investment advice by you. Such technical analysis are believed to be obtained from sources believed to be reliable, but not warrant their respective completeness or accuracy, or warrant any results from the use of the information. Your use of the technical analysis , as would also your use of any and all mentioned indicators, strategies, columns, articles and all other features, is entirely at your own risk and it is your sole responsibility to evaluate the accuracy, completeness and usefulness (including suitability) of the information. You should assess the risk of any trade with your financial adviser and make your own independent decision(s) regarding any tradable products which may be the subject matter of the technical analysis or any of the said indicators, strategies, columns, articles and all other features.
Please also be reminded that if despite the above, any of the said technical analysis (or any of the said indicators, strategies, columns, articles and other features accessible on/through this site) is found to be advisory or a recommendation; and not merely informational in nature, the same is in any event provided with the intention of being for general circulation and availability only. As such it is not intended to and does not form part of any offer or recommendation directed at you specifically, or have any regard to the investment objectives, financial situation or needs of yourself or any other specific person. Before committing to a trade or investment therefore, please seek advice from a financial or other professional adviser regarding the suitability of the product for you and (where available) read the relevant product offer/description documents, including the risk disclosures. If you do not wish to seek such financial advice, please still exercise your mind and consider carefully whether the product is suitable for you because you alone remain responsible for your trading – both gains and losses.
Trade ideas

VISA SHORT TIMBERRRR!!!VISA formed a rising wedge on the 4hr time frame and broken its support. Secondly on the daily time frame VISA formed a descending channel which it broke out of and reentered due to a false break out. Current play is $200 puts out for Jan-Feb
:)

Visa - Weekly analysisIs this a fakeout or is this a breakout. Wondering why ex speaker would sell all of her shares? Not entering until I see price action, break above recent highs outside channel or a break back down below the channel. Will zoom in for entry.
Overall, We could see a green day tomorrow due to the fact we had 4 red selloff days in a row... so probability has it a 5th could go green. Waiting to see a bounce but ready to take some more puts tomorrow as I see price action happen real time.
Indicators are lagging, you want to see price action, market psychology, market structure, gaps, imbalances, and use all the tools available to make a good trade!
Trade safe have fun!!
Like and comment for more!

RectangleV has not been able to stay above the resistance line of the Rectangle.
Price is above the .382 of the trend up.
No recommendation.
Neutral until broken and can be a long term pattern and some would trade inside the structure.
VISADescending Parallel Channel Breakout
Formation of HH and HL
Strong Horizontal Support Breakout
Aggressive Entry @ current Level (217.66)
Conservative Entry @ formation of HL, confluence with trendline support (214)
Trade with specified Stop Loss
Ride the trend with trailing stop Loss

Visa - Potential technical rebound1. Fortune_TD, Fortune Banker trend :
Fortune TD 9, TD 13and Force 9 (from 25 Sep) show the trend exhaustion range, the green bar shows this is a potential share pull back. .
Fortune Banker trend, green line shows the banker chips flow in at the bottom, red lines show the profit money at bottom as well, then short money cross its 5 days average, potentially an uptrend begin.
2. First Up and Retrace :
03 Oct 2022, short money trend line gold cross, followed by the bottom exhaustion range signal TD 9, 13 and Force 9
First up happened followed by a the retrace as indicated by TD and share pull back signal.
3. Diverge:
Fortune Crown, red dot shows the share price is at bottom, and there is a bottom divergence today, the green bar momentum shows a positive momentum, potential uptrend after divergence.
Fortune Banker trend, short money trend line shows the bottom divergence, potential uptrend begin.
4. Summary:
Based on above analysis, there is a potential of technical rebound after a mid term down trend, cut loss 184.66.

Short V at the top of the downward channelTop of the downward channel.
Frozen rope rise.
reaching volume POC and previous congestions.
Extended from 50D.
PE 27 high compared to growth.
earning steady.
Institutional support dwindling
Total Risk: 3.87%

VISA About to start a historic Bull Cycle similar to post 2009This is Visa Inc. (V) on the 1W time-frame. The primary pattern since the July 26 2021 All Time High (ATH) has been a Channel Down with the price hitting yesterday the top of the pattern for the first time since August 15. The August 15 candle rejection was also made (after multiple attempts) on the 1W MA100 (green trend-line).
The pattern is similar to the one Visa has been trading in since mid 2019. This idea compares the two eras: 2019 - 2022 and 2008 - 2011. In 2011, the stock was trading within a similar Channel Down as the accumulation pattern, with its Lows contained around the 0.5 Fibonacci retracement level. Following the break above the 1W MA100, the price made one last Lower High, pulled-back and then broke above the pattern aggressively. If the same formation continues to be repeated then we can have a break above the Channel Up by mid December. See also how the RSI and MACD patterns are similar.
------------------------------------------------------------------------------
** Please LIKE 👍, SUBSCRIBE ✅, SHARE 🙌 and COMMENT ✍ if you enjoy this idea! Also share your ideas and charts in the comments section below! This is best way to keep it relevant, support me, keep the content here free and allow the idea to reach as many people as possible. **
-------------------------------------------------------------------------------
You may also TELL ME 🙋♀️🙋♂️ in the comments section which symbol you want me to analyze next and on which time-frame. The one with the most posts will be published tomorrow! 👏🎁
-------------------------------------------------------------------------------
👇 👇 👇 👇 👇 👇
💸💸💸💸💸💸
👇 👇 👇 👇 👇 👇

V // cup handle formation Let's look for closures where I indicated with X. Targets are determined according to Fibonacci.

Short $V from 212This seems like a good spot to short V. Spike just upwards of channel makes for a good entry:
Entry: 212
SL: 221
TP: 183

V | LongVisa is looking pretty nice to bounce up and break the TL support level above. I guess V could break parallel channel next week

An easy way to lower the risk profile of your stock portfolioThe correlation between Visa and Mastercard creates an interesting investment trick.
I began this analysis not even looking for the correlation between these two companies' stock prices. But rather I was looking for some chart patterns using a stock screener. At the top of the list, these two companies emerged. As usual, I was going to go through the stock charts of all the companies in the list briefly to determine if they hold any chart pattern merit.
However, as I scanned over Visa, and then Mastercard, I noticed they looked extremely similar. Weird. I then opened up Tradingview and put these stocks in. Side by side they look the same.
These two companies have very similar price movements. No surprise, they are very similar companies. They are direct competitors. They are both big players in the global credit services market. Transacting trillions of dollars in total payments volumes per year. They’re both tech companies that connect the consumer and the merchant digitally for transactions. They have been seen as rivals for over a decade now. Neither Visa nor Mastercard are involved in extending credit or issuing cards. They work in a co-branded relationship with the card provider. That's why you will see their logos on your credit card but won’t see a full absolute Mastercard/Visa credit card.
Visa is generally larger in terms of the transaction, purchase volume and cards in circulation. However, Mastercard growth has been picking up and may see a catch-up.
Now let’s get back to the price movement analysis. I have split this up into three time periods and then done a Pearson Correlation Test. The first period is the matched IPO date to the current date. The next is the last 5 years and then the last 2 years.
The reason for the three time periods is simple. I want to do a full IPO to current date analysis to get the full picture and long-term perspective. A 5-year analysis because if you look at the charts above, that’s when the volatility in the stocks picks up. The last 2 years, because if you look again at the charts above, some crazy price movements have been occurring in the last two years that do not follow the past 14-year trend.
The closer to +1, the closer the correlation.
March 2008 - Nov 2022: 0.83
Nov 2017 - Nov 2022: 0.92
Nov 2020 - Nov 2022: 0.90
As you can see from the above stats both of these stocks have a close relationship with each other. A higher correlation in recent years. Of course, correlation doesn’t mean causation. However, the fact that these two companies are very similar and direct competitors means that one could form a reasonable conclusion. Not that one stock is affecting the other price. But rather than investors see these two companies as very similar. Such that when they exit one, they exit the other. Unless there is a big reason not to. But as you can see from the stats above. The stocks have a close correlation over the last 14 years such that even if one says that, let, for example, Visa is going to grow faster than Mastercard, the chances are - Mastercard wouldn’t be far behind.
Henceforth, this leads to an interesting investment tip:
Let’s say you want to diversify your portfolio by gaining some exposure to the credit services industry. Since Visa and Mastercard are the two leading companies, you chose them. However, you only have enough money to invest in one. But you also want to lower the risk profile of your portfolio. Is there a way both can be done?
The answer is yes, since Visa and Mastercard have such a close correlation and are very big established companies they will most likely follow each other in price movement. Also, since they are two different companies, you will be diversifying your investment and will be lowering your risk. So, you divide that last portion of your portfolio into two smaller portions and buy Visa and Mastercard 50:50. This will mean you get the exposure you are after, the returns as well since they have a close correlation, and the risk is lowered since they are two separate companies. Quite a cool trick is not it?
I created three different portfolios. Each beginning with $10,000. I invested the full out in two of them into Visa and Mastercard. The last portfolio had a 50:50 split. I then calculated the standard daily deviation and the annualized standard deviation. Here are the results:
Visa 100%:
Start value: $10,000
End value: $137,295.57
Annualized STD: 29.60%
Mastercard 100%:
Start value: $10,000
End value: $151,466.00
Annualized STD: 32.30%
Visa 50% Mastercard 50%:
Start value: $10,000
End value: $144,380.79
Annualized STD: 29.50%
As you can see from the above stats, once the two stocks have been combined the standard deviation drops by 8.67% and the standard deviation is lower than the two stocks individually. This means the risk is lower. However, yes, the final value isn’t as high as the Mastercard 100% the returns are higher than the sole Visa 100% portfolio by 5.10%. So, in other words, the risk has been lowered than if you had individual portfolios and the returns are higher as well. Of course, the returns aren’t as high as they are in the Mastercard 100% portfolio, but the risk is lower while still ensuring higher returns. This means the Visa 50% Mastercard 50% portfolio provides an effective way to reduce risk while increasing returns.
However, one thing to note is the maximum drawdown was the lowest in the Mastercard 100% portfolio. The second lowest is Visa 50% Mastercard 50%. Highest in Visa 50%. So, ensure that if you are going to follow this strategy, there is more research to be done and it is best worked in a long-term investment strategy possibly combined with dollar cost averaging.
To conclude, if you want to see a higher return while lowering the risk profile of your portfolio. It pays to diversify with similar correlating assets.

V:More pain in sight!Visa
Intraday - We look to Sell at 199.64 (stop at 210.66)
The medium term bias remains bearish. A sequence of weekly lower lows and highs has been posted. This is negative for sentiment and the downtrend has potential to return. Resistance is located at 200.00 and should cap gains to this area. Preferred trade is to sell into rallies.
Our profit targets will be 173.20 and 165.00
Resistance: 200.00 / 235.00 / 250.00
Support: 173.00 / 140.00 / 120.00
Please be advised that the information presented on TradingView is provided to Vantage (‘Vantage Global Limited’, ‘we’) by a third-party provider (‘Signal Centre’). Please be reminded that you are solely responsible for the trading decisions on your account. There is a very high degree of risk involved in trading. Any information and/or content is intended entirely for research, educational and informational purposes only and does not constitute investment or consultation advice or investment strategy. The information is not tailored to the investment needs of any specific person and therefore does not involve a consideration of any of the investment objectives, financial situation or needs of any viewer that may receive it. Kindly also note that past performance is not a reliable indicator of future results. Actual results may differ materially from those anticipated in forward-looking or past performance statements. We assume no liability as to the accuracy or completeness of any of the information and/or content provided herein and the Company cannot be held responsible for any omission, mistake nor for any loss or damage including without limitation to any loss of profit which may arise from reliance on any information supplied by Signal Centre

VISA sell4hr chart analysis on this chart gives a momentum close below zero to the downside. The correction or temporary retrace zone was broken and i a looking for an entry at the retest of that zone. My bias is a continuation down to the 0.618 and 1.0 level of the fib extension

Visa $V Rejecting off top channel resistance -- BearishGiven FOMC is behind us now and the market is most likely following another leg down I'm expecting a top line rejection off of the large channel on the daily.
Rejected off the 200d MA of $218.11. Expect continuing rejection if we get a dead cat recovery at this point, but ultimately I see this impulse retracing back down. Notice the W pattern several bars before with a clear rejection off the top resistance with the large wick a few days prior.
MACD is making lower highs, RSI is coming back down and about to cross the signal to the bearish side. Stochastic is losing steam as well starting to fall from overbought territory. VI+ looks like its done making an engulfing void to the upside, which indicates that a reversal pattern with VI- is probably around the corner. TTM squeeze looks like its starting to apex as well.
Looking at the fib retrace from the previous low to high, and also following an extension downwards from previous high impulse to recent low and recent high we are looking at support levels of 0.236 at ~ $202.81 and 201.26 which is more or less where current price action is. Therefore expect the next couple of fib supports/resistances to be hit on both the retracement as well as the downward extension.
Retracement supports are as follow --
0.382 $194.42
0.5 $193.06
0.618 $188.70
Fib Extension resistances are as follow --
0.382 $194.91
0.5 $189.79
0.618 $184.66
Looking at the volume profile we see a good shelf of support up to the 0.5 fib extension.
Look for downward movement over the next 6 daily bars (10 days). Price action must clear the support shelf at $200 to continue downwards, otherwise expect sideways action between $200-203.
PT1: -6 pts -2.99% to the 0.382 extension ~ $194.91
PT2: -11.11 pts -5.33% to the 0.5 extension ~ $190 -- I think this is where $V will find support and probably start heading sideways.
Max PT: -16.11 pts -8.03% to the 0.618 fib extension ~ $185 -- Long shot, will have to continuously monitor to see how we move along with the macro and how the volume profile shapes up over the next few days.
Stop loss: ~$203.50 +1.53% from current action -- This would be the last stop on the volume profile upwards where the next would be a gap towards the upside.

Visa Rolling TopVisa has been developing a large topping pattern over the past two years.
The measured move off the topping pattern takes it down to the $110s.

Visa, Inc. (V)Founded in Foster City, California, by Dee Hock, this American multinational specialises in global payments technology. Its primary aim is to promote digital currencies among consumers, businesses, banks, and governments. Having built its network across 200 countries and territories worldwide, it is a global leader in digital payments. The company offers three different types of cards: Debit cards, Credit cards, and Prepaid cards. It also partnered with Apple in 2014 to introduce a wallet feature to iPhones. The company has various products, such as Visa Electron, Visa Cash, Visa Contactless, mVisa, and VisaCheckout.

visa sell opportunity visa stock is ready to go deep down all things are mentioned on the chart take it and enjoy :)

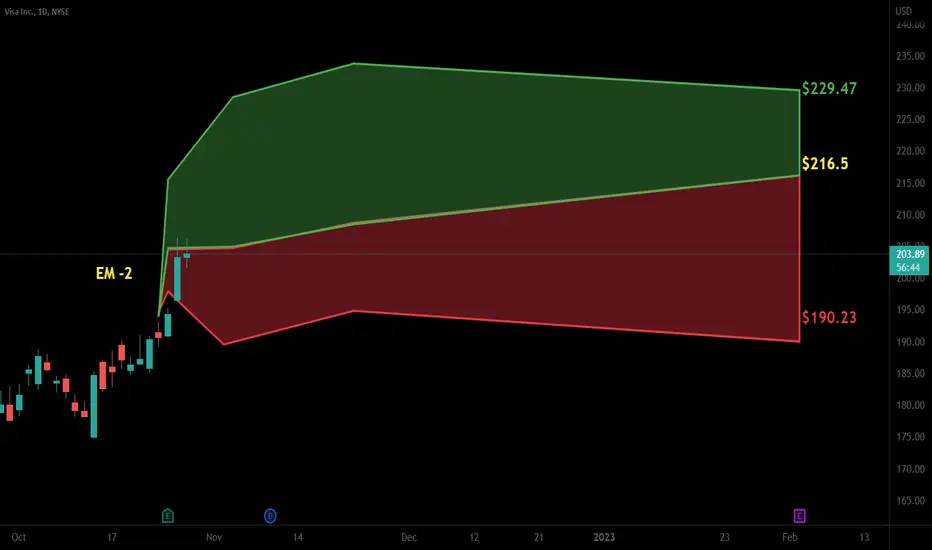
$V with a Bullish outlook following its earnings #Stocks The PEAD projected a Bullish outlook for $V after a Positive Under reaction following its earnings release placing the stock in drift A with an expected accuracy of 33.33%.
Visa shortit is close to mm200 and triangle side with high volumes, in my opinion there have been a lot of profit taking
I sell with target Gap at 196-197

V Visa exposure to Russia and UkraineVisa and Mastercard restricted transactions in Russia as aggressive penalties on the country over the invasion of Ukraine.
Around $1.2 billion of Visa Inc.’s annual net revenue comes from Russia and Ukraine.
4% of Visa’s total net revenue comes from Russia and about 1% from Ukraine.
In this case, my price target for the stock is the $187 resistance, while the sell-off area could touch $174 - $183.

VISAGreat 3rd quarter = bullish move for VISA.
The daily showed a double bottom and possible close at 61.8 before continuing to the upside today.

