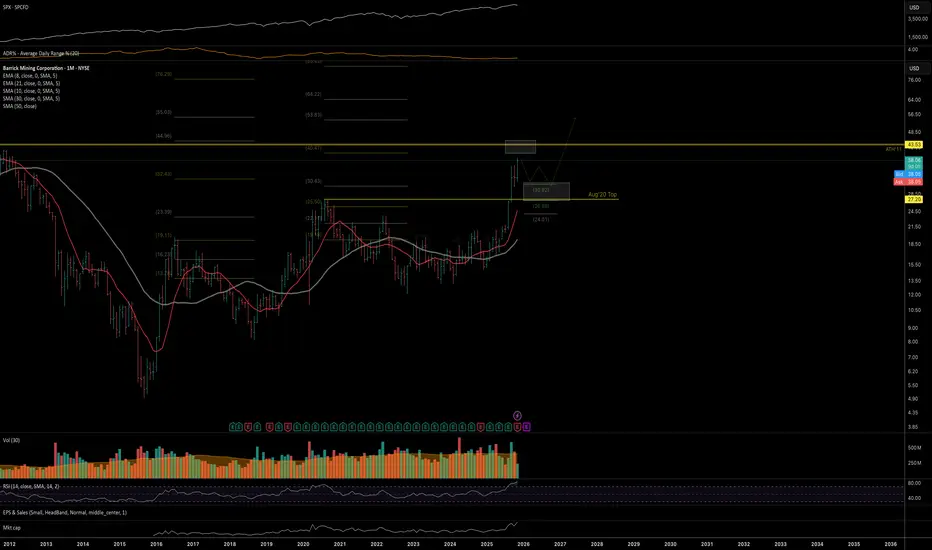
B: Macro trend-structurePrice may be approaching an important mid-term resistance in the low-40s, where a mid-term top formation is likely.
However, from the macro trend structure, any pullback into the 33–30 zone (retesting the Aug ‘20 highs) should provide a new buying opportunity, with the broader macro structure favoring a move above the 2011 ATH into 2026+.
Macro view (monthly chart):
Barrick Mining Corporation
No trades
Market insights
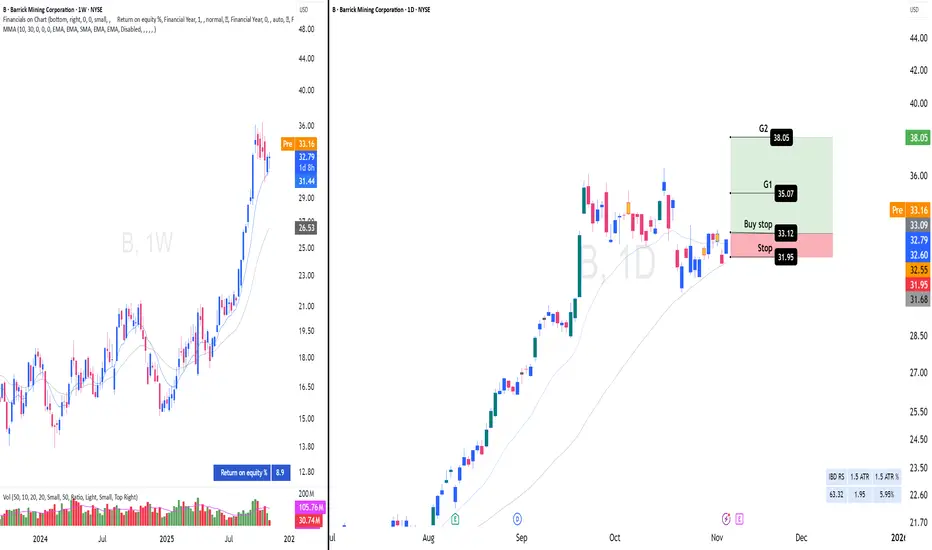
B – Gold Base Breakout SetupReasoning:
Base building for several weeks within a strong gold trend
Relative strength improving while market consolidates
Potential Stage 2 continuation pattern forming
Swing Traders (2-6 Week Holds)
Buying rule : Watch out for a buy stop, this helps avoid fake moves!
Entry: Full position on breakout
Profit Taking: Sell 1/3 at Goal 1
Final Exit: Remainder at Goal 2
If there is a goal 3. (You can sell 30% on G1, 30%, on G2, 40% on G3)
Selling is done partially because we never know what is going to happen, so sell as money goes in your favor - Mark Douglas
Barrick Gold (B) Poised for Further Gains as Gold Prices SurgeThis trade idea highlights Barrick Gold's strong momentum backed by rising gold prices and robust Q2 earnings showing increased gold and copper production. With the stock recently rallying over 100% year-to-date and analysts rating it as undervalued on key metrics, this setup offers potential for continued upside. Watch for key Support levels and volume confirmation to enter, applying strict risk management.

B Flag formation on 8hr chartI see a potential bottoming of price and run up around tomorrow at 12pm.
If the Bull Flag breaks out then the target prices are about 43 and 48. These price targets will need to be adjusted when and if the break out to the upside occurs.

B Short 1H Aggressive CounterTrend TradeAggressive CounterTrend Trade
- long impulse
+ biggest volume T1
+ exhaustion volume
+ resistance level
+ biggest volume Ut
+ weak test
- below first bullish bar close entry
Calculated affordable virtual stop loss
1 to 2 R/R take profit
1D CounterTrend
"- long imluse
- neutral zone
- volume distribution long
+ exhaustion volume"
1M CounterTrend
"- long impulse
+ volumed interaction bar"
1Y countertrend
"- long impulse
+ volumed T1 level
+ resistance level"

B Barrick Mining- Closed off 25% of the position on Barrick, looking to take advantage of this rally in
the metals and mining sector. If the price of gold/silver sells off, then considering adding back to the position around $22. Will need COT reports to show taking profits and adding to short positions. Till then, I remain bullish on this market long-term.

Barrick Mining CorporationStrengths:
Healthy balance sheet, with minimal net debt and excellent liquidity.
High margin, stable cash flow, strong FCF and positive ROE/ROA.
Strategic expansion in copper, high margin assets and large potential portfolios (Reko Diq).
Financial discipline with dividends and buybacks, supported by macro conditions - gold and copper have fundamental growth.

Barrick Gold Corp (B) – Riding the Gold SupercycleCompany Snapshot:
Barrick $B is a global gold and copper mining powerhouse, poised to thrive amid soaring gold prices and escalating macroeconomic uncertainty.
Key Catalysts:
Gold Bull Run Tailwind 📊
Spot gold is surging, with projections aiming for $2,700/oz. As a low-cost, large-scale producer, Barrick stands to gain significantly from margin expansion and free cash flow acceleration.
Global Diversification 🌍
Operations across North America, Africa, and Asia offer geographic balance—mitigating regional risk while ensuring strong production continuity.
Insider Confidence + Lean Costs 🔒
CEO Mark Bristow and other execs are actively buying shares, signaling deep conviction.
With industry-low all-in sustaining costs (AISC), Barrick boasts high operational leverage to gold’s upside, especially in an inflationary environment.
Investment Outlook:
Bullish Entry Zone: Above $18.00–$19.00
Upside Target: $28.00–$29.00, fueled by macro gold strength, disciplined execution, and insider alignment.
⛏️ Barrick is a prime gold cycle play, combining operational excellence with strategic global scale.
#BarrickGold #GoldStocks #GoldPrice #Commodities #InflationHedge #MiningStocks #InsiderBuying #AISC #PreciousMetals #MacroTailwinds #B

barrick, run it hotfiscal dominance adding downward pressure on dollar. long term chart look favourable with key fib levels being touched. added copper exposure in usa, abx has some legs

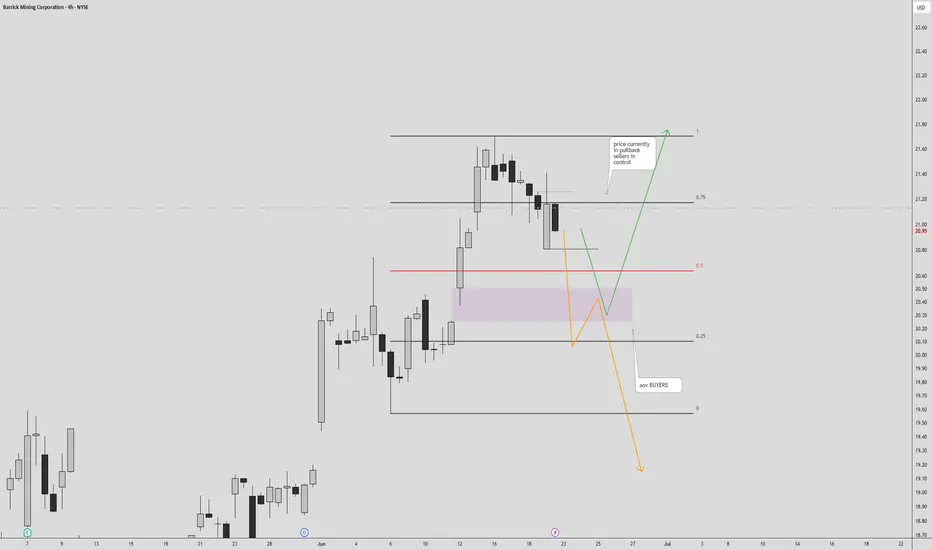
price touche AOV we can see price is in 50 % of the range looking for confirmation candle closure are we respecting or disrespect this AOV

Bearish trend looking for 4H price is in pullback and anticipating price to continue lower until AOV , interested how price to reach this area of value if this area is respected then will be looking to buy , but if this area is violated then i would prefer to continue selling .. lets wait how it goes
The Pattern That Could Launch BitcoinSpotted a long-term inverted head & shoulders pattern forming over a 7–8 month stretch on Bitcoin — much more reliable than short-term setups. If this bullish structure plays out, we could be looking at a breakout that pushes BTC firmly into price discovery.
I’ve included local Fibonacci levels on the chart, though I couldn’t fit the macro one (going from $4k → $69k → $15k — the 1.618 extension of that larger swing lands at $119,800. That could be a key resistance target if we clear the ATH and continue the uptrend. After that, there's the smaller timeframe, but more recent, fib ext 1.618 sitting at $131k.
I'd be very cautious of a failed pattern if $101k doesn't hold. As a last support, 95k and the red 20EMA might hold.
Let’s see how this plays out 🚀

Atleast 3x your moneyAlright, this is getting set to fly high now. Catching with gold and other commodities. All the best !!

Possible Breakout Alert: Barrick Gold (B) - Inverse H&S in Play🚨 Possible Breakout Alert: Barrick Gold (B) – Inverse H&S in Play 🚨
Barrick (NYSE: B) looks poised for a technical breakout from a well-formed inverse head & shoulders pattern that’s been building for months.
Key Levels:
Neckline: ~$20.90–$21.13 zone now being tested
Breakout Target: $24.50+
Support Zones: $19.50 / $18.22 / $17.48
Confluence:
RSI has reset and is curling up
Volume is rising into resistance
Price reclaiming key MAs
Macro tailwinds in the metals space
📈 My Positioning:
I built into this move over time, scaling in during flushes. Current options exposure:
Jan 2026 $15C – Already deep in the money
Jan & Dec 2026 $20C – Showing strong gains
Dec 2026 $35C – Long-dated lottos for a gold breakout scenario
The structure is there. The setup is clear. All eyes on the weekly close. If B starts clearing $21.13 with authority, this could run quickly.
Sometimes the best trades are the ones you quietly build while everyone else is distracted.
#Barrick #GoldStocks #HNSBreakout #TechnicalAnalysis #Metals #OptionsTrading #TradingView

Barrick Gold Corporation ($ABX): Golden Opportunity or Risky
Barrick Gold Corporation (ABX): Golden Opportunity or Risky Prospect? 🏆💰
1/10
Barrick Gold TSX:ABX has seen a solid financial performance recently. EPS for the last quarter hit C$0.42, with next quarter estimates at C$0.63. They beat estimates 75% of the time in the past year. 📈
2/10
Analysts are bullish! The average price target is C$33.57, implying a potential upside of 50.13% from the current C$22.36 price. Strong Buy ratings dominate: 10 Buy, 2 Hold. 🔍 What do analysts know that the market doesn’t?
3/10
However, ABX is facing operational challenges. A suspension in Mali due to government intervention highlights geopolitical risks in mining. 🛑 Regulatory challenges are part of the gold mining game.
4/10
Stock price check: ABX currently trades at C$23.15. That’s 20.94% below its 52-week high of C$29.28 but 21.59% above its low. What does this tell us? Room for recovery, but risks loom. 📊
5/10
Valuation time! Compared to sector peers, Barrick offers an attractive price level, especially given the 50% upside target. Analysts love undervalued plays like this, but what about the risks? 🤔
6/10
Strengths: Barrick operates across multiple countries, ensuring diversified production. That’s crucial in a volatile gold market. 🌍 Diversification is a key defensive strategy here.
7/10
Challenges: High operational costs are always a concern. Pair that with political instability, like the Mali suspension, and ABX faces a steep uphill climb. 🏔️ How much risk are you willing to take on?
8/10
Opportunities: Expansion is always on the table. With gold prices looking stable, Barrick could capitalize on new projects or mines. But timing matters in this market. ⛏️
9/10
Threats: Regulatory and political risks never sleep. Changes in mining laws or political unrest can hit Barrick hard—Mali’s situation is a prime example. Always know your risks. ⚠️
10/10
What’s your take on Barrick Gold TSX:ABX ? Will it strike gold again? Vote here! 🗳️
Buy for the long term 📈
Hold and watch growth 🔄
Too risky, avoid 🚫

ABX longWith gold moving up, abx doing the same.
havent worked much in this chart.
I am just a student. so this is just for educational purpose.

Buy option @ 4hWeekly is consolidating and a buy option at 4h demand nested in weekly and daily demand zone.
Monthly: Downtrend
Weekly: Consolidating.
Daily: Downtrend
4h: Set buy trade at 01 MAY 2024 dojee.

Barrick Gold for a short playBought on March 11-13 and currently up. A one month play I am learning to take longer outlook trades s as not to lose my shirt. So are up about $260 Canadian. I think I will exit shortly. Some news happening around the fear causing war. Sometimes fear causes me to jump in deeper when the pack is running. I love a good short though. None the less I think the profitability is there. Listed as a strong buy by many coveted investors. Which is what makes me want to get out. Plus I think its a long play if you want to make more. I want some short term ramp ups.

GOLD MINE-Expansion GEM, ABX: The WAVE-EXPANSION Will be Epical!Hello There!
Welcome to my new analysis about a Major Gold-Mine Gem I recently spotted forming worthwhile underlying dynamics that have the potential to transform the whole chart price-action into a massive expansion-dynamic to elevate the volatility to levels not far from the moon. Gold has been around for several thousands of years and with gold also the exploration that already created many historical expansion-waves in which gold mines and exploration facilities could expand over 1,000-4,000% in the shortest period of time. Especially, when new explorations proceeded in territories where gold has never been explored before making the source of a continued worthwhile exploration even greater.
The Glorious Past of Gold-Mine Stocks and What Can be Derived From it For Today:
Today, a time has emerged in which a gold-backed currency system could emerge again similar to the gold-backed systems and trademarks in the 20st century. Such a implementation of a gold-backed currency system is going to accelerate the exploration of gold massively and especially in such times where more and more gold is being explored this will be a transformational expansion act for companies like ABX, Barrick Gold Corporation as the gold-backed system needs to find the sources of gold to back the legal tender capital. This will be available in the mining facilities and when a large demand meets a not fully maxed out supply this will be a huge driver of price-expansions towards the upside.
The Implementation of a Gold-Backed Currency System and the Effects on Gold-Mine Stocks:
If a major gold-backed currency system is going to be implemented as there are many plans to this currently this will raise the demand in gold exploration literally over night and only out of this perspective it is going to setup the structure for a massive volatility expansion-wave for gold mining exploration stocks as only a small demand-increase even in a moderately sized economy-field it is going to raise the market-cap of exploration stocks to levels not seen since the gold bull-market with the peaks in 2011. Many conversion of the fiat currency into the gold-backed currency are going to drive the price of a the stock massively.
The Massive Price-Expansion-Potentials to Accelerate With a Gold-Backed System Implementation, Technical Chart Price-Action:
Considering the chart price-action now Gold moved on to form several important dynamic in this whole structure. Firstly it created a gigantic descending channel-formation with a momentous inverse head-and-shoulder-formation forming coherently within the channel. This is from where the gold exploration gem had the origins bouncing both within the lower boundary of the channel and the lower boundary of the inverse head from where the price-action already bounced to solid levels and is now boiling up for a much larger move and breakout dynamic to accelerate the price-action into expanding spheres.
What is so important here in this whole chart is the fact that the price-action is already greatly bouncing above the 20 level where several important indications have their origins. The most important indiciation of this level is the fact that within this level the major Golden-Ratio Trend-Acceleration-Bounce-Zone is allocation. This zone is the zone between the 50% and 61.8% Fibonacci-Level as it is marked in my chart. Especially, when the new gold-backed currency system is going to be accelerated in the implementation within the next times the breakout of the inverse H-S-Formation as it is marked in my chart will be almost inevitable.
Prospects and Previsions of a Gold-Backed Currency-System Implementation With the Preceeding Price-Action and Transformational Price Level:
The next times will be highly important to watch out here especially when the gold-backed system should accelerate the mining facility production the completion of the first breakout as marked will move on even faster than expected, determining this, what follows once the breakout has emerged are the next accelerations of the price-action into the further spheres till the second breakout and trend-acceleration is going to shoot the price-action to major levels with the targets at at least 302.5-310 as it is marked.
Also the meetings of the economies that are looking to implement the gold-backed system are extremely important to watch out especially when the gold-backed currency is being finally implemented and the demand meets the mining facilities this is likely to transform the price-action into the major expansion-phase. The meetings of those economies will be held throughout the year especially in October to November there are likely to be major news into this direction. Remember, that even the implementation of the gold-backed system in a moderate economic field is going to accelerate the price-dynamics heavily as the demand will be around 140 times more than the present unexplored supply.
In this manner, thank you everybody for watching the analysis, support from your side is greatly appreciated.
VP

Short of ABX Barrick Gold #ABXA clear setup; with the long-term chart (M) month. in downtrend. The Current-chart (W) Week is also in downtrend. the (W) is in clear move up, lots of buying to support this momentary fake uptrend. How do I know it is fake. Well one never knows anything as a disclaimer for any trading position; we stack up odd Enhancers in our favour.
So, why did I take the SHRT at $26 while price was rallying (fake rally); the red line on the right hand (W) chart. the price met a Supply Zone, and this SZ happens to be Lower High of the (W) downtrend. a technical downtrend is marked by a series of Lower Lows and Lower High(LH), as long as the LH are not violated the downtrend continue.
Once a price rally into a Lower High Supply zone, am looking for a tight SHORT entry, with a low-er risk STP loss just above the SZ & plenty of room below for the price to fall into & thats exactly what happened here. remembering the long-term is in my favour. thats a great off enhancer.
I Shorted at 26.xx and price fell into my Profit-Target 1, where I closed 2/3 of the position at $5 profit per share. and I moved my STP loss down; today, with price opening well above my last STP Loss, after a weak end of speculation on fallout of banks, the Gold price goes up and so does ABX, no surprise here


Double top on BarnesKind of shocked this company is still around AND $40 a share. Pretty perfect double top though. And a lot of good signals on other time frames
=)

Caryon chart art, do we buy because Peter Schiff tells us to?Ascending broadening wedge yet apparently the bottoms are in!
