HnS BABA setup H&S setup for Alibaba in key zone
Great area to start entering slowly with a lot of great areas to have TPs
Easy invalidation at next shoulder, and if more risk averse under head.
Cheers.
Trade ideas

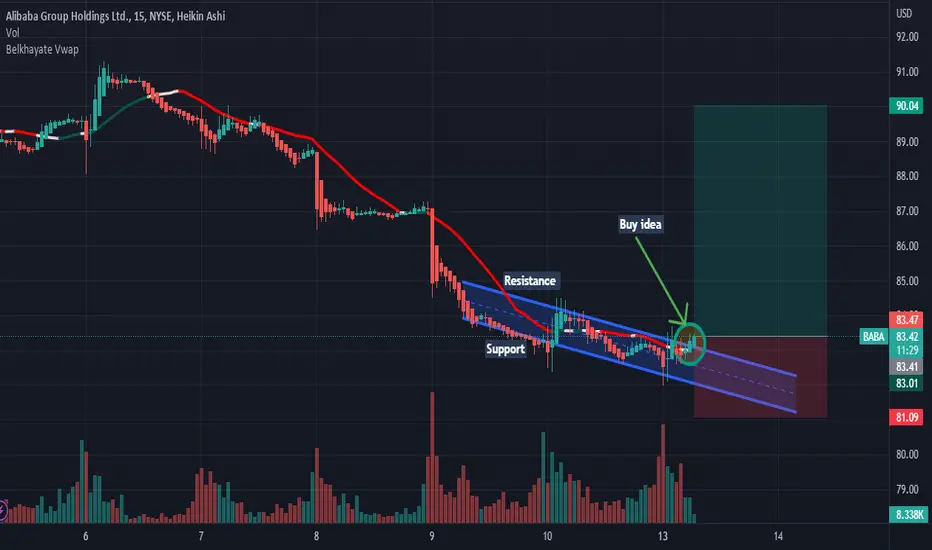
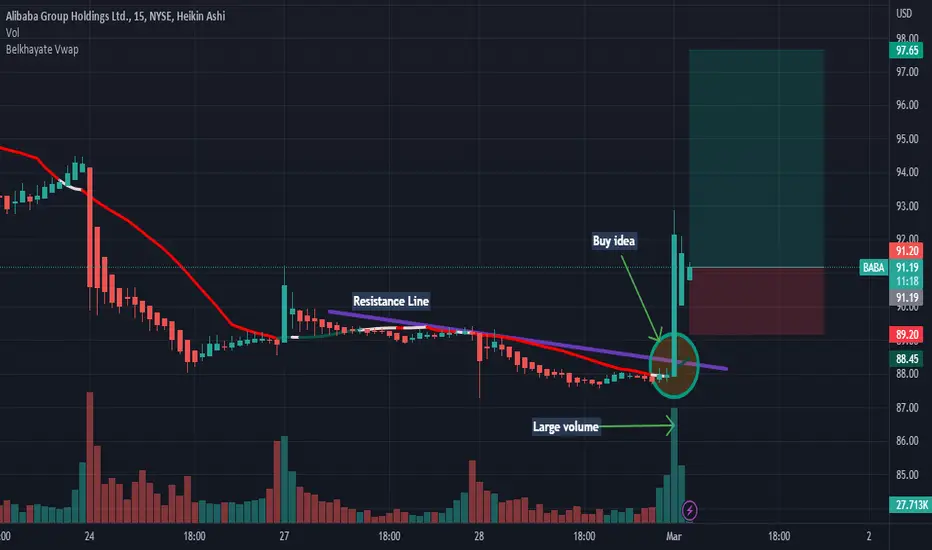
BABA: Buy ideaAs you see on the chart we have the breakout of vwap and resistance so it's mean that we will have a big probability to have an uptrend.Thanks!
Alibaba Trade Plan (March April Challange)In this one we are doing basics, and is basicaly a strategy where we are prepared to a Bearish Breakout that is flagged by a bearish RSI divergence, but we are also prepared for a bullish turn where the price is going to the suport and then the resistance literaly the basic that every trader knows.

BABA AnalysisPrice playing out nicely to what was analyzed last week, giving us a 7.66% move to the downside. I'm expecting price to continue lower following the order flow, into the bullish POI at 78.85.

BABA up trend is comingseem reverse head and shoulder is completing beside breaking trend line and pull-backing to trend line where ichimuko cloud is narrow!!

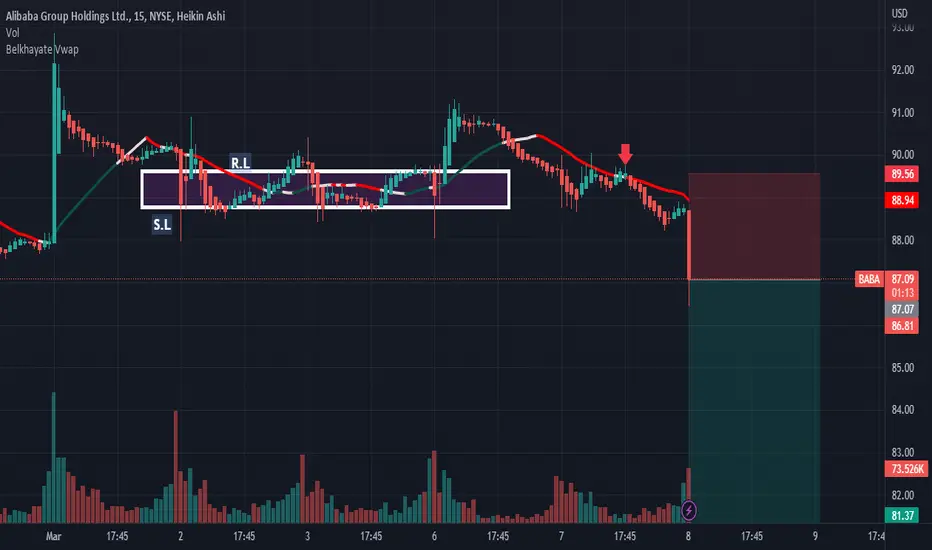
BABA: Sell ideaOn BABA as you see on the chart we have a sell idea because we have the breakout with force the vwap and the support line.Thanks!
ALIBABA - Potential Upward MovementALIBABA sitting on support level and replenishing from demand zone will likely continue its upward trajectory. Exit at 2nd supply zone.

BABA technicalsBABA is overextended still, so I'm expecting a pull back to $105 eventually. However, it's been overextended for 2 weeks, so I wouldn't expect a down move immediately. Also, CCP can pump BABA up whenever it wants to at will. Nevertheless, from a technical analysis, pi RSI is over bought with a bearish cross signal, TTCATR levels leave BABA with little upside reward left and short-term options data is neutral put / call ratio, but longer term it's bullish.
SMA200 = $92
VWMA 20 TTCATR(beta):
top = $123
R3 = $118
R2 = $114
R1 = $109
pivot = $105
S1 = $100
S2 = $96
S3 = $91
bottom = $87
1/27/23 expiry options data:
Put Volume Total 23,905
Call Volume Total 29,004
Put/Call Volume Ratio 0.82
Put Open Interest Total 51,892
Call Open Interest Total 55,178
Put/Call Open Interest Ratio 0.94
2/17/23 expiry options data:
Put Volume Total 6,017
Call Volume Total 10,336
Put/Call Volume Ratio 0.58
Put Open Interest Total 62,817
Call Open Interest Total 100,126
Put/Call Open Interest Ratio 0.63

Bulls defending critical suport zoneIf bulls defend successfully 85 zone I can see another 40% pump.
* 𝗧𝗵𝗲 𝗶𝗻𝗳𝗼𝗿𝗺𝗮𝘁𝗶𝗼𝗻 𝗮𝗻𝗱 𝗮𝗻𝗮𝗹𝘆𝘀𝗶𝘀 𝘀𝗵𝗮𝗿𝗲𝗱 𝗶𝗻 𝘁𝗵𝗶𝘀 𝗽𝗼𝘀𝘁 𝗶𝘀 𝗻𝗼𝘁 𝗳𝗶𝗻𝗮𝗻𝗰𝗶𝗮𝗹 𝗮𝗱𝘃𝗶𝗰𝗲. 𝗔𝗹𝘄𝗮𝘆𝘀 𝗰𝗼𝗻𝗱𝘂𝗰𝘁 𝘆𝗼𝘂𝗿 𝗼𝘄𝗻 𝗮𝗻𝗮𝗹𝘆𝘀𝗶𝘀 𝗮𝗻𝗱 𝗿𝗲𝘀𝗲𝗮𝗿𝗰𝗵.

Too many gaps $BABAToo many down gaps and resistence for $BABA.
BABA needs to break above 120 and fill the 130 gap.
Short term bullish but overall still very bearish.

BABA AnalysisPrice played out nicely as analyzed last week, giving us a -4.68% move within the bullish POI. Price is showing signs of change of character on the lower timeframe. If price breaks above 92.92, we could potentially see a bullish retracement into the bearish POI at 104.52. If invalids the current bullish POI, then it's going to potentially head towards the bullish POI at 78.85.

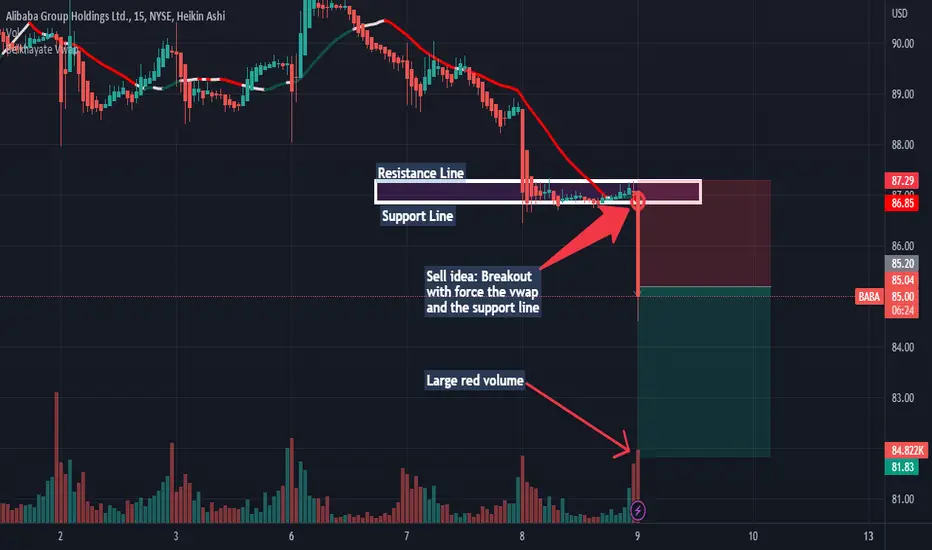
BABA: Sell ideaOn BABA we have a sell idea because we have the breakout of vwap and the support line by a big red candle with a large red volume.Thanks!

BABA looking interestingBABA has had 8 red days.
Oversold.
China stocks are still looking attractive.
Information on the chart.
Not financial advice.

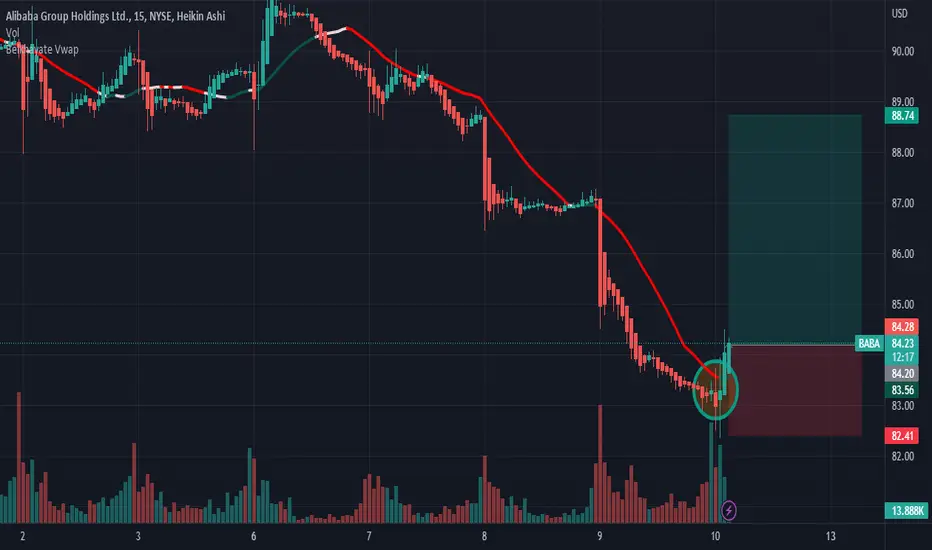
BABA: Buy ideaBuy idea on BABA because we have the breakout of vwap and the resistance line by a big green candle with a large green volume.Thanks!
$BABA with a neutral outlook following its earnings #StocksThe PEAD projected a neutral outlook for $BABA after a positive over reaction following its earnings release placing the stock in drift B with an expected accuracy of 80%.


ALIBABA ($BABA): Technical Analysis on daily chartHi everyone!
The main trend of $BABA is bearish on the daily chart, but most of the bearish momentum has already been worked on by the market. Having said that, even in the short term I remain bearish at least up to the support area, from there I cannot exclude some Reversal Pattern (see chart below). If this happens, an update to this analysis will be necessary because before trying to take a long position I want to wait for at least one clear signal (for example, an impulsive structure on the hourly chart).
POTENTIAL REVERSAL PATTERN
If we look at the Daily Chart, the support area could turn into something like a Right Shoulder of a potential "Inverted Head & Shoulders".
Trade with care! 👍 ...and if you think that my analysis is useful, please..."Like, Share and Comment" ...thank you! 💖
Cheers!
N.B.: Updates will follow below

baba wait and see option contracts, identifying a trend reversal, lets wait about a week or so and lets keep an eye on it

BIG $BABA HnS Swing Position IdeaSupport in gray box isnt only valid support.
Generally just looking for the next shoulder to form, but this might already be a good entry area.
This would be a beautiful HnS and the breakout could take us far.
Keep a lookout for where else the shoulder may form, break gray bos and shoulder can still form lower, hard invalidation is if we get new lows below 'head'.

9988|Alibaba Wave Projection | Bullish Divergence - Rebound?Price action and chart pattern trading - Minor downtrend ending diagonal pattern with MACD bullish divergence
> A possible wave 4.3 minor downtrend wave at the lower support 0.786 extension of wave 4.1 and upcoming rebound wave 4.4 to 0.382 - 0.5 fibonacci retraced from wave 4.3.
> Target upside +10 - 12% while downside is -6%, RRR: 1.5:1
> The final downtrend wave 5 could be slightly below Target H&S zone.
Always trade with affordable risk and respect your stoploss, nothing is 100%

BABA weekly chart make or breakOn the weekly chart, BABA is currently forming a bullish reversal pattern known as an inverted head and shoulders. However, it is also at a critical support level that needs to hold if the bulls want to continue the uptrend. The $85-$89 range has been a strong support and resistance area in the past and needs to act as support now to propel BABA higher. On the bearish side, the January high was a lower high, which could be interpreted as a bear pullback with targets around the previous low or even lower.
Furthermore, the increasing volume on the last week's big drop is more bearish than bullish, and the price is below all major moving averages, indicating a bearish trend.
Although the RSI has cooled down and is ready to go up again, the MACD green ticks are ticking lower while the MACD line is turning, and it seems to be on the verge of crossing below the signal line.
Overall: BABA is in a situation where the bulls need to step in, or the stock will experience further pain in the coming weeks or months. The price is currently at a crucial support level, and it needs to hold to initiate an uptrend and possibly trigger the inverted head and shoulders pattern. If the price breaks above the January high, it would confirm the pattern as there is a neckline.
However, if buyers do not step in and sellers continue to sell, the stock will experience a bearish pullback, and it may drop to lower levels. Additionally, $60 is a significant low from 2015, 2016, and 2023, and it should act as a support level. If this level does not hold, BABA may test the all-time low (ATL).
