AMD $177.55 support, $260 Target0. AMD consolidating here after a correction from $227
1. Expect it to head back to the ATH, and then $260.
Trade ideas

AMD target $252And why should the party stop now, right?
This work is all based on my dowsing, fyi. No technicals.
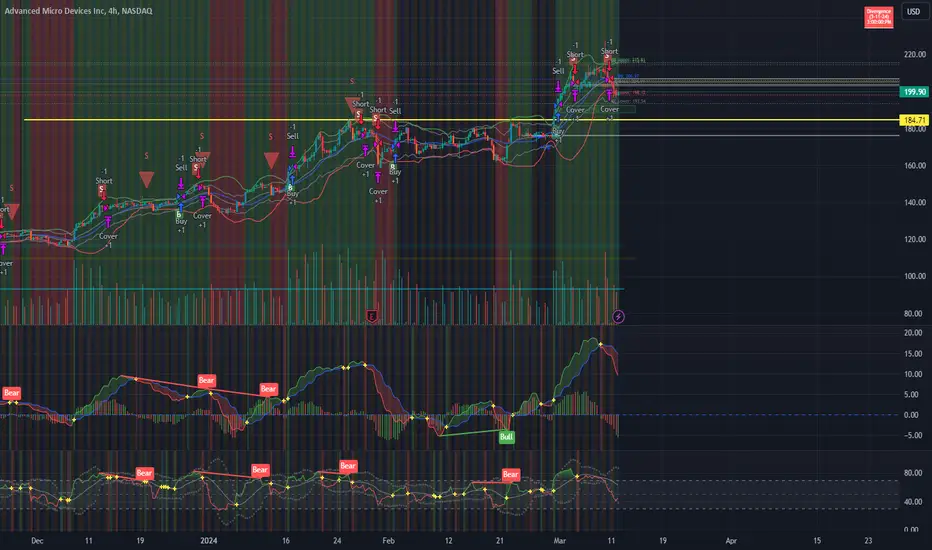
AMD hit my upside target on Friday and immediately, today, the downside plus 2 pts. I had the order backwards, which sucks, but regardless, they are nailed.
Today is a date on my calendar from a past reading, so that combined with AMD hitting a target, this is a typically an indication to look for a good reversal.
Energy is a little bearish, which may be into tomorrow, but overall bullish. I'm expecting another new high. Possible stall around $215-16, and then $252 into next Friday.
That's all for now.

AMD and Sony Semiconductor Revolutionize Autonomous DrivingIn a groundbreaking collaboration, Advanced Micro Devices ( NASDAQ:AMD ) and Sony Semiconductor Solutions ( SGX:SSS ) have joined forces to pioneer the next generation of LiDAR technology, a crucial component in autonomous driving systems. Leveraging AMD's cutting-edge adaptive computing technology, the newly unveiled LiDAR automotive reference design promises unparalleled accuracy, reliability, and efficiency, setting a new standard for automotive safety and innovation.
Empowering Autonomous Vehicles with Precision and Reliability:
LiDAR (Light Detection and Ranging) technology is instrumental in providing depth perception and environmental mapping for autonomous vehicles. By harnessing the power of AMD's adaptive computing technology, the SSS LiDAR reference design offers exceptional object detection and real-time analysis capabilities, essential for navigating diverse driving scenarios with precision and reliability. This collaboration marks a significant leap forward in the quest to enhance the safety and efficiency of autonomous driving systems.
Pushing the Boundaries of Technology:
Yousef Khalilollahi, Corporate Vice President & General Manager of AMD Adaptive Computing Group, highlights the transformative impact of adaptive computing technology on LiDAR advancements. By integrating AMD's innovative solutions into the LiDAR reference design, the collaboration exemplifies a shared commitment to pushing the boundaries of technology and driving innovation in critical industries.
Setting New Standards in Performance and Adaptability:
Takayoshi Ozone, General Manager of the Automotive Development Department at Sony Semiconductor Solutions Corporation, emphasizes the significance of incorporating AMD adaptive computing technology into the LiDAR reference design. This strategic collaboration enables Sony Semiconductor Solutions to deliver cutting-edge solutions that set new standards in performance, reliability, and adaptability, addressing the evolving demands of the automotive industry.
Unlocking New Possibilities for Autonomous Systems:
The SSS LiDAR reference design, powered by AMD Zynq™ UltraScale+™ MPSoC adaptive SoCs and Artix™-7 FPGAs, empowers automakers and automotive equipment suppliers with a comprehensive perception platform. This platform enables autonomous vehicles to navigate complex driving scenarios with exceptional precision and identify potential hazards in real-time. The combined efforts of SSS and AMD are poised to accelerate the adoption of LiDAR technology across various industries, unlocking new possibilities for autonomous systems worldwide.
Driving the Future of Autonomous Driving:
As autonomous driving technology continues to evolve, collaborations between industry leaders like AMD and Sony Semiconductor Solutions play a pivotal role in driving innovation and shaping the future of transportation. By harnessing the power of advanced computing solutions, LiDAR technology is poised to revolutionize the automotive industry, ushering in a new era of safer, more efficient, and more reliable autonomous vehicles.
In conclusion, the partnership between NASDAQ:AMD and Sony Semiconductor Solutions represents a significant milestone in the advancement of LiDAR technology and autonomous driving systems. With their combined expertise and commitment to innovation, these industry leaders are driving the future of transportation and paving the way for a safer and more connected world.

AMD trendWill AMD hold this trend on the 4hr its been following since November of 23’? Watching this closely and will add calls from here.

AMD charted for 19MarIf we open up above this floor, I will
be looking to take AMD long up to resistance (188.26)
If we open up below the floor (185.25), then
I'd look to short down to 179.55

AMD - What to expectHere we see AMD playing its mathematical levels perfectly. After breaking its last high of $163 price rose exactly to the 1.618 ($226). We saw supply dump at this price giving us a clear sign of what's next. Here are the 3 Scenario's on the weeklytime frame of what will happen next.
1. The momentum will pick back up ( as shown with the RSI bouncing off the 70). This could send price back up to $226, and a break of that level would send AMD to around $253.
2. We continue to fall to retest our first key level. This level is represented by the $163 level. This would be a perfect retest of old resistance being tested as new support.
3. We get a full retracement. In this case AMD will fall somewhere between $120-125. This is the 0.618 of our micro move and macro move. Amazing how they both align with one another. This has also been established as a key level with confluence before the breakout.

AMD ATHS, more to come?Watching AMD make new highs.
perhaps some consolidation here at 200-210.
Looking for 207, 220

AMD update. The AMD chart shows an interesting development with a potential breakout from a 4hr bull pennant pattern. This follows the recent announcement of chip maker incentives, which could potentially impact the company's performance. However, remember that the stock market is volatile and reaching new highs is not guaranteed. This is not financial advice, and other factors are crucial before investing. What are your thoughts on this potential breakout and the broader market sentiment?

Hitting previous strong resistance level. Might bounce.Previous resistance is new support. Hitting previous resistance levels. Looks strong. Possibility to bounce. Watch nvda meeting on 18th as if that goes well this will go well I think.

AMD's Stock Outlook: A Quick Technical AnalysisAdvanced Micro Devices (AMD) has recently hit a notable point in its stock movement. After a strong rally, it met resistance at the upper boundary of the 20-day SMA Bollinger Bands and is now approaching the 200-day Hull Moving Average (HMA). This approach is critical as it indicates a potential shift in the stock's longer-term trend.
In the last few days, AMD has seen increased selling, pushing the Relative Strength Index (RSI) towards a neutral level. This suggests a cooling period after a phase of being potentially overbought.
Looking forward, the long-term view on AMD remains bullish. However, a key factor to watch is whether the stock stays above the 200-day HMA, ideally showing a strong bounce from this level. If it falls below the HMA, it's worth observing how it reacts to the lower support level of the Bollinger Bands.
In summary, AMD's stock is at a crucial juncture, with its behavior around the 200-day HMA being a significant indicator to watch for future direction.

AMD bearish scalp ideaAmd recently broke out when it cleared prior resistance at roughly $185. it has since shown some weakness and a possible pullback to that $185 area. The 1hr TF shows that we have started to pivot and a break of the $200 whole number was confirmation as well.
AMD - Long IdeaDear traders,
Id like to share this idea in order to take long positions. After the rally AMD is consolidating, RSI have to "relax".
166- 186$ is is a good price range to look for buying opportunities (previous resistances).
best,

AMD : BUY THE DIP ?- Share prices of the microchip giant have been trading above a bullish trend line since the end of October, the long-term trend is therefore bullish.
- We can easily observe that prices follow phases of bullish impulse and bearish corrections, entirely symptomatic of an healthy bullish trend.
Correction phases allow the market to take a break, take some profits and test newly established support levels, before registering new highs thanks to dip buyers.
However, we can see that during the very last bullish phase, which led prices towards $227.50, the market registered its strongest acceleration since the start of the trend.
This acceleration took the market far above its bullish trend line, before registering a sharp pull-back.
The Ichimoku indicator remains in a bullish configuration, but the market has already given a bearish alert by breaking its Kijun line.
- This movement may be difficult to interpret for traders.
While the bullish trend remains valid for the moment, the strong excess recorded recently must be corrected and could even spell the end of the trend.
It is still too early to talk about a bearish reversal, but it will be interesting to see how the market reacts to the impact on the first significant support zone at $184.00. This level should also represent an interesting test for the Chiko Span on its Kijun.
If this level ever drops, the situation will become terribly dangerous for the asset on a technical level.
Indeed, breaking the last peak is never a good sign in a long-term bullish trend, especially since the only remaining support would be represented by a trend line that has already been well hammered, as well as an extremely thin ichimoku cloud.
Will the market bounce back over $184.00 and return to new highs?
Is a reversal underway?
To be continued...
Pierre Veyret, Technical Analyst at ActivTrades
The information provided does not constitute investment research. The material has no been prepared in accordance with the legal requirements designed to promote the independence of investment research and such is to be considered to be a marketing communication.
All information has been prepared by ActivTrades ("AT"). The information does not contain a record of AT's prices, or an offer of or solicitation for a transaction in any financial instrument. No representation or warranty is given as to the accuracy or completeness of this information.
Any material provided does not have regard to the specific investment objective and financial situation of any person who may receive it. Past performance is not reliable indicator of future performance. AT provides an execution-only service. Consequently, any person acing on the information provided does so at their own risk.

WILL AMD CONTINUE ITS MARK UPbased on previous analysis (refer link below)
it looks like The current Trading Range is Re-Accumulating (Schematic #1)
With a Spring signal, in an existing previous Uptrend, it is a strong signal to buy
This is what David Weiss termed as a Feather's Weight
position initated as attached
always respect risk
Pure Wyckoff

AMD - Chart analysisClear divergence on AMD daily tf. Wait for further confirmation to continue with trade.

AMD flashed the strongest 1W sell signal you can get.Advanced Micro Devices (AMD) has hit the top of the Fibonacci Channel Up last week and immediately got rejected, closing the 1W candle almost flat. This is a significant 1 week turnaround, which may evolve into a bearish reversal as the 1W RSI gave the strongest sell signal possible.
That is reversing on the 82.50 (overbought) level, which since the 2009 bottom of the U.S. Housing Crisis has always delivered a strong medium-term correction. If we focus on the last 4 years alone, we can see on the chart 4 such correction events ranging from - 21.50% to -39.50%.
As a result, we are sellers on AMD, aiming at a $180 minimum (-21.50%). If it drops more, we will wait for a more comfortable buy at $140 (-39.50%), which should potentially make contact with either the 1W MA50 (blue trend-line) or the 1W MA100 (green trend-line). The latter has been a former Resistance during the Bear Cycle that turned into Support after May 2023, while the 1W MA50 has two clear bottoms that evolved into aggressive rallies since the week of May 01 2023.
Basically this signal is more useful to long-term investors for when taking profit and how to make two lower buy entries and manage the long-term risk effectively, while having a $300 long-term target.
-------------------------------------------------------------------------------
** Please LIKE 👍, FOLLOW ✅, SHARE 🙌 and COMMENT ✍ if you enjoy this idea! Also share your ideas and charts in the comments section below! This is best way to keep it relevant, support us, keep the content here free and allow the idea to reach as many people as possible. **
-------------------------------------------------------------------------------
💸💸💸💸💸💸
👇 👇 👇 👇 👇 👇
