AAPL Daily Chart Analysis – Bullish Continuation Setup | Target Strong Support Zone: $243 – $258 area
Price previously bounced from this level, confirming it as a major demand zone.
• Resistance Level: $289
This is the next major resistance marked on the chart. A breakout above this level could open the path toward $300+.
• Market Structure:
After a correction from recent highs, price formed a strong reversal from support and is attempting bullish continuation.
• Bullish Scenario:
If price holds above $258–$260 support and buyers step in with volume, we can expect a move toward $280 first, then $289 as the main short-term target.
• Breakout Confirmation:
A strong daily close above $289 would confirm trend continuation toward psychological level $300.
⸻
🎯 Trade Idea (Bullish Bias):
Entry Zone: Near $258–$262
Target 1: $280
Target 2: $289
Extended Target: $300
Stop Loss: Below $243 (major support)
⸻
⚠️ Risk Note:
Always manage your risk properly. Wait for confirmation before entering. Market volatility can invalidate setups.
Apple Inc.
No trades
What traders are saying

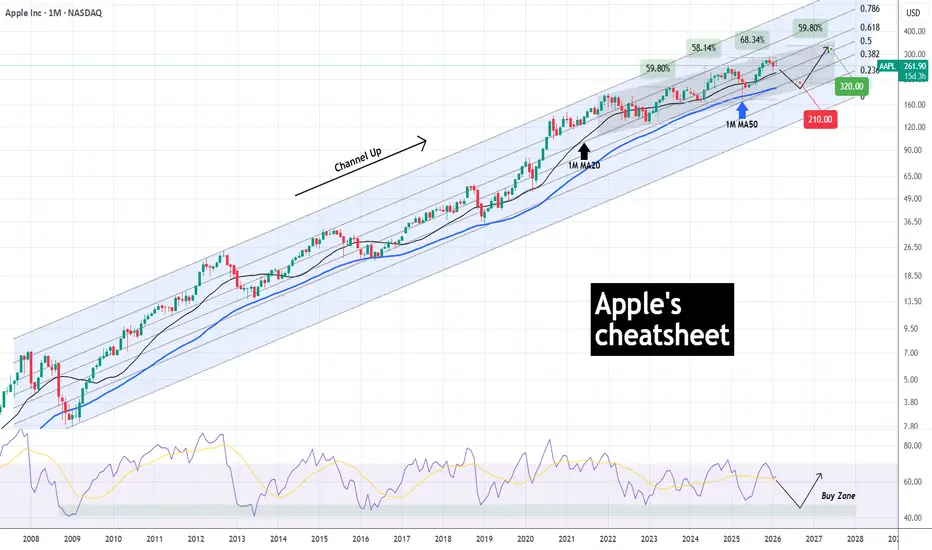
APPLE The 2026 correction will be a massive buy opportunity.Apple (AAPL) has been trading within a Channel Up since the start of the 2008 U.S. Housing Crisis. With a massive recovery/ rally in the following years and an obvious deceleration/ maturity since the 2022 Inflation Crisis, this pattern has a very distinct structure that long-term investors can take advantage of.
As you can see, the 1M MA50 (blue trend-line) is the market's multi-year Support. Since the March 2009 break-out, every contact (and near approach) with that trend-line (5 so far) has been the ultimate long-term buy entry.
That happens when the Channel Up tops (Higher High) and Bearish Legs (Cycles) are initiated that lead to those 1M MA50 bottoms. What confirms those Bear Cycles is a break (and monthly closing) below the 1M MA20 (black trend-line). The market came close to testing this last month.
Based on the more recent 4-year Channel Up, Apple can make contact with its 1M MA50 again around $210. The ultimate Buy Signal will be given by the 1M RSI, when it hits its 17-year Buy Zone. It has done so during every Bear Cycle bottom.
As far as Apple's next potential High, we expect that to be around $320, which represents an almost +60% rise from the 1M MA50, a standard Bullish Leg within the 4-year Channel Up.
---
** Please LIKE 👍, FOLLOW ✅, SHARE 🙌 and COMMENT ✍ if you enjoy this idea! Also share your ideas and charts in the comments section below! This is best way to keep it relevant, support us, keep the content here free and allow the idea to reach as many people as possible. **
---
💸💸💸💸💸💸
👇 👇 👇 👇 👇 👇
Hate to crash the bear party, but Bitcoin is primed to explode.Bitcoin is following the same growth pattern Apple did as it established its massive uptrend. Many investors are bearish, calling for low targets like $50K or even $30K—but most don’t realize Bitcoin is likely to rally all the way to a new all-time high.
The trend is your friend, and Bitcoin is in a monstrous uptrend. Don’t fight it. Work with it.
As always, stay profitable.
— Dalin Anderson

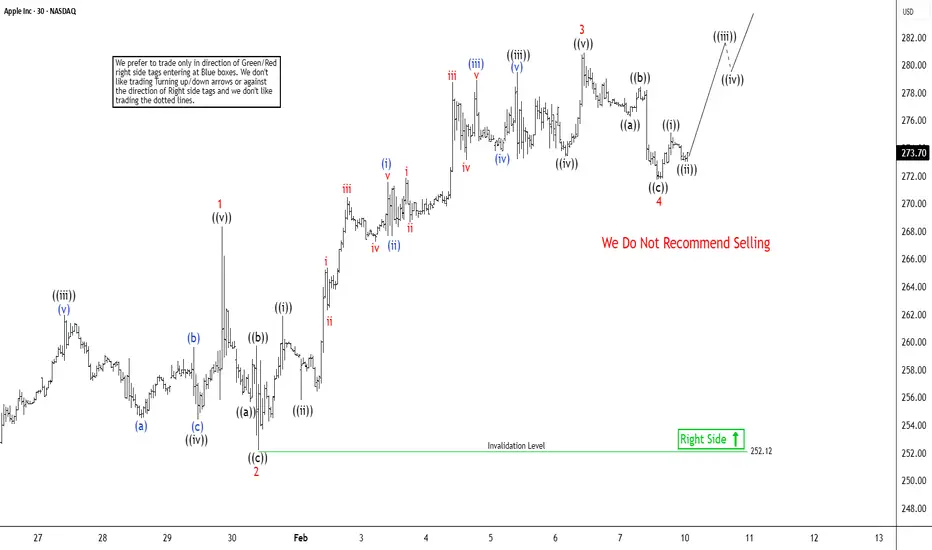
Apple (AAPL) Set to Complete Impulsive Rally from Jan 21 LowThe cycle from the January 21, 2026 low in Apple (AAPL) is unfolding as a five‑wave Elliott Wave impulse. From that low, wave 1 advanced to $268.34, followed by a corrective pullback in wave 2 that terminated at $252.12. The stock then resumed its upward trajectory in wave 3. Within this third wave, wave ((i)) concluded at $261.90, while the subsequent pullback in wave ((ii)) ended at $255. Momentum strengthened thereafter, carrying the stock higher in wave ((iii)) toward $279.50. A modest dip in wave ((iv)) found support at $273.50, before the final leg, wave ((v)), reached $280.90. This marked the completion of wave 3 at a higher degree.
Wave 4 unfolded as a zigzag correction. Declining from the wave 3 peak, wave ((a)) ended at $276.28. A brief rally in wave ((b)) followed, topping at $278.47. The final leg, wave ((c)), extended lower to $271.70, thereby completing wave 4 at the higher degree. With this correction in place, expectations turn toward the development of wave 5, which should extend the impulse sequence further to the upside. A decisive break above the wave 3 peak would strengthen the probability of continued gains against the January 21 low. In the near term, as long as the pivot at $252.12 remains intact, pullbacks are likely to attract buyers. These retracements may unfold in either three or seven swings, offering opportunities for renewed strength and continuation of the broader upward cycle.
AAPL GEX 280 rejection multiple times🔶 AAPL – Rejection at 280 Call Resistance, Testing Support While Above HVL 🔶
On the daily chart, AAPL has once again been rejected at the 280 call resistance , a level that has now rejected price multiple times, confirming it as a significant call-side ceiling . 🔴
Yesterday’s rejection from 280 triggered downside momentum, and today price is showing a clear follow-through move lower, with AAPL currently down around 3% , signaling emerging relative weakness compared to its previously strong performance within the tech sector. 🔴
Technically, price has now moved to the 50-day moving average , which adds short-term pressure to the structure. Despite this weakness, the broader regime remains supportive for now:
Price is still trading above the High Volatility Level (HVL) 🟢
The GEX profile remains positive , suggesting dealer positioning is not yet in a fully reactive downside regime 🔵
From a structural perspective, the next key area to monitor sits around the 265–266 zone , which represents:
a nearby technical support level 🔵
an area just below the 50 SMA where buyers may attempt to stabilize price 🟢
🔶 Key Structure to Watch 🔶
280 – confirmed call resistance / rejection zone 🔴
HVL – regime pivot, still holding above 🟢
265–266 – near-term support area 🔵
Positive GEX – supportive but weakening context 🔵
If AAPL holds above HVL, downside may remain controlled despite short-term weakness. However, continued rejection at 280 combined with relative underperformance could shift sentiment if support levels fail.
Best,
Greg

Quant Signal Flags Exhaustion as AAPL Tests Institutional AAPL QuantSignals V4 Weekly 2026-02-11
ACTION: BUY PUTS
• INSTRUMENT: $277.5 PUT
• EXPIRY: 2026-02-13
• ENTRY ZONE: $1.65 - $1.75 (PREMIUM PRICE)
• TARGET 1: $2.15 (+25%)
• TARGET 2: $2.75 (+60%+)
• STOP LOSS: $1.25 (-25%)
RISK GRADE: MODERATE (SPECULATIVE)
• THESIS ERROR: A sustained hourly close above $281.00 invalidates the bearish mean-reversion thesis.
• EXIT PROTOCOL: Scale 50% at Target 1 ($2.15) to lock in gains; move Stop Loss to breakeven. If $275.74 (Katy Target) is reached, exit the remaining position entirely.
QS V4 ELITE | WEEKLY TREND LOGIC
Confidential Signal | Multi-Day Edge | Not Financial Advice

APPLE: Market of Sellers
Balance of buyers and sellers on the APPLE pair, that is best felt when all the timeframes are analyzed properly is shifting in favor of the sellers, therefore is it only natural that we go short on the pair.
Disclosure: I am part of Trade Nation's Influencer program and receive a monthly fee for using their TradingView charts in my analysis.
❤️ Please, support our work with like & comment! ❤️

AAPL CCI system read: daily scaleBulls keep winning in the CCI system challenges. I am focusing on the upper 260s-low 270s area for entry. Target into mid-upper 300s currently.
Will play it with out of money calls due to the structure I need to maintain to stay inside my trading discipline. I use a 5% stop but the stop area (250 zone) does not fit that profile so I'll use out of money calls here with the potential downside being 5% of the lot size value I'd use if I bought the stock. That said, if the anticipated pullback which will even allow me to position long does get to the low 260s I will follow the more traditional path of buying the stock.
Do have a heavy travel schedule for the next 4 weeks, I may miss this all together

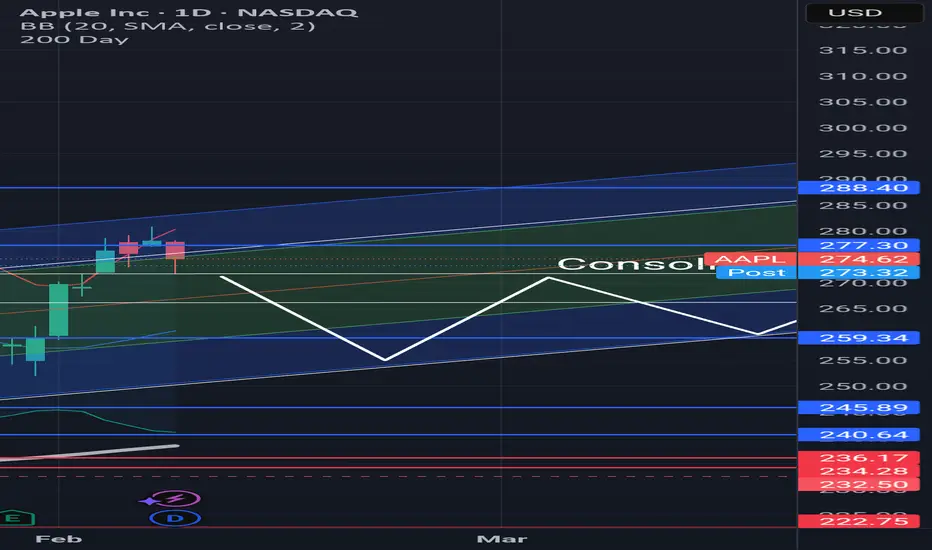
Still in Consolidation, still BullishThis is still going through consolidation, it went up higher than expected. But its not unusual, still bullish.
AAPL CCI system weekly readcompliment to the daily read posted prior. Has similar context. Weekly likes a long side in the 260s with a slightly lower initial target in the 330s

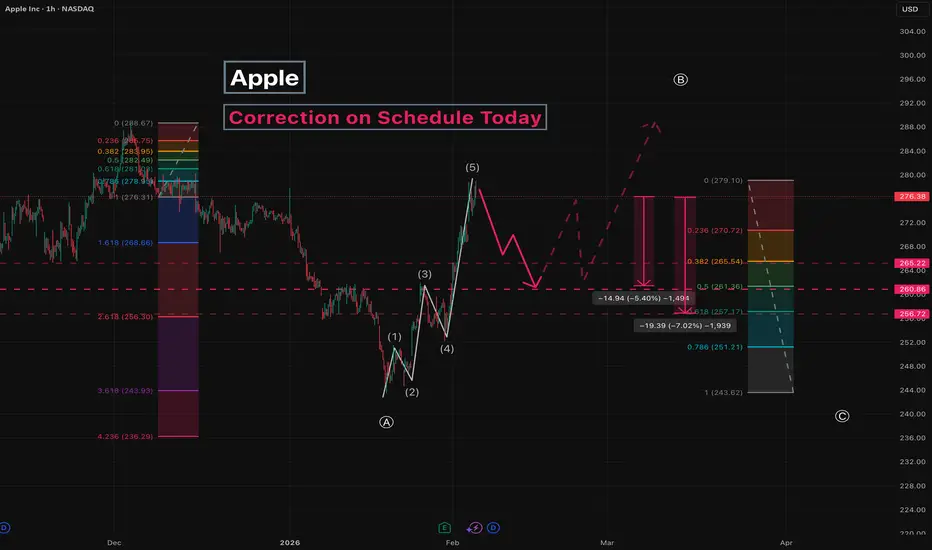
Apple - Correction on Schedule TodayWe continue to cover corrective moves in Apple stock.
Previously, we discussed Wave A .
Currently, the stock price is in Wave B .
The five -wave impulsive move up is complete and is now being corrected.
Key targets:
265 - local correction
260
256
Potential move from current level: 5-7% .
After that, expect a return to the growth phase,
with possibly one more small upward impulse toward the 290 area, slightly above or below, before Wave C develops.
---
Subscribe and leave a comment.
You’ll get new ideas faster than anyone else.
---
RSI Divergence – Momentum Weakening Framework📉 RSI Divergence – Momentum Weakening Framework
This chart illustrates how RSI divergence helps identify weakening momentum during a down move, even when price continues to fall.
RSI divergence is not a buy or sell signal by itself. Instead, it highlights a loss of momentum, often appearing before price stabilizes or reacts.
This framework focuses on:
The relationship between price action and momentum
Identifying exhaustion during sustained moves
Avoiding emotional entries during strong trends
RSI divergence reveals what is changing under the surface, not what price must do next.
📊 Key Observations
1️⃣ Price Action (Lower Low Formation)
In the price chart:
Price continues to make a lower low (LL)
Visually, the trend still appears bearish
At this stage, most traders assume downside continuation.
2️⃣ RSI Behavior (Higher Low Formation)
On the RSI indicator:
RSI fails to make a lower low
RSI instead forms a higher low (HL)
This creates a clear mismatch between price and momentum.
3️⃣ What RSI Divergence Means
RSI divergence occurs when:
Price and RSI move in opposite directions
Price shows strength in the trend, but momentum does not
Important clarification:
RSI divergence does not predict a reversal.
It signals that selling pressure is weakening, even if price is still falling.
4️⃣ Why This Matters
In trending markets:
Price can continue falling even as momentum fades
Strong trends slow down before they reverse or consolidate
RSI divergence often appears during:
Trend exhaustion
Pullback completion
Volatility compression before a reaction
Momentum usually changes before price structure does.
5️⃣ How RSI Divergence Is Used Effectively
RSI divergence works best when:
Used as a context tool, not a trigger
Combined with price structure or support zones
Followed by visible price stabilization or reaction
RSI tells you pressure is changing, not where to enter blindly.
6️⃣ What Invalidates the Idea?
The divergence loses relevance if:
Price continues making strong impulsive lower lows
RSI starts breaking down and follows price lower
No pause or reaction appears in price
Divergence without price response is information, not confirmation.
📊 Chart Explanation
Symbol: FX:EURUSD
Timeframe: 2H
This chart highlights:
Price forming a clear lower low
RSI forming a higher low
A bullish RSI divergence structure
Early signs of momentum exhaustion
Expected Market Behavior:
Strong trend → Momentum slows → Divergence forms → Price stabilizes or reacts
RSI divergence explains why momentum is weakening, not when to enter.
📘 How to Use RSI Divergence Correctly
Best Practices
Use RSI divergence as a warning signal
Always wait for price confirmation
Combine with structure, zones, or trend context
Common Mistake
Buying immediately after spotting divergence
Correct Approach
Let price show that sellers are losing control
⚠️ Disclaimer
For educational purposes only
Not financial advice
Markets involve risk

Apple( AAPL0- BearishAPPL -- Forming a Head and shoulder pattern in D1 time frame.
Another bearish head and shoulder formation in i hour time frame.
This 1 HR bearish pattern coming right at the previous strong resistance where stock has corrected almost 12%.
1. Smaller Right shoulder in 1 hour time is forming.
Entry price: Break below neck line : 273.81
Stop loss: 281.46
Target: 261.56,257.26
risk to reward: 3.6 : 5

APPLE What Next? SELL!
My dear subscribers,
APPLE looks like it will make a good move, and here are the details:
The market is trading on 278.07 pivot level.
Bias - Bearish
Technical Indicators: Both Super Trend & Pivot HL indicate a highly probable Bearish continuation.
Target - 269.38
About Used Indicators:
The average true range (ATR) plays an important role in 'Supertrend' as the indicator uses ATR to calculate its value. The ATR indicator signals the degree of price volatility.
Disclosure: I am part of Trade Nation's Influencer program and receive a monthly fee for using their TradingView charts in my analysis.
———————————
WISH YOU ALL LUCK

AAPL: Free Money is loadinnnIf price can hold above the 200-day MA, there will be 10–15% up move... it’s a no-brainer setup.
Currently testing a rising trendline, and RSI confirms the strength.
A break of the trendline could trigger a deeper pullback — but that scenario looks very unlikely at this stage.

Apple Pullback to TrendlineApple is currently pulling back toward its ascending trendline, which has been a key structural support throughout the recent uptrend.
Price is also hovering near the horizontal support zone around $260–268, making this area a high-confluence demand zone (trendline + horizontal support).
The moving average has started to flatten, suggesting short-term indecision, but the overall trend remains bullish as long as price holds above the trendline.
Bullish Scenario
• Holding above $260–268 and the ascending trendline
• Upside targets:
• $285–290 (previous high)
• $300 (major psychological resistance)
• A clean bounce from the trendline confirms trend continuation.
Bearish Scenario
• Daily close below the trendline and $260
• Downside targets:
• $245
• $230
🛑 Stop Loss (English)
• Long positions: below $258
• Short positions: above $275 after confirmed breakdown

Apple at Rising Trendline Support:AAPL remains inside a long-term ascending trendline structure on the daily timeframe.
Key observations:
• Major rising trendline support currently around 252–255
• Horizontal resistance zone near 260–262
• Moving average flattening after recent pullback
• Price reacting exactly at the confluence of trendline + structure support
This is a decision zone: either buyers defend trendline, or structure shifts bearish.
🟢 Bullish Scenario
• Strong reclaim above 262
• Daily close above horizontal resistance
• Holding above rising trendline
Upside targets:
• 275
• 285
• Extension toward 300
Would confirm continuation of macro uptrend.
✅ Long Stop Loss:
• Below 250
• Conservative SL: below 245
🔴 Bearish Scenario
• Daily close below 252
• Clear break of rising trendline
• Failure to reclaim 255
Downside targets:
• 240
• 225
• 210 (major structure support)
Would signal short-term trend reversal.
✅ Short Stop Loss:
• Above 265
• Conservative SL: above 270
⚠ Trading Notes (English)
• Trendline breaks often cause fast momentum expansion
• Watch volume on break
• Mid-zone entries offer weaker R/R

Hello traders, Friday, February 13, 2026 AAPL: 261.73www.tradingview.com
Trading idea:
Bullish entry in the 260.00 zone with a possible quick profit take in the 268.00 zone. If the stock breaks this price, it could target the 280.00 resistance zone.
In our system, we see two possible bearish entries: #1 If the stock rejects the 268.00 zone with an exit in the 260.00 zone, that could be our first bearish entry. #2 If it falls below 260.00, it could target the 252.00 zone; this could be our profit take.

APPLE Set To Grow! BUY!
My dear friends,
Please, find my technical outlook for APPLE below:
The instrument tests an important psychological level 255.79
Bias - Bullish
Technical Indicators: Supper Trend gives a precise Bullish signal, while Pivot Point HL predicts price changes and potential reversals in the market.
Target - 263.27
Recommended Stop Loss - 251.83
About Used Indicators:
Super-trend indicator is more useful in trending markets where there are clear uptrends and downtrends in price.
Disclosure: I am part of Trade Nation's Influencer program and receive a monthly fee for using their TradingView charts in my analysis.
———————————
WISH YOU ALL LUCK

Quick Short Idea $AAPLAAPL looks weak after the quick morning move. It can go back to the opening price if it rejects the 280.00.
Trade Plan:
Short Entry - 280.00
Final Target - 277.00
Stop Loss - 281.00

AAPL (Apple) Stock Update, Price DecreaseAs of today Apple stock market traded between a low of $267.33 and high of $271.88. shares are currently priced at $269.48, with the stock down to 2%. well thanks to the success of the iPhone 17 series, Apple has seen "unprecedent demand," according to CEO Tim Cook. however strong demand could be challenging due to supply chain issues at the moment.
India is pushing to boost its electronics manufacturing, with Apple, increasingly betting on the shift away from china. Apple investors are focused less on any one headline and more on the ongoing tension between costs and capacity.
In respect of the structure, it shows a sell signal eyeing 251.25 -243.63 as anticipated drop limit.
Thanks for reading.

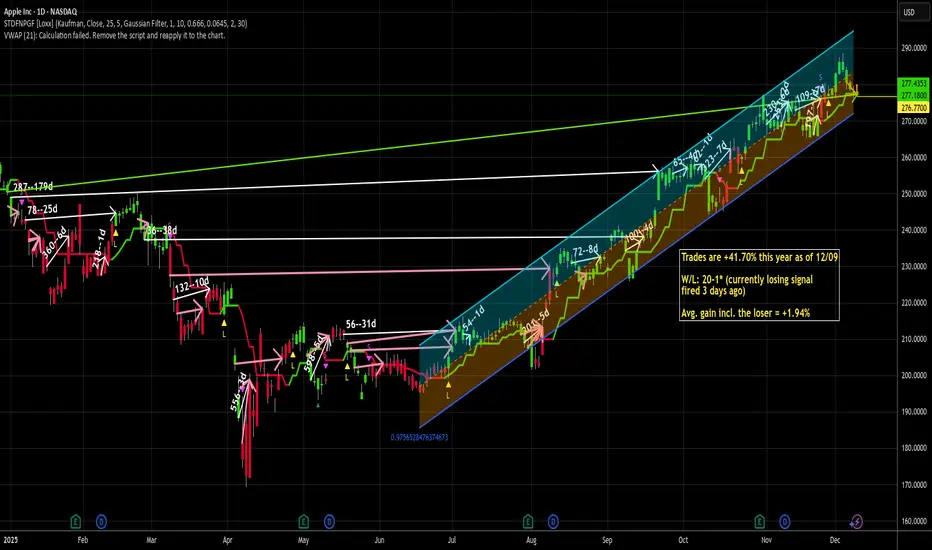
I like AAPL for uncertain times -- long at 276.77First and foremost, I like AAPL here because the system I use likes AAPL here. It actually liked it 3 days ago, but I decided to wait and I'm glad I did because I'm getting a better deal here. I jumped in just before the end of the after hours session today because I couldn't wait any longer. The Fed meeting is a wild card tomorrow, but if the market rallies on it, i'd miss out if I waited. If it dumps, it'll just take longer to make my money. That's a risk/reward that favored going long today for me. I understand, though, why some would want to wait.
Since the beginning of the year, the 20 closed trades have netted a total of +41% on a stock that is up under 11% on the year. They've produced a per lot/day return of around 12 basis points, which is 3x the long term average return of SPY.
While AAPL struggled early in the year, it has gotten its footing and since mid summer has been a freight train chugging higher and higher as shown by that pretty little regression channel. It is trading above its 20, 50 and 200d MAs as well.
An underrated feature of AAPL in my opinion (although @matthias would take the opposite position, I think) is that they have a huge pile of cash. They are holding over $100B in cash and marketable securities right now. While long term, I'd rather have that cash be used to innovate, I do not like the looks of the economy right now, and I think that AAPL's huge cash hoard gives them a cushion that a lot of other stocks don't have right now. I like that safety.
If Chairman Powell can manage to not rattle the markets tomorrow with hawkish rhetoric, and if Trump can keep his little fingers from typing out threats against Fed independence if Powell doesn't lower rates (doubtful), I think this could be a quick turnaround trade, as AAPL is already down 5 days in a row (though that's not terribly unusual for AAPL).
If the trade isn't a quick one, I am as always, not averse to adding to my position and tactically taking profits while waiting for the original lot to make its curtain call.
As always - this is intended as "edutainment" and my perspective on what I am or would be doing, not a recommendation for you to buy or sell. Act accordingly and invest at your own risk. DYOR and only make investments that make good financial sense for you in your current situation.
BTW - ignore the pink arrows on the chart, those are part of something I'm working on and it was too cumbersome to go hide them all. Also, the green arrow is simply for my use in determining YTD return of the stock quickly. Ignore that, too. Also, I mistyped in the text box on the chart and I can't fix that. The average return per trade is 1.98%, not 1.94%. Not a big difference, but I like to be accurate. Sorry for that error.
AAPL Sitting in the Middle — How I’m Reading It for Feb 2
1-Hour View — Bigger Picture First
On the 1-hour timeframe, AAPL is no longer trending cleanly. The strong push higher earlier stalled, and since then price has been moving sideways with overlapping candles.
Structurally, this is range behavior, not continuation. Higher lows are not clean, and higher highs are being rejected quickly. That tells me buyers are present, but not aggressive.
Until AAPL can reclaim and hold above the prior resistance area near 262–265, I don’t see a strong bullish case on the higher timeframe. At the same time, sellers haven’t been able to break support decisively either.
From a 1H perspective, this is a neutral market waiting for direction.
15-Minute View — Where Trades Actually Happen
On the 15-minute chart, things are clearer.
Price has been rotating between two well-defined areas:
• 258–260 acting as a balance / pivot zone
• 252–255 acting as demand where buyers step in
• 262–265 acting as supply where price gets sold
Most recent price action shows AAPL stalling just under resistance again, with volume tapering off. That usually means patience is required — chasing in the middle doesn’t offer good risk.
The edges of the range are where the trade makes sense.
GEX — Confirmation, Not a Signal
GEX lines up well with what price is already telling us.
The HVL around 255–257 explains why price keeps stabilizing there. That area is comfortable for the market and tends to slow momentum.
Above price, 260–265 lines up with call resistance and positive gamma supply. Rallies into this zone are likely to face selling unless volume expands meaningfully.
Below price, 252–250 aligns with put support. If that area breaks cleanly, downside can accelerate quickly.
GEX confirms that AAPL is currently range-controlled, not trending.
Trading Plan for Feb 2 (Intraday Focus)
Primary Idea — Fade the Upper Range
If AAPL pushes into 262–265 and stalls or shows rejection on the 5–15m, I’ll look for short setups.
Targets would be a move back toward 258, then 255 if momentum builds.
This fits the current structure and the gamma positioning.
Options here favor short-dated puts or put spreads, keeping size controlled and profits quick.
Secondary Idea — Bounce Only at Support
If price drops into 252–255 and holds, I’m open to a bounce scalp.
This is not a trend trade — expectations stay modest. I’d only look for a move back into 258–260, then reassess.
For options, this would be small, short-dated calls treated strictly as a scalp.
No-Trade Zone
Between 257 and 260, AAPL has no edge. That area has produced chop and fake moves. If price stays there, I’m fine waiting.
Bottom Line
AAPL is not broken, but it’s also not strong enough to assume upside. Right now, it’s a location-based trading environment, not a directional one.
For Feb 2, the plan is simple:
Trade the edges, manage risk, and don’t force trades in the middle.
Disclaimer
This analysis is for educational purposes only and does not constitute financial advice. Always manage risk and make your own trading decisions.
