APC trade ideas
This apple is getting rottenLOTS of greed. Good for short term pumps but eventually things are going to go bad. It's still on short term trend to hit 199 and maybe touch 200, but I'd be careful of a drop and then a bounce back as we start to head lower. If we reject off 209 and it's looking like 214 isn't possible, look for 184.

AAPL Weekly Harmonic Elliott Wave and Hurst's Cyclic AnalysisReview:
Let's review the key points of our recent updates:
November 21st:
October 26th was the first 40W trough of the current 80W cycle.
40D trough, November 27th 2023.
80D trough, first week of January 2024.
20W trough, middle of March 2024.
40W FLD target is 215.
40W trough, June-July 2024.
December 2nd:
Going back to the count of September 9th.
Wave (V) of a of 5 of (A) of 3.
Target for the peak of wave a is 202.01.
80D trough, January 4th 2024.
December 9th:
Wave 3 of c of (V) of a of 5 of (A) of 3.
Targets for wave (V) peak are 201.27 or 203.64.
December 4th was a 40D cycle trough.
A triangle for wave b of 5, January 16th 2024 is breakout time to the upside.
201-203, end of next week
Wave b is going to correct more in time than in price.
Update:
We do not need much change to our previous statements.
Analysis of the Structure:
It seems we have peaked for wave a of 5 of (A) at 199.62, a little less than our target. What follows is wave b, which I already described in my previous update why I expect it to be a triangle. Right now, we are in wave w of a of b.
Note that there is also a very little chance that we have not yet peaked for wave a. If that's the case, we would peak very early next week (201.27), then will start wave b.
The fib retracement of wave a shows two targets for wave b bottom, 191.52 or 194.61.
Analysis of the Cycles:
We are in the second 5D cycle of the second 10D cycle of the first 20D cycle of the second 40D cycle of the first 80D cycle of the first 20W cycle of the current 40W cycle.
Adding the following points to my previous cyclic analysis:
80D cycle trough expected 2nd to 16th January 2024.
We got a second upside cross of the 40W FLD this week. This gives us a range of target for the peak of 40W cycle: 215-227.

AAPL Short: Wave 1=Wave 5Well, based on my EW counts and Fibonacci extension, we have reached the target of the move up and it's time for it to go down.
Also note that the new high is NOT accompanied by an equivalent RSI(7) high. A divergence.
Also, this is all-time high. You need any reason for a better risk reward?

AAPL: Week of Dec 11 Levels for AAPL for next week.
The probability of momentum is bullish with 66% success.
On Standard Deviation, it is bearish with 59% success.
Pretty on par with what we are seeing across most stocks, signaling some selling and buying.
We sometimes see a fear sell leading into FOMC and then, you know, the moves that come after.
As always, let the PA doing the talking, watch for those conditional breaks.
Safe trades everyone!

Apple - Nothing Is BearishHello Traders, welcome to today's analysis of Apple.
I will only take a trade if all the rules of my strategy are satisfied.
Let me know in the comment section below if you have any questions.
Keep your long term vision.

AAPL: Is it over for this year?AAPL experienced a daily breakdown from a rising wedge with strong volume, indicating significant selling pressure from institutional investors. Both RSI and MACD show robust negative divergences, suggesting a lack of momentum in the recent price surge. For the bullish scenario, AAPL must return to the triangle pattern and continue its upward trajectory.
On the bearish side, today's confirmation with CPI data could trigger a major drop in AAPL's price, with a potential target in the 175-177 range.
Considering the weekly chart (see below), AAPL is rising on smaller volume and hasn't reached the upper trend line, indicating relative weakness compared to the daily chart. As the weekly chart holds more significance due to its longer time frame, there's a higher probability (70%) of a substantial drop rather than a return to the triangle pattern.

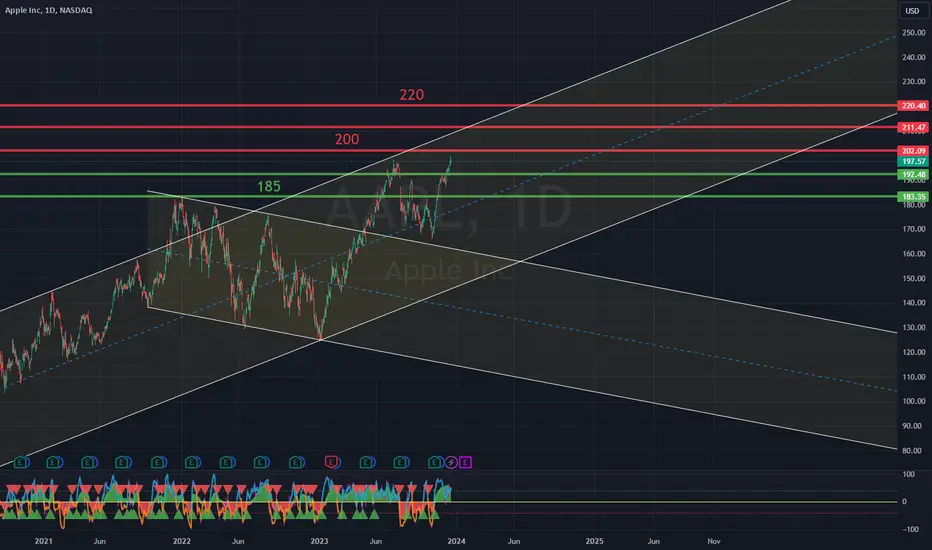
AAPL Looking longApple is looking bullish after breaching resistance and trading above so if we will get a weekly closing tomorrow above mentioned resistance can consider a long in it for the target of 230 levels.
Target Identify by two ways-:
1- One is theoretical way to measure a triangle breakout which is trading on it's all time high and no previous resistance is standing so we can use the Height of triangle from where it took resistance to swing low it made after for what are the potential target can arrived in coming sessions.
2- A rising trendline resistance I plotted on this chart, which is also adjoin the same levels where the height of triangle is indicating the coming target, so according to me the point of target is looking so logical.
Stop loss-:
So if we are going long in any of scrip I think the exit in loss (stop loss) is more important so I always believe to take and mention stop loss and that is 181 levels are looking a strong support now on weekly candle below basis which is looking a good R:R.
KINDLY NOTE-: This is not and trade or investment advice. This idea is meant for learning. Invest your capital at your own risk.
Regards-: Amit (AR)

buy Apple @ 200. Target 450Apple a new breakout after consolidation & rounding bottom .
best buy @ 197-200.
Target 450 in a year


Appl ideaAt the moment, Apple shares are getting the energy necessary for an upward jump towards bigger numbers. Take advantage of Apple's losses and try to take a buying position at the right time.

AaplAapl, looking for a bounce back up to 195.00 to form a right shoulder for a correction down to 182-185
The bounce back to 195 is only legit if 192 support holds..
If 192 goes before 195 then thats a double top.

Apple AAPL Technical AnalysisSee Chart Above For Analysis.
-Price inside HTF weekly/Daily supply
-Shrots valid but aggressive so need confirmation + smaller risk
-Longs valid inside demand but LTF has shown confirmation
-FED Rates Wednesday (Volatiltiy)

Apple a Case Study! Who Sold High Who Will Buy Low?High mates, Sharing weekly Chart of American tech Ginat Apple as we all know that after a parabolic run from swing lows to all time highs it has given a tremndous returns of 59% from swing low to all time high in just six months so after this heat run it became often or always seen some profit booking, fresh shorts and corrections the reason behind this can be anything but one thing is damn sure in markets that no matter how big or smart is a trader or investor till date no one has been able to sell at highs and no one has been able to buy at lows.
But with constant study and tracking the movements maybe we can get active near to highs or lows and caan make a good investment or trade, it all depends on our trading setup and mindset. So for this i marked up some S/R and key levels on chart might can help in accumulation or reversal or breakdown trade in coming sessions.
This idea is meant for learning purpose this is not a trade advice.
Best Regards- Amit

APPLE Technical top at $210.Apple (AAPL) hit on Friday our $195.00 short-term target which we called on our latest November 12 analysis (see chart below):
The rally seems far from over as the recent pull-back turned out to be only a Bull Flag pattern, which typically prompts to a continuation of the trend. Being within a long-term Rising Wedge pattern, this pull-back resembles, even on 1D RSI terms, that of March 02, only on weaker strength (reasonably as the sequences get narrower towards the end of the pattern).
That first rally of the Wedged peaked just above the 1.382 Fibonacci extension. The current sequence's 1.382 Fib is at $210.00, which falls perfectly at the top (Higher Highs trend-line) of the Rising Wedge, and that is our medium-term target.
-------------------------------------------------------------------------------
** Please LIKE 👍, FOLLOW ✅, SHARE 🙌 and COMMENT ✍ if you enjoy this idea! Also share your ideas and charts in the comments section below! This is best way to keep it relevant, support us, keep the content here free and allow the idea to reach as many people as possible. **
-------------------------------------------------------------------------------
💸💸💸💸💸💸
👇 👇 👇 👇 👇 👇

AAPL creating rising wedge patternAAPL is creating rising wedge pattern. Setting sell stop order at the previous higher low and stop loss at the last higher high.

APPLE: Short Signal Explained
APPLE
- Classic bearish pattern
- Our team expects retracement
SUGGESTED TRADE:
Swing Trade
Sell APPLE
Entry - 195.71
Stop - 198.97
Take - 188.36
Our Risk - 1%
Start protection of your profits from lower levels
❤️ Please, support our work with like & comment! ❤️

AAPL Weekly Harmonic Elliott Wave and Hurst's Cyclic AnalysisReview:
Let's review the key points of the previous update (December 2nd):
Going back to the count of September 9th.
Wave (V) of a of 5 of (A) of 3.
Target for the peak of wave a is 202.01.
Second 40D cycle of the current 80D cycle.
The 80D cycle trough is expected on January 4th 2024.
Update:
We seriously need no update as our expectations was followed perfectly (hit the play button on the previous update) and we already described the path for the weeks to come.
Analysis of the Structure:
We are in wave 3 of c of (V) of a of 5 of (A) of 3. Mt targets for wave (V) peak are 201.27 or 203.64.
Analysis of the Cycles:
December 4th was the 40D cycle trough. I have not much to add to my previous cyclic analysis. Note that the 80D cycle trough is expected on January 4th 2024, but based on some observations, I am predicting a triangle for wave b of 5, which will take until January 16th 2024 to breakout to the upside.
For now, what we care is that 201-203 is coming very soon (in the next 2 weeks, more probable is the end of next week), then we are starting a correction as wave b, that I do not expect to be deep (at least for now) and its going to correct more in time than in price.

AAPL awaiting breakout to next supply areaNASDAQ:AAPL consolidating tightly. Awaiting the next breakout to around $195 supply area.
Potentially looking at new highs after that.
These are my views and analysis and is only used for educational purposes. I am not a financial advisor.
Nothing in the information posted here is intended to be or should be interpreted as trading advice.

Apple stock: growth or decline after revenue decrease?Due to the economic downturn in China, Apple Inc.'s revenue has been declining for the fourth consecutive quarter. Additionally, it faces growing competition from Huawei.
However, the expectations of investment experts are still higher than the issuer's current stock prices despite JPMorgan experts lowering their forecast to 225 USD. As we can see, the growth potential for Apple's capitalisation remains evident.
This is why our focus today is on the Apple Inc. stock chart (NASDAQ: AAPL).
On the D1 timeframe, support has formed at 187.45, with resistance at 191.40. There is a stable upward trend after the "Descending Wedge" pattern breakdown.
On the H1 timeframe, a rebound from the level of 191.20 could lead to a price increase targeting 198.26. In the medium term, the price could hover around 225.
—
Ideas and other content presented on this page should not be considered as guidance for trading or an investment advice. RoboMarkets bears no responsibility for trading results based on trading opinions described in these analytical reviews.
The material presented and the information contained herein is for information purposes only and in no way should be considered as the provision of investment advice for the purposes of Investment Firms Law L. 87(I)/2017 of the Republic of Cyprus or any other form of personal advice or recommendation, which relates to certain types of transactions with certain types of financial instruments.
Risk Warning: CFDs are complex instruments and come with a high risk of losing money rapidly due to leverage. 67.85% of retail investor accounts lose money when trading CFDs with this provider. You should consider whether you understand how CFDs work and whether you can afford to take the high risk of losing your money.

AAPL is BullishAPPL is extremely bullish, and this time it seems that it would break the glass ceiling of $200 and print a new all time high. Targets are mentioned on the chart.

AAPL Short
Top of Bollinger Bands
Over bought on RSI
Completing Time Count on Weekly
Near top of Megaphone

AAPL STOCK BULLISH RUN CONTINUATIONThe stock of APPLE seems to continue it's Bullish Run as the Bullish Flag Pattern is formed and the breakout is also seen on the charts......
Manage your Risk Reward Ratio Accordingly....
