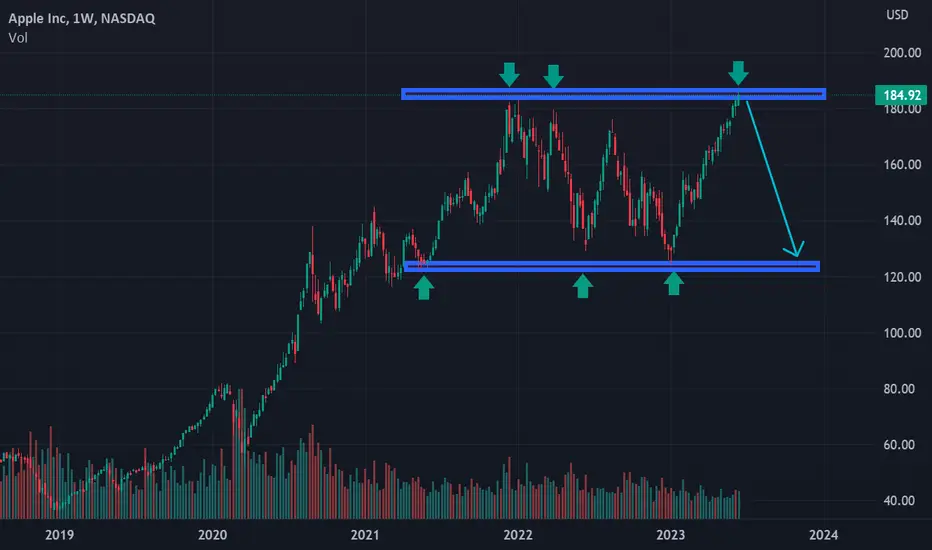
AAPL: Sell ideaOn AAPL we have a sell idea as you see on the chart because we have the breakout wityh force the vwap indicator and the support line by a big red candle with a large red volume.Thanks!
APC trade ideas

AAPL earnings watchAAPL Q4 Sep 2023 earnings are today, Thursday, 11/2/23 at 4:30pm. Apple (AAPL) reported earnings of 1.26 per share on revenue of 81.8 billion for fiscal Q3 ending June 2023. The consensus earnings estimate was 1.19 per share on revenue of 72.81 billion. The company beat expectations by 1.61% while revenue fell 1.40% compared to the same quarter a year ago.
The company said during its conference call it expects fourth quarter revenue to decline approximately 1.4% year-over-year, to approximately 88.88 billion, and sees gross margins of 44% to 45%, which calculates to earnings of 1.34 to 1.40 per share.
AAPL multi-time frame analysis brings it back to delta neutral before its earnings announcement today. Here's an AAPL 3x split frame 1 week, 1 day(16hr ext.) and half day(195 minutes) charts. As you can see, AAPL 3 year trajectory trend channel neutral price is 177. AAPL VWMA50 on the 1 day chart is 177. AAPL Half day chart mid price is 173.
Q4 Sep 2023 Consensus:
EPS = 1.39
Revenue: 84.69 B
Recent earnings HL range:
8/3/23 = 196 - 185
5/4/23 = 171 - 164
2/2/23 = 152 - 142
3x avg. = 9
3 year trajectory trend channel:
resistance = 191
pivot = 177
support = 164
1 day chart:
1 year AWVWAP = 169
VWMA50 = 177
Half day chart:
1/3 L - 10/26 L support line = 166
7/19 H - 10/12 H resistance line = 179
Options data:
11/3 expiry
Put Volume Total 135,347
Call Volume Total 137,025
Put/Call Volume Ratio 0.99
Put Open Interest Total 199,920
Call Open Interest Total 246,788
Put/Call Open Interest Ratio 0.81
11/10 expiry
Put Volume Total 31,673
Call Volume Total 31,098
Put/Call Volume Ratio 1.02
Put Open Interest Total 65,429
Call Open Interest Total 77,442
Put/Call Open Interest Ratio 0.84
11/17 expiry
Put Volume Total 42,853
Call Volume Total 27,751
Put/Call Volume Ratio 1.54
Put Open Interest Total 426,354
Call Open Interest Total 426,197
Put/Call Open Interest Ratio 1.00
1/19/2024 LEAPS
Put Volume Total 22,185
Call Volume Total 23,892
Put/Call Volume Ratio 0.93
Put Open Interest Total 774,670
Call Open Interest Total 984,277
Put/Call Open Interest Ratio 0.79

AAPL Shares Fall after Strong ReportAAPL shares rose approximately 1.2% during the session yesterday in anticipation of a strong Q3 report. It actually turned out better than predicted:
→ earnings per share: actual = USD 1.46; forecast = USD 1.39;
→ gross income: actual = USD 89.49 billion; forecast = USD 89.34 billion.
However, as a result, the price of AAPL shares decreased; in the pre-market on Friday, the share price was about USD 171.50, although yesterday it closed at USD 177.78 according to the NASDAQ exchange (minus 3.50%).
The reason is the company's disappointing plans for the future.
Tim Cook refused to answer a question about Apple's investments in AI. And Apple Chief Financial Officer Luca Maestri failed to reassure investors that there would be a surge in sales over the holiday period, saying gross revenue would be similar to what it was a year ago. So analysts can expect the company to continue to show a decline in sales, which already looks like a trend for 2023.
AAPL stock price performance shows that the stock market is largely a reflection of hopes, emotions and belief in rumors. In fact:
→ the price continues to move in a downward trend (shown by the blue channel);
→ growth to its upper limit in the hope of a positive report turned into a collapse;
→ the opening of trading today may take place at the bottom of the channel;
→ bears may attack the psychological level of USD 170 per share today. This level is also important because it is approximately 50% of the price increase from the March lows to the highs of the year.
If the USD 170 level is broken by the bears with the extension of the candle body and increased volumes, it could become an important resistance further down the line. So close to losing the status of the most valuable company.
This article represents the opinion of the Companies operating under the FXOpen brand only. It is not to be construed as an offer, solicitation, or recommendation with respect to products and services provided by the Companies operating under the FXOpen brand, nor is it to be considered financial advice.

20% upside in APPLEThe stock set into an impulse in Jan 2023 and completed the first wave up by Feb 2023 and corrected thereafter till the first week of march.
The wave 3 in the stock began in march 2023 and went on all the way till July and there after the stock was in complex wave 4 correction until last week.
The stock is now coming out of the 4th wave correction and could give a great "Santa Rally" beginning in November and extending till Christmas Day(or beyond).
The target for the 5th wave is projected around 205-210 zone.

Apple 50% retrace after hours earningsUsing Fibs I show that Apple retraced right to the .5 fib on earning's afterhours. I believe it will now continue up eventually breaking the down trendline and head up to one of the targets after EOY.

AAPL: Buy ideaBuy idea on AAPL as you see on the chart because we have the breakout with force the resistance line by a big green candle with a large green volume.Thanks!

APPL - Another pattern associated with 69I have many ideas where I talk about 69\96 indicating local and global price reversals. Here we were additionally shown 99, which means strong growth. I'm going to fixate on the imbalance overlap. See attached ideas

#AAPL Targeting Monthly Projected Range ResitanceIn this update we review the recent price action in Apple and identify the nexxt high probability trading opportunities and price objectives to target
PAST PERFORMANCE NOT INDICATIVE OF FUTURE RESULTS

$AAPL Implied Move for Earnings tomorrowNASDAQ:AAPL Implied Move for Earnings tomorrow
This is NOT an analysis of any kind… literally just the implied move for tomorrow’s earnings ….
Let’s see if she holds the 200DMA

AAPL still bullish ?#aapl earning coming up after market
#aapl closed above 173$ today.
if #aapl hold above 173$, next resistance : 175.5$/176.5$/179$
if #aapl below 173$, next support : 172$/170$

$AAPL Analysis, Key Levels & TargetsNASDAQ:AAPL Analysis, Key Levels & Targets
Oh yeah… I’m going there… AAPL to 159, easy
See you there

Apple Inc. (NASDAQ: AAPL) Stock Assessment Over the last 30 days, there has been a downward revision of 1.7% in the consensus EPS estimate for the quarter, leading to its current level. This signifies the covering analysts' collective reconsideration of their initial forecasts over the course of this timeframe.
Prior to a company's earnings release, it is of utmost importance to factor in any revisions made to the earnings projections. These revisions serve as a critical gauge for predicting potential investor behaviors with respect to the stock. Empirical studies consistently reveal a strong link between trends in earnings estimate revisions and the short-term price performance of a stock.
While it's common for investors to rely on consensus earnings and revenue estimates for assessing how the business may have performed during the quarter, exploring analysts' forecasts for key metrics can yield valuable insights.
Given this perspective, it's time to examine the average forecasts of specific Apple metrics that are routinely monitored and predicted by Wall Street analysts.
The average prediction of analysts places 'Revenue- Wearables, Home and Accessories' at $9.33 billion. The estimate suggests a change of -3.3% year over year.
The consensus among analysts is that 'Revenue- iPhone' will reach $44.17 billion. The estimate points to a change of +3.6% from the year-ago quarter.
Analysts expect 'Net Sales- Services' to come in at $21.35 billion. The estimate indicates a change of +11.3% from the prior-year quarter.
Based on the collective assessment of analysts, 'Revenue- Mac' should arrive at $8.29 billion. The estimate indicates a year-over-year change of -28%.
The consensus estimate for 'Net Sales- Products' stands at $67.64 billion. The estimate points to a change of -4.7% from the year-ago quarter.
Analysts predict that the 'Revenue- iPad' will reach $5.86 billion. The estimate indicates a year-over-year change of -18.4%.
According to the collective judgment of analysts, 'Geographic Revenue- Greater China' should come in at $17.34 billion. The estimate indicates a change of +12.1% from the prior-year quarter.
The collective assessment of analysts points to an estimated 'Geographic Revenue- Europe' of $22.22 billion. The estimate points to a change of -2.5% from the year-ago quarter.
It is projected by analysts that the 'Geographic Revenue- Rest of Asia Pacific' will reach $6.04 billion. The estimate suggests a change of -5.2% year over year.
Analysts forecast 'Geographic Revenue- Japan' to reach $5.52 billion. The estimate points to a change of -3.1% from the year-ago quarter.
Analysts' assessment points toward 'Geographic Revenue- Americas' reaching $38.04 billion. The estimate suggests a change of -4.4% year over year.

Is Apple ready for a new uptrend? 01/11/2023Apple Inc. plans to boost its revenue by expanding its market share in the computer industry through the introduction of new Mac models and other devices. According to the company's management, the computer market is projected to grow in 2024, even if it does not reach pre-pandemic levels. Bloomberg is forecasting a 5% increase in Mac sales, potentially leading to a 5.5% growth in Apple's revenue.
Therefore, today, we are focusing on Apple Inc (NASDAQ: AAPL) stock.
On the D1 timeframe, support has formed at 165.67, with resistance at 173.63. Quotes have consolidated above the significant historical level of 169.92. Additionally, a "descending wedge" pattern has formed, suggesting a possible reversal of the downward trend.
On the H1 timeframe, if there is a rebound from the 173.63 level, there is a chance that a new upward movement could start, with a short-term target set at 182.40. In the medium term, the target for a price increase could hover around 190.20.
—
Ideas and other content presented on this page should not be considered as guidance for trading or an investment advice. RoboMarkets bears no responsibility for trading results based on trading opinions described in these analytical reviews.
The material presented and the information contained herein is for information purposes only and in no way should be considered as the provision of investment advice for the purposes of Investment Firms Law L. 87(I)/2017 of the Republic of Cyprus or any other form of personal advice or recommendation, which relates to certain types of transactions with certain types of financial instruments.
Risk Warning: CFDs are complex instruments and come with a high risk of losing money rapidly due to leverage. 67.85% of retail investor accounts lose money when trading CFDs with this provider. You should consider whether you understand how CFDs work and whether you can afford to take the high risk of losing your money.

APPLE (NASDAQ) ANALYSISApple is leading the Nasdaq blue chip stocks in the US. Last week Apple stocks were trading at all time highs. The market is now at a previous resistance where it has reversed before. If the DXY starts to rise, the stocks will fall. The chances that the market will reverse at a point where it has reversed before are very high.
Apple share analysis Apple share elliot wave analysis
wave first complete upside second wave retracment wave one 38% and again wave third move upside or wave 4 retracment wave 3 62% in triangle correction

AAPL: AnalysisOn AAPL as you see on the chart we have two situations. We will have an uptrend if we have the breakout with force the resistance line by a big green candle with a large green volume. In other hand, we will have a downtrend if we have the breakout with force the vwap indicator and the support line by a big red candle with a large red volume. Thanks.!

AAPL long term Damage two GAPS DOWN The chart posted is APPLE the drop down had fib relationships back up but each failed to FILL the GAP see arrows I do not see very good things going forward . it is a net gain less that TBILLs for the last 24 months if is traded down to 152 I would look at it but not till then

time to touch 160$ fo Appl after 3 times try to brake 156 , now is time to brake easily and today after news {Fed} can be we have my target.

you will own apple and be happyEnd of apple around 2030!!! So for now just wait for the test on the trendline and go long.

Good time to sell Apple? When to Sell it?APPL: Good Time To Sell Apple?
After the price respected our previous analysis we can see that it was followed by a strong bullish wave.
Considering that APPLE is in a strong bullish trend the bullish correction was normal.
So far the price faced a strong resistance near 189.50 which is the same zone when it began the bearish wave.
The price looks like can move down again.
You may find more details in the video analysis!
Thank you and Good Luck!

AAPL Weekly Harmonic Elliott Wave and Hurst's Cyclic AnalysisOverview:
Let's review the key points of the previous update (October 14th):
Started wave y of 2 this week.
We are in wave II of (a) of y of 2.
The 80D cycle trough on 25th October to November 7th (I prefer November 6th or 7th).
Update:
Just hit the "Load new bars" button on the previous update to see the accuracy.
Analysis of the Structure:
I see that we are in wave IV of (a) of y of 2 at the moment, developing as a double zigzag. The peak is expected on Monday morning, then we start a week of bearishness as wave V of (a).
My potential target for wave IV peak is 169.48 and my target for wave y bottom is around 160.96 (since wave IV is not finished yet, I have calculated 160.96 based on my wave IV target of 169.48).
Analysis of the Cycles:
On Thursday (October 26th) we got the first 10D cycle trough of the second 20D cycle of the second 40D cycle of the first 80D cycle of the current 20W cycle.
I am expecting the 80D cycle on November 2nd. This means I expect a bullish bounce caused by the earnings report.
So, this week is going to be aggressively bearish until we get the 80D cycle trough, also the bullish bounce out of it is going to be considerable (4-5 weeks of bullishness).

Trendlines on AAPL.
I drew these trendlines on the hourly time-frame. I would watch on the 15-minute candles for a bounce off of one of these lines. I would NOT swing trade this since we have earnings coming up this week. As always, thank you for reading and watching my analysis. Have a blessed week ahead!

APPLE Will rise APPLE
on a steady rise, price descended till 166.72, According to my prediction from there again will starts to rise till 181.37 and above it.
if the price fell and was not able rise should stable under 166.72, to be more bearish
