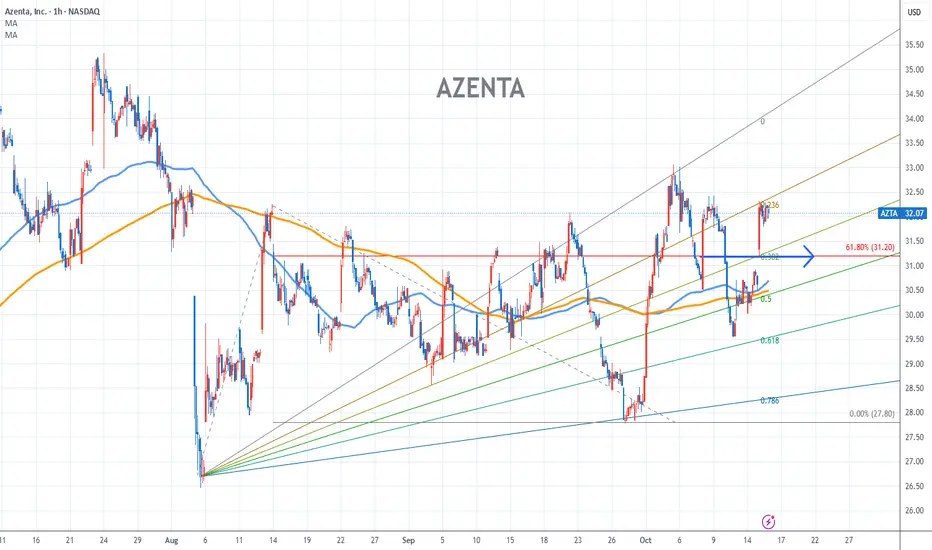
AZENTA Chart Fibonacci Analysis 101525Trading Idea
1) Find a FIBO slingshot
2) Check FIBO 61.80% level
3) Entry Point > 31.2/61.80%
Chart time frame:B
A) 15 min(1W-3M)
B) 1 hr(3M-6M)
C) 4 hr(6M-1year)
D) 1 day(1-3years)
Stock progress:A
A) Keep rising over 61.80% resistance
B) 61.80% resistance
C) 61.80% support
D) Hit the bottom
E
Next report date
—
Report period
—
EPS estimate
—
Revenue estimate
—
−2.065 EUR
−147.45 M EUR
589.47 M EUR
44.90 M
About Azenta, Inc.
Sector
Industry
CEO
John P. Marotta
Website
Headquarters
Burlington
Founded
1978
ISIN
US1143401024
FIGI
BBG000KRXSN4
Azenta, Inc. is a provider of life sciences sample exploration and management solutions for the life sciences market. It operates through the Life Sciences Products and Life Sciences Services segments. The Life Sciences Products segment is involved in automated cold storage solutions for biological and chemical compound samples. The Life Sciences Services segment focuses on the solutions addressing the many needs of customers in the area of genomic analysis and the management and care of biological samples used in pharmaceutical, biotech, healthcare, clinical, and academic research, and development markets. The company was founded in 1978 and is headquartered in Burlington, MA.
Related stocks
AZENTA Stock Chart Fibonacci Analysis 071023 Trading Idea
1) Find a FIBO slingshot
2) Check FIBO 61.80% level
3) Entry Point > 47/61.80%
Chart time frame : B
A) 15 min(1W-3M)
B) 1 hr(3M-6M)
C) 4 hr(6M-1year)
D) 1 day(1-3years)
Stock progress : A
A) Keep rising over 61.80% resistance
B) 61.80% resistance
C) Hit the bottom
D) Hit the top

AZENTA Stock Chart Fibonacci Analysis 042223Trading Idea
1) Find a FIBO slingshot
2) Check FIBO 61.80% level
3) Entry Point > 43/61.80%

Azetra Life Science USASun Storm Investment Trading Desk & NexGen Wealth Management Service Present's: SSITD & NexGen Portfolio of the Week Series
Focus: Worldwide
By Sun Storm Investment Research & NexGen Wealth Management Service
A Profit & Solutions Strategy & Research
Trading | Investment | Stocks | ETF | Mutua

See all ideas
An aggregate view of professional's ratings.
Neutral
SellBuy
Strong sellStrong buy
Strong sellSellNeutralBuyStrong buy
Neutral
SellBuy
Strong sellStrong buy
Strong sellSellNeutralBuyStrong buy
Neutral
SellBuy
Strong sellStrong buy
Strong sellSellNeutralBuyStrong buy
Displays a symbol's price movements over previous years to identify recurring trends.
Frequently Asked Questions
Depending on the exchange, the stock ticker may vary. For instance, on SWB exchange Azenta, Inc. stocks are traded under the ticker BA3.
We've gathered analysts' opinions on Azenta, Inc. future price: according to them, BA3 price has a max estimate of 34.33 EUR and a min estimate of 18.88 EUR. Watch BA3 chart and read a more detailed Azenta, Inc. stock forecast: see what analysts think of Azenta, Inc. and suggest that you do with its stocks.
Yes, you can track Azenta, Inc. financials in yearly and quarterly reports right on TradingView.
Azenta, Inc. is going to release the next earnings report on Nov 18, 2025. Keep track of upcoming events with our Earnings Calendar.
BA3 earnings for the last quarter are 0.16 EUR per share, whereas the estimation was 0.12 EUR resulting in a 39.45% surprise. The estimated earnings for the next quarter are 0.16 EUR per share. See more details about Azenta, Inc. earnings.
Azenta, Inc. revenue for the last quarter amounts to 122.19 M EUR, despite the estimated figure of 126.81 M EUR. In the next quarter, revenue is expected to reach 133.31 M EUR.
BA3 net income for the last quarter is −44.83 M EUR, while the quarter before that showed −37.40 M EUR of net income which accounts for −19.87% change. Track more Azenta, Inc. financial stats to get the full picture.
As of Oct 21, 2025, the company has 3.3 K employees. See our rating of the largest employees — is Azenta, Inc. on this list?
EBITDA measures a company's operating performance, its growth signifies an improvement in the efficiency of a company. Azenta, Inc. EBITDA is 35.72 M EUR, and current EBITDA margin is 2.72%. See more stats in Azenta, Inc. financial statements.
Like other stocks, BA3 shares are traded on stock exchanges, e.g. Nasdaq, Nyse, Euronext, and the easiest way to buy them is through an online stock broker. To do this, you need to open an account and follow a broker's procedures, then start trading. You can trade Azenta, Inc. stock right from TradingView charts — choose your broker and connect to your account.