ENB - tsxTSX:ENB on the tsx
I like it a lot.
I am posting this to set a reminder for myself.
No direction picked. just me drawing stuff.
I have ENB indirectly in one of my ETFs
so essentially I'm long it.
Enbridge Inc.
No trades
Next report date
—
Report period
—
EPS estimate
—
Revenue estimate
—
2.010 EUR
4.64 B EUR
40.38 B EUR
About Enbridge Inc.
Sector
Industry
CEO
Gregory Lorne Ebel
Website
Headquarters
Calgary
Founded
1949
IPO date
Oct 30, 2001
Identifiers
3
ISIN CA29250N1050
Enbridge, Inc. engages in the provision of gas and oil. It operates through the following segments: Liquid Pipelines, Gas Distribution and Storage, Gas Transmission and Midstream, Renewable Power Generation, and Energy Services. The Liquids Pipelines segment consists of common carrier and contract crude oil, natural gas liquids and refined products pipelines and terminals in Canada and the U.S., including Canadian Mainline, Regional Oil Sands System, Southern Lights Pipeline, Spearhead Pipeline, Seaway Crude Pipeline interest, and other feeder pipelines. The Gas Distribution & Storage segment consists of natural gas utility operations, the core of which is Enbridge gas, which serves residential, commercial and industrial customers. It also includes natural gas distribution activities in Quebec and an investment in Noverco, which holds a majority interest in a subsidiary entity engaged in distribution and energy transportation primarily in Quebec. The Gas Transmission & Midstream segment consists of investments in natural gas pipelines, processing and green energy projects, the company's commodity marketing businesses, and international activities. The Renewable Power Generation segment consists primarily of investments in wind and solar power generating assets, as well as geothermal, waste heat recovery, and transmission assets. The Energy Services segment consists of businesses in Canada and the United States including logistical services, refinery supply services and the firm's volume commitments on various pipeline systems. The company was founded on April 30, 1949 and is headquartered in Calgary, Canada.
Related stocks

ENB | Natural Gas Producer on the Rise | LONGEnbridge, Inc. engages in the provision of gas and oil. It operates through the following segments: Liquid Pipelines, Gas Distribution and Storage, Gas Transmission and Midstream, Renewable Power Generation, and Energy Services. The Liquids Pipelines segment consists of common carrier and contract c
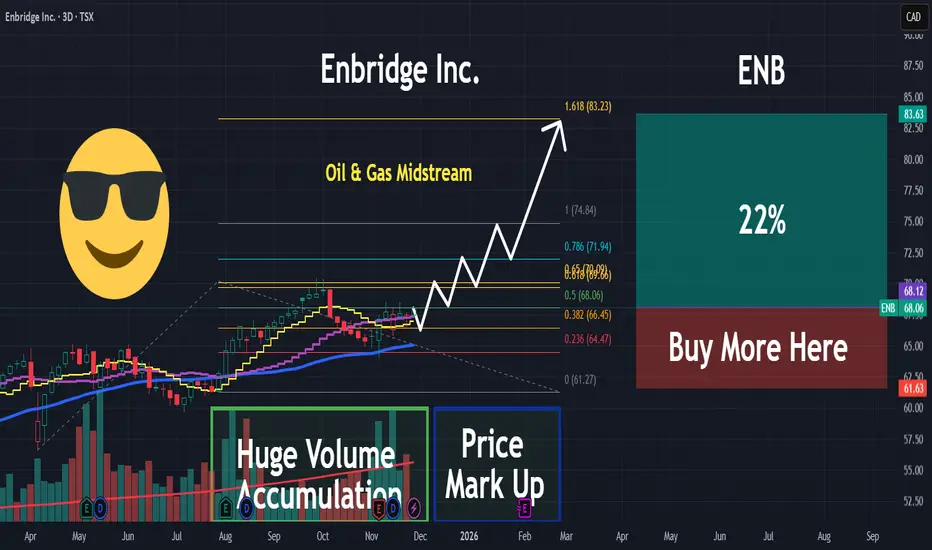
ENB TSX start the sale price. After last news ( Alberta and Canada are 80% aligned on potential pipeline proposal, Premier says ) i think this is a good opportunity to start loading the bag at a good price.
PS: this is a long term vision also this stock pays 5.61% year in dividends.
Make your own decisions and be responsibl

Bullish ENB, Pump Baby Pump, Tarif free ENB has vertical integration into the USA. Worth looking in the MAGA/Trump economic outlook plan, the "drill baby drill" is in fact what is supporting the ENB price and the expansion in more states. ENB also makes most of there revenue not actually from the sale of Canadian oil/LPG to USA, but from

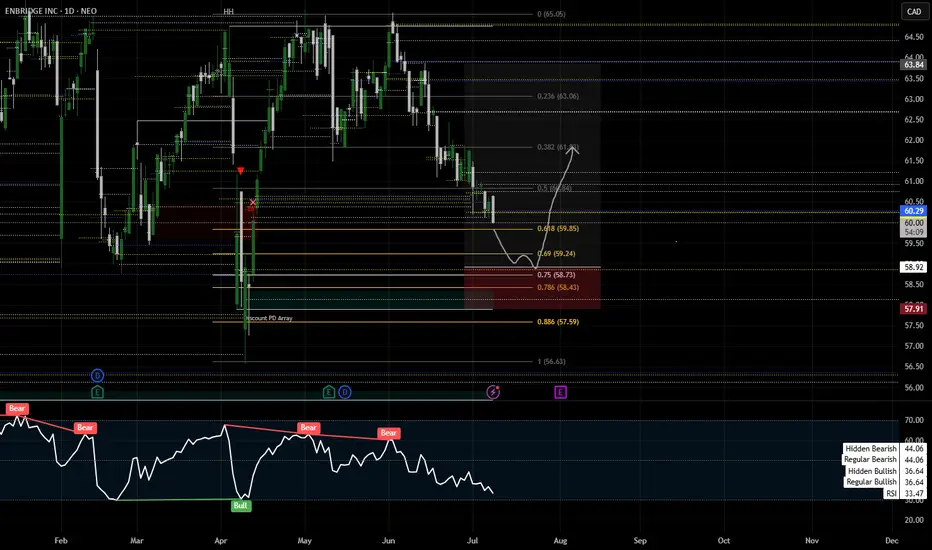
Enbridge long idea , with volume profilefib retracement
confluence with .75 rule and have daily order block
Enbridge is overpricedThis is a bull trap at this point, coupled with Trump’s tariff and Enbridge makes money by transporting oil and gas from Canada to the USA, many people have the opinion now that Enbridge will start to lose money. Be warned! Time to leave before the big drop.

Enbridge Inc (ENB) SL-$44,24 TP-$45,39Technical Analysis:
False bottom on the weekly chart
Continuation gap on the daily chart
Momentum

Enbridge Setting Up For An Inside Bar Entry On A PullbackWe are going back to well after previously recommending TSX:ENB in one of my other one good trade videos. In this video, I cover the concept of swing trading pullbacks. I got into depth of the price action on the pullback and I explain where I would put my stop and take profit.

One Good Trade: ENB Trapping Bears On Solid Price ActionThis one is simple, I covered it more in-depth on my Market Overview (shorter version on YouTube). This trade is setting up nicely with a touch of the keltner channel and a pullback that essentially trapped bears with a really nice setup bar.

Bullish TrendRising lows and rising highs for TSX:ENB with bullish crossover on fast EMAs after a great rejection on the weekly support

See all ideas
Summarizing what the indicators are suggesting.
Neutral
SellBuy
Strong sellStrong buy
Strong sellSellNeutralBuyStrong buy
Neutral
SellBuy
Strong sellStrong buy
Strong sellSellNeutralBuyStrong buy
Neutral
SellBuy
Strong sellStrong buy
Strong sellSellNeutralBuyStrong buy
An aggregate view of professional's ratings.
Neutral
SellBuy
Strong sellStrong buy
Strong sellSellNeutralBuyStrong buy
Neutral
SellBuy
Strong sellStrong buy
Strong sellSellNeutralBuyStrong buy
Neutral
SellBuy
Strong sellStrong buy
Strong sellSellNeutralBuyStrong buy
Displays a symbol's price movements over previous years to identify recurring trends.
S
ENB3674196
Spectra Energy Capital LLC 7.5% 15-SEP-2038Yield to maturity
5.90%
Maturity date
Sep 15, 2038
E
ENB4296383
Enbridge Energy Partners, L.P. 7.375% 15-OCT-2045Yield to maturity
5.81%
Maturity date
Oct 15, 2045
S
ENB4051634
Spectra Energy Partners, LP 5.95% 25-SEP-2043Yield to maturity
5.68%
Maturity date
Sep 25, 2043
See all EN3 bonds
Frequently Asked Questions
The current price of EN3 is 45.295 EUR — it has increased by 3.85% in the past 24 hours. Watch Enbridge Inc. stock price performance more closely on the chart.
Depending on the exchange, the stock ticker may vary. For instance, on SWB exchange Enbridge Inc. stocks are traded under the ticker EN3.
EN3 stock has risen by 5.60% compared to the previous week, the month change is a 14.34% rise, over the last year Enbridge Inc. has showed a 5.35% increase.
We've gathered analysts' opinions on Enbridge Inc. future price: according to them, EN3 price has a max estimate of 49.50 EUR and a min estimate of 38.36 EUR. Watch EN3 chart and read a more detailed Enbridge Inc. stock forecast: see what analysts think of Enbridge Inc. and suggest that you do with its stocks.
EN3 stock is 4.80% volatile and has beta coefficient of 0.38. Track Enbridge Inc. stock price on the chart and check out the list of the most volatile stocks — is Enbridge Inc. there?
Today Enbridge Inc. has the market capitalization of 98.92 B, it has increased by 1.82% over the last week.
Yes, you can track Enbridge Inc. financials in yearly and quarterly reports right on TradingView.
Enbridge Inc. is going to release the next earnings report on May 8, 2026. Keep track of upcoming events with our Earnings Calendar.
EN3 earnings for the last quarter are 0.55 EUR per share, whereas the estimation was 0.48 EUR resulting in a 12.73% surprise. The estimated earnings for the next quarter are 0.62 EUR per share. See more details about Enbridge Inc. earnings.
Enbridge Inc. revenue for the last quarter amounts to 10.65 B EUR, despite the estimated figure of 5.25 B EUR. In the next quarter, revenue is expected to reach 5.62 B EUR.
EN3 net income for the last quarter is 1.28 B EUR, while the quarter before that showed 482.16 M EUR of net income which accounts for 164.89% change. Track more Enbridge Inc. financial stats to get the full picture.
Yes, EN3 dividends are paid quarterly. The last dividend per share was 0.58 EUR. As of today, Dividend Yield (TTM)% is 5.14%. Tracking Enbridge Inc. dividends might help you take more informed decisions.
Enbridge Inc. dividend yield was 5.74% in 2025, and payout ratio reached 116.53%. The year before the numbers were 6.00% and 156.31% correspondingly. See high-dividend stocks and find more opportunities for your portfolio.
EBITDA measures a company's operating performance, its growth signifies an improvement in the efficiency of a company. Enbridge Inc. EBITDA is 10.56 B EUR, and current EBITDA margin is 25.97%. See more stats in Enbridge Inc. financial statements.
Like other stocks, EN3 shares are traded on stock exchanges, e.g. Nasdaq, Nyse, Euronext, and the easiest way to buy them is through an online stock broker. To do this, you need to open an account and follow a broker's procedures, then start trading. You can trade Enbridge Inc. stock right from TradingView charts — choose your broker and connect to your account.
Investing in stocks requires a comprehensive research: you should carefully study all the available data, e.g. company's financials, related news, and its technical analysis. So Enbridge Inc. technincal analysis shows the strong buy rating today, and its 1 week rating is strong buy. Since market conditions are prone to changes, it's worth looking a bit further into the future — according to the 1 month rating Enbridge Inc. stock shows the strong buy signal. See more of Enbridge Inc. technicals for a more comprehensive analysis.
If you're still not sure, try looking for inspiration in our curated watchlists.
If you're still not sure, try looking for inspiration in our curated watchlists.