3 White Soldiers Advance3 white soldiers is one of the most textbook bullish patterns in Japanese Candlestick Charting Techniques (Nison, S., 1991)
We see 3 consecutive bullish candles with small or no wicks on the daily timeframe, accompanied by growing volume each day.
Ford has just begun shipping their electric F150. The Ford 150 is America's best selling vehicle for 40 years running (as of 2021).
While we may see some pullback to the $12-13 level, I expect this is the start of a significant bullish trend for Ford Motor Company.
Trade ideas

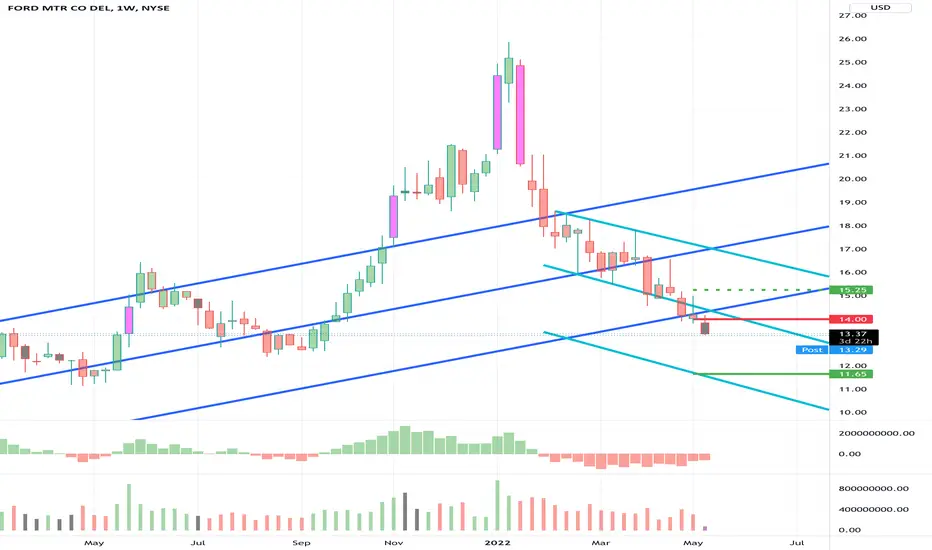
Ford - A good spot for a swing trade Long?Looking at the Ford weekly chart, share price has fallen hard since Jan. of this year with no relief pull-back. Well over 50% from the low in March 2020. Is it at a good level now for that pull-back to happen?
Notice a possible head and shoulder formation brewing in the works. Price is at the 200ema on the weekly and at the .618 fib level. The .618 fib level is at a point of support also. Stoch RSI has been under 20 since early Feb. Maybe a good time to pick up a few shares for the longer term investor. Or possibly a nice swing trade long.
It'll be interesting if price just destroys this zone or reacts to it.

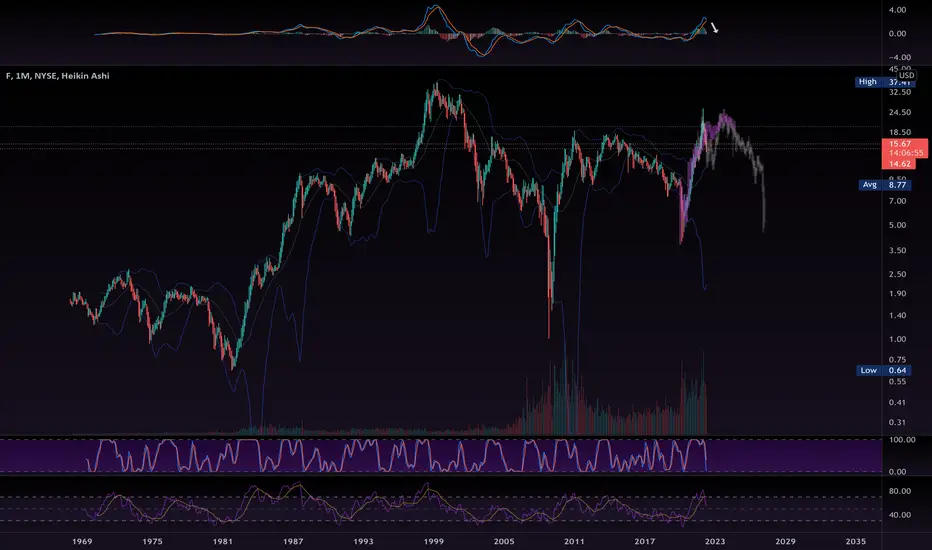
Ford - Similar Indicator Situations Similar scenario right now to the area first in yellow
Price has dipped similarly to the 100MA
This touch on the 100MA on this Weekly timeframe will be bullish and lead to continuation above the major trend line
Major point is the initial and latter scenario are very similar
Bullish

FORDseeing a bottom during the day would be, a spker towards $12.86 as my green line shows. watch it life and make your thoughts.
Good day...!!

Analysis-downtrendAs you see on the chart, we will have a big probability of a downtrend, because we have a breakout with force the support line and the vwap indicator by a big candle with a large volume. thanks.


$F - Breaking down from multi-year trendlineFord broke below the multi-year trendline that started from March of 2020.
The price could further breakdown to $11.30 area before finding a support. However, if $11.30 breaks the next support area is $9.60 area which would be an attractive entry point.
I'd be interested to start a small position around 11.30 and load more at $9.60.
Not an investment advice.


Possible Head and Shoulders formingLots to look at these days. Be careful with your funds. Im no pro, do you research, make good decisions.

2nd Overbought attemp on Monthly TF2nd Overbought attemp on Monthly TF . The higher the timeframe of overbought/sold the bigger the moves it will make and wait.

Ford (F) Setup for a ShortFord (F) has confirmed a short. This trade has started to move already. But I've indicated an ideal entry area, a stop loss and a target all on the chart for your reference.
Possible long entryFalling to a few support levels as well as a closing wedge. This could be a good long with much to gain. The new Ford Lightning should start shipping soon. I am no expert, do you research, make safe and smart decisions with your money.

New high price Target The new high could be at 40 nobody knows but this would be a 10 year hold minimum on this stock.

FORD - Weekly IdeaA nice Fibonacci Circle can be drawn with the bearish but very little volatility price
This shows price hit a bottom at 2.618
Price increase based n assumption that 1.618 acts as support for price

Short scalp $FBased on its downtrend, regress off resistance and a familiar chart pattern confirmed by my technical indicators, I expect at least half a percent in profits IF $F breaches yesterday's low of $14.34 during today's session.


Ford is going to do something CrazyThere are four instances of Hidden Bullish divergence and tail end MACD selling momentum that is waning. It is a long-term trade position with a clear invalidation below the last higher low.

$F with a Bullish outlook following its earnings #Stocks The PEAD projected a Bullish outlook for $F after a Positive over reaction following its earnings release placing the stock in drift B with an expected accuracy of 75%.

Ford - peaking below the peak?Well, here is ford, making a big dojo on a candle a bit bigger than the 1 month… as the momentum indicator up top is way up and just turned hard… harder than it did in either of these traces that i have laid over the current situation to illustrate what previous bearish moves in this spacial orientation of the levels would look like between these current levels.
Follow along for more!
Good Luck, God Speed, love & Light to all!
Dark Pool Buy Zones™Some traders try to watch Level 2 data to discern when the large-lot orders come through to get an idea of when the big institutions are accumulating in the Dark Pools, but you really don’t need that. Plus, whether that’s accurate is questionable since Dark Pool transactions are reported way after they were transacted.
“Dark Pool buy zones” is a term I coined because Dark Pools use precise controlled orders that trigger automatically over extended periods of time. Since the Buy Side Institutions using the Dark Pools are primarily buying for the long term, price can sometimes drop down before moving up, creating a range in the price action, what I call “the buy zone.”
When you learn to recognize the Dark Pool Candlestick and Indicator Patterns, you can be ready for the bottom to develop and look for Dark Pool accumulation patterns to plan your trading.
Below is an example. Ford is still falling, but the Dark Pool buy zone support is close. I’ll be waiting to see how the bottom develops around that level before making my decision to trade.
Happy TechniTrading!
Please like and follow if you found this interesting.

Ford into earnings will it go higher or follow inverted pennateSee that chart. it seems self explanatory though this app wants me add more words.
So inverted pennate coming to a close as ford gets ready to announce earnings.
I feel the trend will continue down overall, though we could see and pump if they meet or beat earnings.
what say you?
Thank you

