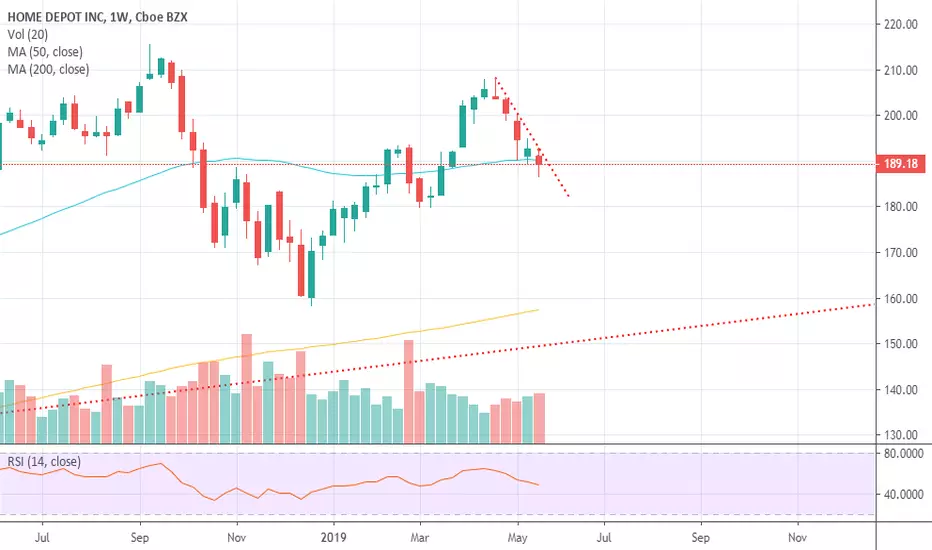
$HD SHORT Even after earning bounce targeting below 190 bearishLong weakness for most indicators reflect weakness of shares even after make new annual high stlll RSI showing weakness , volume during recent drop increased prior to earning reports which should be a bad sign . now stopped at the edge of up trend for this year if close below it again this will be confirmation for long bearish trend ..
Home Depot, Inc.
No trades
Trade ideas

HOME DEPOT INC EARNINGS Earnings are coming up ( be careful not to get caught gessuing).
IF EARNIGS DO NOT EFFECT THE MARKETS.
I see a potential short into a bigger cluster of buyers and sellers @195 and ultamately bouncing and following the trend upwards. I would keep this on the watch list.
IF EARNINGS ARE GOOD ***
I would buy calls and stock for long term investments as fas as possible using my options as leveradge to gain income.
IF EARNINGS ARE BAD
I would wait for a bottom. Home depot is a staple in america. Not much competition. I would hold it long term once I fundamentaly and analyticaly picked a bottom.
Use my site for my personal picks @
SuperiorCapitalMembers.com
& Please don't forget to follow my Tradingview account.

Long HOME DEPOT Into EarningsHOME DEPOT HAS FOLLOWED A VERY DISCIPLINED CHANNEL, IT IS OUR OPINION THAT THAT IS SET TO CONTINUE AND THE NEXT MOVE WILL BE BULLISH TOWARDS THE $220 RANGE BEFORE CONTINUING TO HIT TOP CHANNEL RESISTANCE AT APPROX $230
TRADE SET UP PRICE TARGET $220

Getting simple with spike tradingCoded up a highlight for a simple plan to look for price spikes where the candle closes to hold the median line. Stop loss above the spike; targeting a 2 to 1 or 3 to 1.

HD - Home depot swing long HD stock make a pullback on an uptrend toward 20 MA
- Price respect 20 MA and bounce
- A bullish candle confirmation
- Price also retest last resistance that became support at $211
-TP $220
-SL $209.5
(This price target are used for HD option swing trade )

HD(Home Depot): All parabolic movements must come to an end What goes up, must come down. While this is not always true in this world, it's much more likely than not that a parabolic movement will eventually see a sharp, then lengthy, dwindling correction before it continues upward. This may seem like a crazy chart, but there are some unavoidable signs that the housing market is slowing down. Some experts are now predicting we may see some recession in 2020. Home Depot is a leading indicator of the hosuing market dropping off. Looking at the facts, Home Depot has increased its value 1186% since the market crash in 2009. To assume there will be no correction for this parabolic move will be foolish. The question is, when, and at what price? I think we may be reaching a top, if we have not already around $219. RSI has been moving bearishly against the price action on the monthly chart and is now in a nuetral/bearish range for the first time in nearly a decade. As of now we are still producing higher highs, but we did show one lower low. I believe if the next upward movement doesn't show a higher high (above $219.30) we might be at the peak and ready for some correction. This could easily bring price all the way down to the .5 FIB of its parabolic movement, or around $118.
Am I suggesting you short Home Depot? Only if you're crazy. I like doing something out of the box once in a while though, so I'm going to play a small bag just for the sake of technical analysis.


HD Near All-Time High ResistanceHD recently ran up on Buyback action, and it has stalled below the previous All-Time High. There is Dark Pool Quiet Rotation™ in the price action at this level.


Daily HD forecast timing analysis by Supply-Demand strength21-Jun
Stock investing strategies
Investing position about Supply-Demand(S&D) strength: In Rising section of high profit & low risk
Supply-Demand(S&D) strength Trend Analysis: In the midst of an adjustment trend of downward direction box pattern price flow marked by limited rises and downward fluctuations.
Today's S&D strength Flow: Supply-Demand strength has changed from a strong buying flow to a suddenly strengthening selling flow.
View a Forecast Candlestick Chart Analysis of 10 days in the future: www.pretiming.com
(You can easily create a trading plan.)
D+1 Candlestick Color forecast: GREEN Candlestick
%D+1 Range forecast: 0.3% (HIGH) ~ -0.5% (LOW), 0.1% (CLOSE)
%AVG in case of rising: 1.3% (HIGH) ~ -0.5% (LOW), 1.0% (CLOSE)
%AVG in case of falling: 0.6% (HIGH) ~ -1.1% (LOW), -0.4% (CLOSE)
Price Forecast Timing Criteria: Price forecast timing is analyzed based on pretiming algorithm of Supply-Demand(S&D) strength.

Up trend to be confirmed.Trend Following tips plot HD as a buy stock. Begin buying calls and if the trend consolidates, in four or five sessions, buy the stock. Calls permit to rescue the gap loss of the waiting for more evidence on trend, with low risk. I suggest 100 20SEP19 190 CALL.


Home De-PutHit the trendline from the ATH today and closed the final gap from the April decline... Now looking at resistance from April top, the median line from the channel and peeking into overbought territory on the daily. Will probably make some kind of double top here so I'd at least wait for some kind of bearish divergence on the hourly chart before entering short.
Bearish bat reversal zone extends from 205.75 to 211-ish.

HD Round upHD is forming a rounding up pattern, this is a strong pattern and is showing alot of symmetry on the chart. Looking for this to run up to $206 for %4 gain. With a stop alert around $194

I don't really see HD going bearish from here2 bullish candles in a row. Not a ton of volume with those candles, but I think it's a pretty strong bullish signal. I'm looking for a small pullback for my entry into this trade.

Let's try this againI tried this bearish a week or two ago. I still think there is a bearish edge here so I'm going to give it another try.


Home Depot: Domestic Consumer Retail EarningsI don't usually play earnings roulette, but I was willing to with HD. They're a US domestic consumer goods retailer, and they're going to be the recipient of goods more favorably prices for domestic consumption than international trade.
The technicals look good, they've been growing earnings consistently, and membership on the DOW30 does favor them for having a solid and reproducible formula for success.
Also, this could go completely the other direction, but they're so large that it's going to drive tomorrow's market direction overall whichever way it goes.

head and shoulders?hd very bearish if can't close above 192.65 on daily on monday, strong short. sets up perfect head and shoulders with april 2019 and jan 2018 shoulders.

Why are we on our way down? #HOME DEPOT#HDAs you can see in the graph above, we have Head And Shoulders Pattern, in one sentence which indication gives us? a head and shoulders pattern describing a specific chart formation that predicts a bullish-to-bearish trend reversal.
For this reason, we recommend a sell signal with a target of 170.
