Home Dept. Natural disasters go-toHurric Arthur towards North Carolina
expected decline
Past: Hurricane Sandy @ east coast
HDI trade ideas

Is HD distribution phase coming to the head?Using Volume Price Analysis, I have established a sell line or 21 days where the insiders have sold heavily. Watch for the negative media to start ragging on home improvement or HD in particular. Symmetrical Triangle forming. Looking for it to break to the downside.


HD 11/4/13Pretty self explanatory this is only a short term move but could very well turn into more than a correction if the DJIA goes sour..
GLHT from Jimmy Gomez


homedepot, lowes, or xhball three have moved this year, just taking a different path to get here, all outperformed spy.

Home DepotHD is trading below the channel established since 2011. Also the trendline is broken. It may be forming head and shoulder top with neckline support at 73. It is a short candidate below 73.


Walking the BandsA historical example of price "walking the bands" in a prominent uptrend. Price breaks through the Upper Band repeatedly.

Home Depot (HD) hasn't rebounded from oversoldHD only bounced briefly to 76 earlier this week and I posted on the previous HD chart that I would sell a gap over 76 or 77-78, HD didn't reach my levels. I am willing to get back in on the short side here with a target of 70-68 as labeled on the chart.
The home building stocks have continued lower and HD failed to rally despite raising guidance and beating their earnings estimate. By the way, they serially raise guidance. The fact of the matter is that HD is a cyclical stock and management really can't forecast accurately so they forecast conservatively. In each of the past two recessions, HD fell to 10 times earnings and earnings are forecasted to go from $3.60 this year to $4.25 next year. When growth gets hot, it can rally to 20 times earnings and you can see it made it pretty close to 20 times the $4.25 estimate (source: Value Line).
Stop loss 79-80. Target 70-68. Last 74.59
Tim 10:36AM EST, August 30, 2013

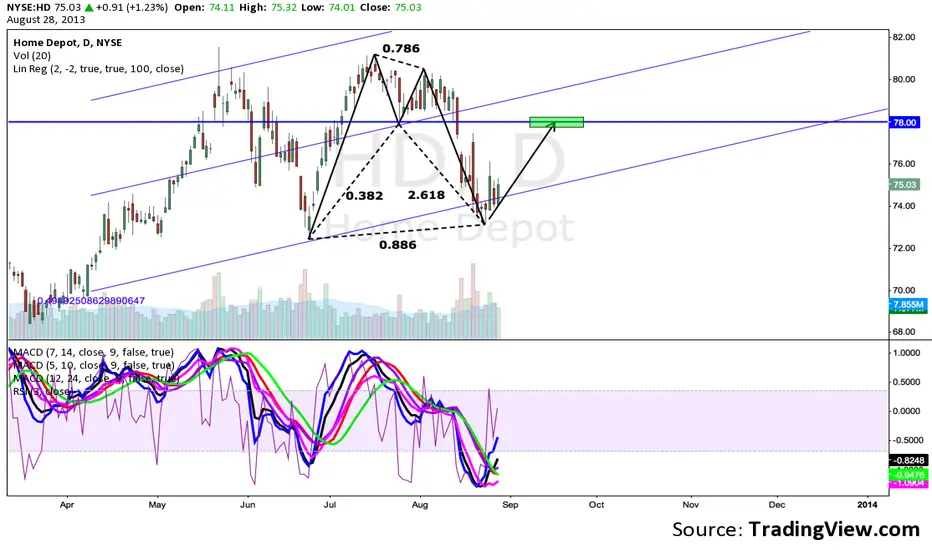
Looking for a short term pop here in HDBullish Bat looking for a retrace up to $78. Potentially setting up a H&S top here by doing so.
HDDaily has much work to do. Many banking on Hammer reversal in oversold condition. Very risky for Bulls here.

Cover Shorts in HDI think this is a good time to take this trade off. VIX has popped up a fair amount. We have had a nice post-options-expiration selloff also. Earnings are also behind us and this is the most oversold the stock has been in over a year (using a 6-month rate of change as the measuring stick). I'll hope I don't miss out on the rest of the decline, but the risk-reward from this level is a bit skewed. There is a lot of risk to the stop loss and just a bit of potential return to the target. Let's step aside and re-visit on a rally. Cheers. Tim 11:58AM EST Aug 21, 2013 74.46 last :-)

HD Home Depot toppy and set up for a declineHome Depot is at nose-bleed levels from my perspective.
The rally is nearly linear for over a year (note the tight regression and the 60% rise in price) and you can clearly see the bulls have had their party for a long time now.
It is astounding how HD has refused to go down along with the other homebuilding stocks and lumber prices and the financial engineering of repurchasing shares to keep investors gobbling up shares seems to have created "disregard" and a situation where there is much more risk to the downside than to the upside for HD.
Note how corrections have occurred once HD has gained 20%in 63-days time (one quarter of a year). The price is action is indicative of shareholder churning, likely from long term holders taking profits.
I view a 10% drop as more than 60% likely from my perspective. I have no position in the shares one way or the other, but will be considering my trade levels and options.
RISK = 3 average daily trading ranges (11 day average). REWARD = 5 average trading ranges or a break of 72 visible and obvious support.
Cheers.
Tim 3:57PM EST Monday, August 5, 2013

HD Bearish BatI first want to say that this pattern could be broken. I would wait for a clear sign that we are reversing. It could break through and go parabolic like COST, MA, V has over the years. SO WAIT FOR THE SIGNAL! It's not a perfect bearish crab, but combined with the indicators and the recent parabolic run up, it is possible.

Bull Put Spread on HD Bet -> Expecting breakout @ 81.16 level. Price should stay above 75 till expiration (Stop loss @ 75.37)

Home Depot gettin ready to sink!!!HD has been trending down for over a month and has been settling in a nice trading range. I would like it to go a little higher to minimize risk but it still may be a good time to start a short position. I could see a move up towards 80 but I think the move down is going to be much more aggressive with a target of near 70. There is a short term support but I think it will blow right by it. Happy trading.

HD Long Term Strength DeterioratingMomentum strength deteriorating in HD on the Weekly chart. Price has been in a parabolic move and is in sore need of resting.
Similar looking upswing to the Nikkei's recent accent.
No short confirmation yet, but certainly on the radar.
