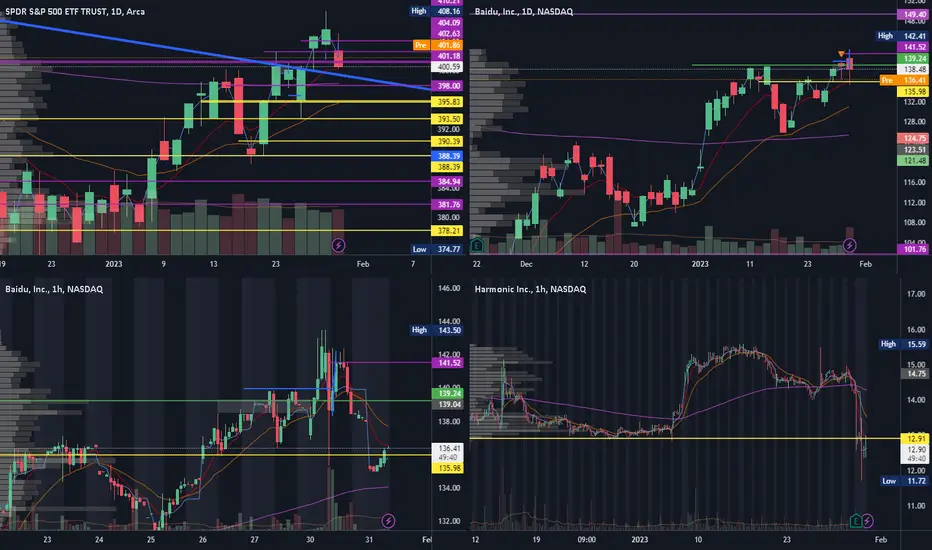
Watchlist 2023-02-01 #AMD #EA #BIDU #HLIT #MTCHSPY had an impressive hold of the 400 level PD, making sure to fake out any early longs in the morning, allowing it to grind higher for the rest of the day. The focus today in FED decision. The fed funds tool is pointing to a 99% chance of a 0.25 point hike coming from the Fed so most attention will
Next report date
—
Report period
—
EPS estimate
—
Revenue estimate
—
0.501 EUR
37.88 M EUR
655.63 M EUR
110.84 M
About Harmonic Inc.
Sector
Industry
CEO
Nimrod Ben-Natan
Website
Headquarters
San Jose
Founded
1988
ISIN
US4131601027
FIGI
BBG000KG2B86
Harmonic, Inc. engages in the development and sale of video delivery software, products, system solutions, and services. It operates through the Video and Broadband segments. The Video segment sells video processing and production and playout services to cable operators, satellite and telecommunications pay-TV service providers, and broadcast and media companies. The Broadband segment offers solutions to cable operators broadband access solutions and related services, including cOS software-based broadband access solution, to broadband operators globally. The company was founded in June 1988 and is headquartered in San Jose, CA.
Related stocks

Watchlist 2023-01-31 #BIDU #HLIT #SOFISPY failed at the 404 level yesterday and continued to grind lower, but without a spike in VIX. Still making higher highs and lows so the overall strength is still present, we are just looking for support on the daily. Next key weekly level is 398, then 395.80 - a weekly support and a high vol node.
Harmonic Holds the 50-dayIt’s often interesting to find stocks making new highs when the market tanks. Today’s chart focuses on such a name: Harmonic.
Notice how the provider of video software advanced in late September and early October as the S&P 500 and Nasdaq-100 hit new 52-week lows.
That relative strength followed

Cup and handleCup & handle that’s been formed since January. After an insider sell (sept 16) the price dropped a bit, but then after, an increase in volume, and it then broke the resistance line

HLIT - Cup with HandleEarly buy within base after seeing a Pocket Pivot develop yesterday crossing both the 10/20 EMA. Stop loss using yesterday's low

HLIT Very BullishIn recent days HLIT has consolidated at the 50 MA which appears to act as support as it coincides with prior resistance from the July high and the high open in April. This point of consolidation also acts as a gap fill from the gap up in August.
Given the confluence of all these points and that HL

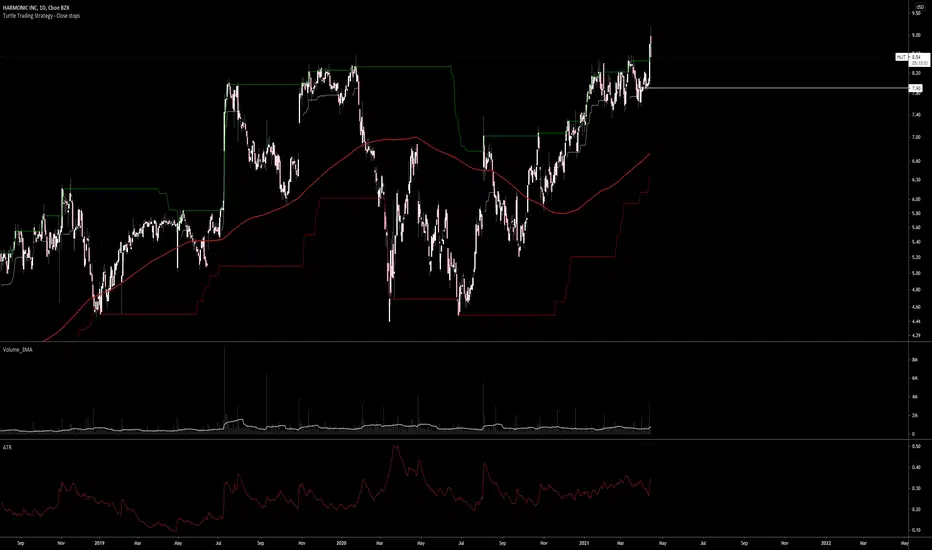
Long-term Downtrend Broken?Time will tell but it appears an almost 20-year downtrend/basing period has been broken. The breakout occurred with significant volume which makes it more likely to be genuine. Of course an initial shakeout/head fake could follow (and I may not have the trend line exactly right, tried to place it

Harmonic Inc on the weekly looking very interestingYou can draw your "yellow" B wave as a WXY, trendfib it, and you double bottomed at equal length. You can count 7 swings. When you examine the trend line touches of structure, it can count complete. If you invested lower down, I would say it would be worthy the gamble of letting run. Notice the "0"

HLIT - My new end of May play.I'll be updating this post with more indicators as to why I'm bullish on Harmonics from a technical standpoint (MACD, EMA, Fib Retracement, Volume, etc...)
But on this first chart we see we not only have a very strong MACD but we also have huge upside on the Fib Retracement. When I look to pick my

See all ideas
An aggregate view of professional's ratings.
Neutral
SellBuy
Strong sellStrong buy
Strong sellSellNeutralBuyStrong buy
Neutral
SellBuy
Strong sellStrong buy
Strong sellSellNeutralBuyStrong buy
Neutral
SellBuy
Strong sellStrong buy
Strong sellSellNeutralBuyStrong buy
Displays a symbol's price movements over previous years to identify recurring trends.
Frequently Asked Questions
Depending on the exchange, the stock ticker may vary. For instance, on SWB exchange Harmonic Inc. stocks are traded under the ticker HMC.
We've gathered analysts' opinions on Harmonic Inc. future price: according to them, HMC price has a max estimate of 10.82 EUR and a min estimate of 6.06 EUR. Watch HMC chart and read a more detailed Harmonic Inc. stock forecast: see what analysts think of Harmonic Inc. and suggest that you do with its stocks.
Yes, you can track Harmonic Inc. financials in yearly and quarterly reports right on TradingView.
Harmonic Inc. is going to release the next earnings report on Nov 3, 2025. Keep track of upcoming events with our Earnings Calendar.
HMC earnings for the last quarter are 0.08 EUR per share, whereas the estimation was 0.02 EUR resulting in a 395.68% surprise. The estimated earnings for the next quarter are 0.04 EUR per share. See more details about Harmonic Inc. earnings.
Harmonic Inc. revenue for the last quarter amounts to 117.17 M EUR, despite the estimated figure of 108.43 M EUR. In the next quarter, revenue is expected to reach 109.98 M EUR.
HMC net income for the last quarter is 2.44 M EUR, while the quarter before that showed 5.49 M EUR of net income which accounts for −55.61% change. Track more Harmonic Inc. financial stats to get the full picture.
No, HMC doesn't pay any dividends to its shareholders. But don't worry, we've prepared a list of high-dividend stocks for you.
As of Sep 14, 2025, the company has 1.24 K employees. See our rating of the largest employees — is Harmonic Inc. on this list?
EBITDA measures a company's operating performance, its growth signifies an improvement in the efficiency of a company. Harmonic Inc. EBITDA is 102.69 M EUR, and current EBITDA margin is 15.38%. See more stats in Harmonic Inc. financial statements.
Like other stocks, HMC shares are traded on stock exchanges, e.g. Nasdaq, Nyse, Euronext, and the easiest way to buy them is through an online stock broker. To do this, you need to open an account and follow a broker's procedures, then start trading. You can trade Harmonic Inc. stock right from TradingView charts — choose your broker and connect to your account.