JBLU: Breakthrough and growth potentialAn analysis of JetBlue Airways (JBLU) shares on the daily chart indicates the formation of a bullish pattern with a clear breakout of the resistance level. After consolidation and a rebound from significant support levels, the price broke through the upper boundary of the descending triangle, which
Key facts today
Next report date
—
Report period
—
EPS estimate
—
Revenue estimate
—
−0.9260 EUR
−767.95 M EUR
8.96 B EUR
291.09 M
About JetBlue Airways Corporation
Sector
Industry
CEO
Joanna L. Geraghty
Website
Headquarters
Long Island City
Founded
2021
ISIN
US4771431016
FIGI
BBG000GM3HM8
JetBlue Airways Corp. engages in the provision of air transportation services. Its brands include jetBlue, jetBlue Vacations, Paisly, and TrueBlue. It operates through the following geographic segments: Domestic and Canada, Caribbean and Latin America, and Atlantic. The company was founded by David Gary Neeleman in August 1998 and is headquartered in Long Island City, NY.
Related stocks

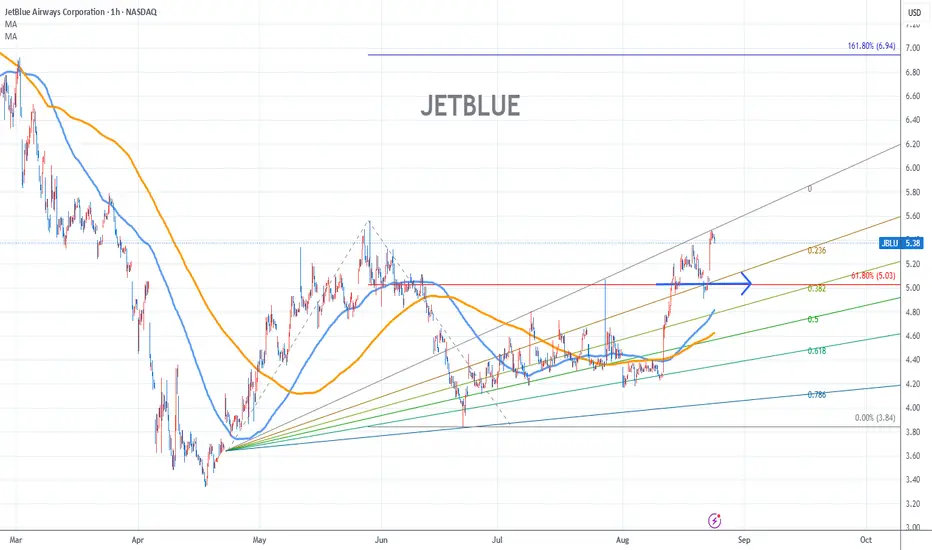
Jetblue Stock Chart Fibonacci Analysis 082225Trading Idea
1) Find a FIBO slingshot
2) Check FIBO 61.80% level
3) Entry Point > 5.0/61.80%
Chart time frame:B
A) 15 min(1W-3M)
B) 1 hr(3M-6M)
C) 4 hr(6M-1year)
D) 1 day(1-3years)
Stock progress:C
A) Keep rising over 61.80% resistance
B) 61.80% resistance
C) 61.80% support
D) Hit the bottom
E)
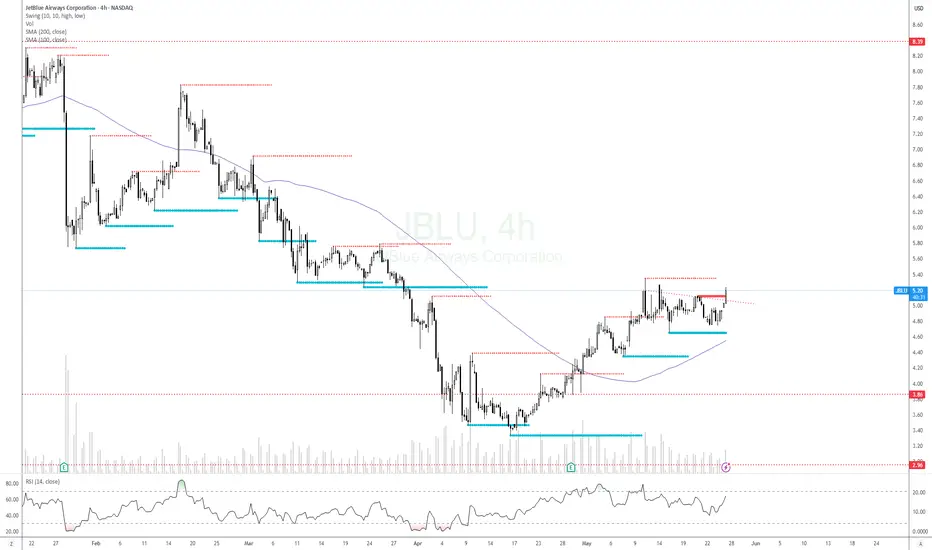
JBLU LongPrice has been moving sideways for quite some time, reached the bottom, and now seems like returning to the upside of the channel, with a continuation pattern and a break of a trend line.
Good luck.
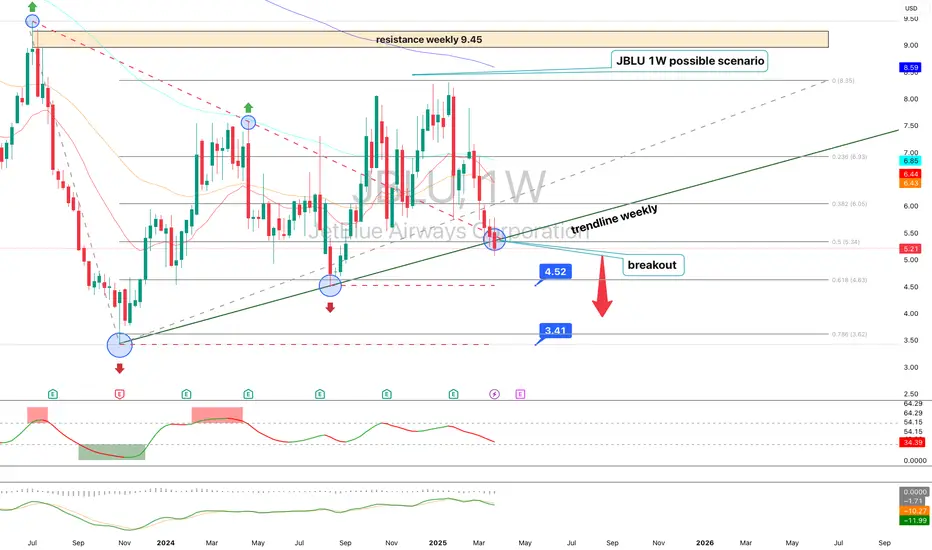
JetBlue Airways (JBLU) – Technical Analysis 1WJetBlue shares have broken a key weekly trendline, reinforcing a bearish outlook. After breaking support at $5.21, the price is heading toward $4.52 and potentially $3.41.
Technical indicators confirm the weakness: RSI shows declining momentum, MACD signals a bearish crossover, and EMA 50/200 indi
JBLU Breaking Down Bearish Momentum Points to $2.60 Next?Short-term, the chart suggests bearish momentum with potential for further downside. If the wedge fails to hold, the price could head toward the next major support levels near $2.60 as highlighted by the large red arrows.
Possibly price can get into the $1.61 level which would be a great entry pric

Trading idea - Entry point > 6.8/61.80%Trading Idea
1) Find a FIBO slingshot
2) Check FIBO 61.80% level
3) Entry Point > 6.8/61.80%
Chart time frame: B
A) 15 min(1W-3M)
B) 1 hr(3M-6M)
C) 4 hr(6M-1year)
D) 1 day(1-3years)
Stock progress: B
A) Keep rising over 61.80% resistance
B) 61.80% resistance
C) 61.80% support
D) Hit the bottom

JBLU Prediction: Q4 '24 Earnings Slide from Q1 '25 Guidance?It's my estimation that the market sentiment felt from AAL Q1 '25 guidance will ripple into JBLU's earnings report come JAN-28-25.
While AAL beat earnings estimates (revenue up 4.6% / $0.86/share vs. $0.66/share expected), Q1 guidance was set at a loss of $-0.40/share vs. $-0.04/share. Investors I

JetBlue Airways | JBLU | Long at $5.92JetBlue NASDAQ:JBLU - Earnings and revenue beat today, stock drops -26% by noon.
2025 Outlook:
"For the first quarter of 2025, JetBlue expects its available seat miles (ASM) to decline 2% to 5% year-over-year, with revenue per ASM projected to range from a 0.5% decline to a 3.5% gain, while an

Long Wick Candle We have an intriguing long wick candle, resting on the basis of the Keltner Channels (KC) and on a key level and near a small FVG. Will this candle allude to price consolidation or price reversal or joy for the bears, the continuation of the red wave?

Cleared for Takeoff!JetBlue Airways (JBLU) is showing strong bullish momentum, with a gap forming around the $6.25 level. A breakout above the $8.07 resistance would confirm further strength, positioning the stock to target the $9.42 weekly resistance. This trade offers an attractive risk-to-reward ratio, with downside

See all ideas
An aggregate view of professional's ratings.
Neutral
SellBuy
Strong sellStrong buy
Strong sellSellNeutralBuyStrong buy
Neutral
SellBuy
Strong sellStrong buy
Strong sellSellNeutralBuyStrong buy
Neutral
SellBuy
Strong sellStrong buy
Strong sellSellNeutralBuyStrong buy
Displays a symbol's price movements over previous years to identify recurring trends.
JBLU5872842
JetBlue Airways Corporation 9.875% 20-SEP-2031Yield to maturity
—
Maturity date
Sep 20, 2031
JBLU5412834
JetBlue Airways Corporation 0.5% 01-APR-2026Yield to maturity
—
Maturity date
Apr 1, 2026
JBLU4906056
JetBlue Airways Corporation 2.95% 15-MAY-2028Yield to maturity
—
Maturity date
May 15, 2028
JBLU5025287
JetBlue Airways Corporation 4.0% 15-NOV-2032Yield to maturity
—
Maturity date
Nov 15, 2032
JBLU5025288
JetBlue Airways Corporation 7.75% 15-NOV-2028Yield to maturity
—
Maturity date
Nov 15, 2028
JBLU4906055
JetBlue Airways Corporation 2.75% 15-MAY-2032Yield to maturity
—
Maturity date
May 15, 2032
See all JAW bonds
Curated watchlists where JAW is featured.


Frequently Asked Questions
Depending on the exchange, the stock ticker may vary. For instance, on SWB exchange JetBlue Airways Corporation stocks are traded under the ticker JAW.
We've gathered analysts' opinions on JetBlue Airways Corporation future price: according to them, JAW price has a max estimate of 6.87 EUR and a min estimate of 2.58 EUR. Watch JAW chart and read a more detailed JetBlue Airways Corporation stock forecast: see what analysts think of JetBlue Airways Corporation and suggest that you do with its stocks.
Yes, you can track JetBlue Airways Corporation financials in yearly and quarterly reports right on TradingView.
JetBlue Airways Corporation is going to release the next earnings report on Nov 4, 2025. Keep track of upcoming events with our Earnings Calendar.
JAW earnings for the last quarter are −0.14 EUR per share, whereas the estimation was −0.27 EUR resulting in a 50.19% surprise. The estimated earnings for the next quarter are −0.46 EUR per share. See more details about JetBlue Airways Corporation earnings.
JetBlue Airways Corporation revenue for the last quarter amounts to 2.00 B EUR, despite the estimated figure of 1.94 B EUR. In the next quarter, revenue is expected to reach 1.97 B EUR.
JAW net income for the last quarter is −62.82 M EUR, while the quarter before that showed −192.26 M EUR of net income which accounts for 67.33% change. Track more JetBlue Airways Corporation financial stats to get the full picture.
No, JAW doesn't pay any dividends to its shareholders. But don't worry, we've prepared a list of high-dividend stocks for you.
EBITDA measures a company's operating performance, its growth signifies an improvement in the efficiency of a company. JetBlue Airways Corporation EBITDA is 459.26 M EUR, and current EBITDA margin is 6.16%. See more stats in JetBlue Airways Corporation financial statements.
Like other stocks, JAW shares are traded on stock exchanges, e.g. Nasdaq, Nyse, Euronext, and the easiest way to buy them is through an online stock broker. To do this, you need to open an account and follow a broker's procedures, then start trading. You can trade JetBlue Airways Corporation stock right from TradingView charts — choose your broker and connect to your account.