KY6 trade ideas


Interactive BokersLooks like a long opportunity. I will not buy it because I need to buy at least 5 stocks and I am out of free cash currently

IBRK short term trendTrade #1 of this month
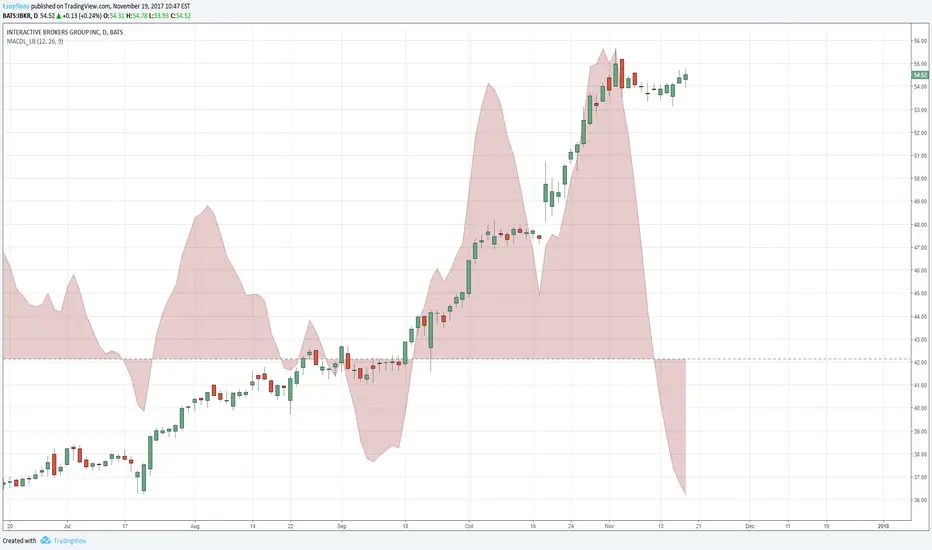
Yes MA200 EMA50 MA21 are all going downtrend but I think this is a near-term bottom. Entry around this level with a small position with first target at $44 and second target at $49.5 for the next two weeks timeframe and reduce position at $36.5/$32
Risk-return ratio at 1.2 - It's not a lucrative ratio if you are an aggressive type trader but it shall be a relatively safe starting position since anything logical or illogical could happen in a split second during this high volatile time.

IBKR Day Traders BreakoutTrading activity has increased significantly, so I'm expecting the brokerage stocks to follow.

bullish IBKR20EMA crosses 50EMA, meeting resistance but on an uptrend. Upcoming earnings call, figures to be good. IBKR is sensitive to slashed interest rates but is earning a large portion of revenue from commission and fees.
What else should I be looking at in order to determine whether a breakout is coming and if it is true or not?

Trade idea - LONG IBKRAfter some technical analysis and studying the price ranges of the past:
1) I have drawn important price points for IBKR
2) News Catalyst on JUL 21
3) I feel it is currently in a BUY zone
Have fun and happy trading!


IBKR - trade set up If we get any break below that hammer we should go to the 100MA on the monthly chart. Which is right around 55.50. Only take this if it breaks don't get in early because you "think" it will go lower.

$IBKR not yetI liked earnings but would like price to confirm by improving to beyond highlighted level

$IBKR Long into eps$IBKR, i have played $IBKR into the past 2 eps. It tends to sell off and then ramps up btwn 15-30 days before eps. I believe the market is giving us a good buy opportunity here into eps. With the markets being volatile that plays in favor of this stock. Traders are more active and thats how they make money. I started a position today in the July 20 65c. I bought a 1/2 a position with room to add. I see this stock around 68-70 before eps. I usually do not hold thru eps. please look at the charts to see the trends. ALSO RSI is extremely oversold. For my actual realtime trade you can follow me @breakingoptions

IBKR earnings playIBKR rests at long term support on the daily, as do many other financials. Bullish indicators suggest limited downside risk and large upside potential during earnings tomorrow.

$IBKR Long$IBKR looks like it is consolidating after its recent decline. With all the volatility in the market we have to assume there trading volume has increased since last quarters earnings. It also has good support at 63.33. I plan to buy calls in the morning. To see my exact entry and call following me @breakingoptions

IBKRIBKR is a pretty solid stock quality wise with good earnings estimates expensively traded above 50 times of its earnings.
At the moment, we can see hidden bullish divergences fully developed on all 3 indicators (RSI, MACD and Stoch). And the fact that RSI dipped really low to 30 levels and started showing signs of picking up is bullish. Last time it did this in 04/2017, it started a freak new huge trend.
The draw back for bullish case is, price has been really stagnant in the area where there should be a strong reaction. This lack of confirmation for bullish run concerns me.
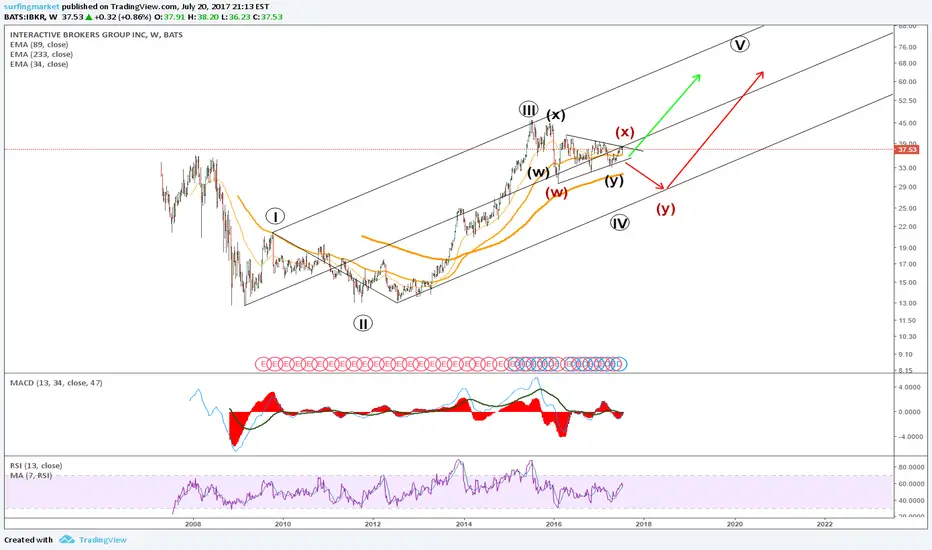
Wave count for IBKR at this point is also not very clear. Are we still in (5) of III (my main count) or III has been inplace at last high which will surely promise a much bigger drop, and the whole buildup we were talking above can very much be just a continuing flag.
So my take in this case is let us be patient and wait for a strong break out this buildup upper bounded at 71.20. If the break is strong and nice, we can take risk for some CALL.

Interactive brokers long term wave 4 could end ... or notIBKR has a large wedge comes to an end. It could resolves to both side. However, wave analysis, time analysis and the internal structure of the wedge suggests a upper move for a 5th wave.