NKE is a SELL here!Short term overbought, longer term nasty chart and tariff issues courtesy #donthecon because after all boys and girls "trade wars are easy to win" He hasn't won yet as he's been preoccupied ending the Ukraine war "day 1" and counting all the money Mexico sent to pay for the wall
Trade ideas

NKE - Fallen-Angel reversal + weekly divergence - LongNKE - Nike from Smart Money divergent scanner back on the 15th of April. It's also a fallen angel pattern; it's rolled up beautifully and hitting its first target. Some small insider buying.

$NKE Tradespoon – Long Entry $76.39Tradespoon model generated long signal for NYSE:NKE . Predicted range: $76.39–$80.79. Trend: +2.78%. NYSE:NKE

Short Trade Idea: NKE (Nike Inc.)🧠
📅 Timeframe: 30-Minute
💼 Type: Short Position
📉 Setup: Symmetrical triangle + rejection at resistance
📍 Trade Details:
Entry: ~$73.39 (just below triangle break/retest)
Stop Loss: ~$74.35 (above upper resistance & failed breakout)
Target 1: $71.52 (minor support / red line)
Target 2: $69.77 (mid-zone)
Target 3: $68.39 (major horizontal support)
🔎 Technical Breakdown:
Symmetrical triangle formed near the top — often signals reversal.
Strong resistance around $74.35 (yellow + white lines).
Price failed to break higher → pulling back from upper wedge trendline.
Bearish setup with well-defined risk.
🎯 Risk/Reward:
Risk is tight (1 point), while potential reward is over 2–3x depending on target hit.
Clean structure, suitable for short-sellers.

Buying NKE now offers a margin of safetyBuying now does not mean the price will not drop further. The thing about catching bottom remains an illusion for many, a brag for some during the lunchtime talk.
I have nibbled some yesterday and will buy more if it drops further.
As usual, please DYODD

NiKE annual continuation of the trendNike, a globally recognized, enduring brand, feels almost "too big to fail." I've been monitoring the $70 price level as a potential entry point for a wick fill trade in the near future, aiming for a 100% to 200%+ ROI over 6 months to 2 years. The stock shows signs of downside exhaustion and oversold conditions. Despite recent revenue declines, market cycles and Nike’s nearly 50-year brand resilience suggest a potential rebound.

Nike hit us hard… and that needs to be said too.Nike hit us hard… and that needs to be said too.
I’m not going to sugarcoat it: we entered a PUT before earnings, and we lost. We had over 20 criteria from our “Eagle Trap” system lined up — high RSI, a sharp rally with no solid fundamentals, declining sales in China and the U.S., weak forward guidance, low volume, and too much hype on social media. Everything pointed toward a disappointment.
And yes, the earnings report was weak. Revenues dropped again, guidance was soft, and there wasn’t anything particularly positive. But still, the stock went up after hours. And honestly, I still don’t get why.
My mistake? I thought I entered with 2 PUT contracts as planned, but I accidentally entered with 4. Luckily, I had my risk control in place, or the loss would’ve been even worse.
This was a tough one, but it’s a powerful lesson. Sometimes the analysis is solid, but the market does its own thing. You won’t always win — and you’ve got to accept that.
Now it’s all about keeping a cool head. No revenge trades, no emotional decisions. This loss won’t take me down — it’ll sharpen me. The system still works, and as long as I manage my risk and stay disciplined, I’ll keep growing.
The Eagle Trap isn’t perfect — but it’s smart. And the eagle always comes back to hunt.

NKE at 52-Week Lows Oversold Giant or Value Trap?Nike is a blue-chip name going through a rough patch. But this recent dip, fueled by disappointing earnings and macro uncertainty, could present a classic oversold opportunity. The stock is now in a high-probability reversal zone where risk/reward becomes extremely attractive.
🎯 Updated Entry Plan:
$58.00 – Soft support zone; start building a position
$53.00 – Close to the 52-week low; likely strong bounce area
$50.00 – 49.00 Psychological round number and historical demand zone
📈 Target Levels
Profit
TP1: $68
TP2: $77.50
TP3: $88.50
Pro Tip: Nike doesn’t stay down forever. The brand is fundamentally strong. This is not a growth story right now, it’s a value + patience play.
📢 Disclaimer: This is not financial advice. Always do your own research, manage your risk, and never risk more than you’re willing to lose.

6/26/25 - $nke - Good luck to the longs...6/26/25 :: VROCKSTAR :: NYSE:NKE
Good luck to the longs...
- keeping it small
- but let's be real
- nke still trades dayum near 30x earnings and earnings aren't growing.
- discretionary is impossible to buy
- tariff tylk back, whaddidu think?
- they miss miss miss...
- comps not reporting good results ex. NYSE:ONON (special brand)
- so could this one be different? obviously.
- but ATM P's as a lil juice on the short side to some of my longs looks like a nice setup.
- so i'm only deploying 5 bps on this for next weeklies. it's one of those situations where if stock rips... oh well, sized appropriately. i'd say rip is 30-40% chance and likely 5-10% most and possibly a retrace
- if dips... it will be deep... and multi-day into a quarter end which could see some rebalancing flows as funds prepare for the 3Q size ups
good luck to bill ackman. smart guy. but i don't get his love of nike. better to buy NYSE:DECK , and i don't even own that one rn...
V

Will Nike’s Upcoming Earnings ‘Just Do It’ for Investors?This hasn’t been the greatest year for Nike NYSE:NKE , which will report earnings next Thursday at a time when the stock is down more than 20% year to date. What does technical and fundamental analysis say might happen to the stock from here?
Let’s take a look:
Nike’s Fundamental Analysis
NKE ended Wednesday down 21.4% year to date, and last year wasn't so hot for the athletic-gear giant, either. Shares fell 30.3% over 2024 as a whole.
In fact, it’s been a tough decade so far for Nike, a one-time Wall Street darling.
All in, the stock has fallen some 66.8% since peaking at $179.10 in November 2021. Gross.
Things got so bad that former CEO John Donahoe "retired" in October 2024 -- a retirement that the firm’s board graciously “agreed” to.
The board then pulled in Nike veteran Elliott Hill, who had retired in 2020 after 32 years with the firm, off of the bench to serve as the company’s new CEO.
While it's still early, Hill hasn’t worked much magic so far for the stock, either.
Nike shares have struggled since March, when the firm beat analyst expectations for its fiscal Q3 earnings and revenues but provided poorly received forward guidance.
As for next week’s fiscal Q4 results, the Street is looking for NKE to report just $0.11 of GAAP earning per share on roughly $10.7 billion of revenue.
That would compare badly to the $0.99 of EPS on $12.6 billion of revenues that Nike saw in the same period last year -- an 88.9% decline in earnings per share and about a 15% drop in sales.
In fact, of the 23 sell-side analysts that I’ve found that track the stock, 21 have revised their fiscal Q4 earnings estimates lower since the quarter began. Only two have moved their forecasts to the upside.
Nike’s Technical Analysis
Now let's take a look at NKE’s chart going back some four months:
Readers will see that from early April through mid-June, Nike developed a so-called “rising-wedge” pattern of bearish reversal, marked with purple shading and a red box in the chart above.
Late last week, shares broke through the wedge’s lower trend line at about $62, which is the pivot point here.
Nike also recently gave up its 21-day Exponential Average (or “EMA,” marked with a green line above). That’s likely turned some swing traders against the stock for now.
The stock will now have to look to its 50-day Simple Moving Average (or “SMA,” denoted above with a blue line) for support. That’s at $59.50 in the chart above, but NKE was trading at $59.51 on Friday afternoon as I wrote this.
Should that line crack as well, a certain percentage of portfolio managers would likely have their risk managers force them to reduce long-side exposure to the stock.
But interestingly, readers will also note that from Nike’s late-February high to its early April low, shares hit resistance at the 38.2% Fibonacci retracement level of that move twice -- first in mid-May and then again a month later. This typically implies that there are probably institutional sellers at that level.
Looking at NKE’s other technical indicators, the stock’s Relative Strength Index (the gray line at the chart’s top) is on the weak side of neutral here. It’s not awful, but it also isn’t positive.
Worse, Nike’s daily Moving Average Convergence Divergence indicator (or “MACD,” marked with blue bars and black and gold lines at the chart’s bottom) is postured quite bearishly.
Within that indicator, the 9-day EMA (the blue bars) stands below zero, while the 12-day EMA (the black line) has crossed below the 26-day EMA (the gold line). Those are all typically negative technical signals for a stock.
(Moomoo Technologies Inc. Markets Commentator Stephen “Sarge” Guilfoyle had no position in NKE at the time of writing this column.)
This article discusses technical analysis, other approaches, including fundamental analysis, may offer very different views. The examples provided are for illustrative purposes only and are not intended to be reflective of the results you can expect to achieve. Specific security charts used are for illustrative purposes only and are not a recommendation, offer to sell, or a solicitation of an offer to buy any security. Past investment performance does not indicate or guarantee future success. Returns will vary, and all investments carry risks, including loss of principal. This content is also not a research report and is not intended to serve as the basis for any investment decision. The information contained in this article does not purport to be a complete description of the securities, markets, or developments referred to in this material. Moomoo and its affiliates make no representation or warranty as to the article's adequacy, completeness, accuracy or timeliness for any particular purpose of the above content. Furthermore, there is no guarantee that any statements, estimates, price targets, opinions or forecasts provided herein will prove to be correct.
Moomoo is a financial information and trading app offered by Moomoo Technologies Inc. In the U.S., investment products and services on Moomoo are offered by Moomoo Financial Inc., Member FINRA/SIPC.
TradingView is an independent third party not affiliated with Moomoo Financial Inc., Moomoo Technologies Inc., or its affiliates. Moomoo Financial Inc. and its affiliates do not endorse, represent or warrant the completeness and accuracy of the data and information available on the TradingView platform and are not responsible for any services provided by the third-party platform.

$NKEAs the Vietnamese Dong weakens against the Dollar, this could benefit $NKE. Cheaper production costs in Vietnam mean stronger margins, giving Nike room to stay competitive and stimulate the market while maintaining profitability. 📉💸👟

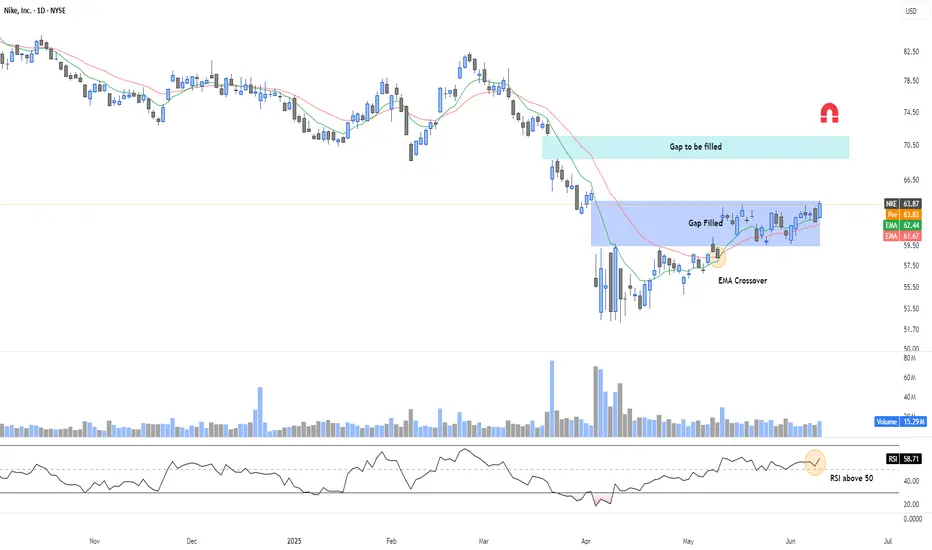
NKE – EMA Crossover and Bullish Continuation PotentialNIKE (NKE) has completed a clean technical gap fill and is now showing early signs of a trend reversal.
🔍 Key Technical Factors:
✅ Gap Filled: The March-April gap was filled cleanly and held.
✅ EMA Crossover: EMA 9 crossed above EMA 21 → bullish short-term signal.
✅ RSI > 50: Momentum shifting bullish; RSI reclaiming territory above neutral.
✅ Volume Confirmation: Increasing activity during the breakout attempt.
🎯 Next Target: Gap to fill around $70.50
📈 Strategy Outlook:
If price closes above $64.00, this could trigger continuation toward the next gap.
Invalidation below $61.50 (EMA cluster and recent base).
Nike (NKE) Long Term Buy - Pennant SetupNKE -33.46% 1Y
Analysts price target = 73.05 (suggests ~16.3% upside)
EPS expected to bottom in Q4 '25
P/E ~35% lower than historical
P/S ~42% lower than historical
Dividend yield 2.57%
Buy Zone = 58-60
Target 1 Area = 70-72

70% fall from the peak, is NIKE days over ?We can see from chart that NIKE has fallen from its glorious days and fallen 70% from its peak in Aug 2021. It is still on a downtrend.
Could Amazon be its saviour for the next 6 months or so, especially Christmas and Thanks Giving Day ?
Excessive inventory build up seems to be clogging the system and drag the revenues down! Not forgetting there are many other brands competing as well. It will take some months/years before we see a decent recovery.
Since I am vested, I will just park this in my garage and monitor on a monthly basis. Not adding more nor selling.

NIKE NKENike has a complicated situation with many competitors and the tariff issues between the US and Vietnam. I'm out when it reaches $80+, after which I'll see if there's any news.

NKE BuyInvesting in the stock market involves risks, and whether you should buy Nike (NKE) stock depends on your individual financial situation, investment goals, and risk tolerance. Here's a breakdown of factors to consider, along with some of the information available:
Analyst Ratings and Price Targets:
The consensus rating among analysts for Nike stock is generally "Buy."
However, individual ratings vary, with some analysts recommending "Strong Buy," "Hold," or even "Sell."
Price targets from analysts range significantly, from a low of $40.00 to a high of $120.00 for the next 12 months.
The average price target suggests a potential upside from the current trading price.
Technical Analysis:
Technical analysis indicators for Nike present a mixed picture. Some indicators suggest bullish signals, while others point to neutral or bearish trends.
The stock is currently trading between support and resistance levels. A break above resistance could signal a buying opportunity, while a break below support could indicate a selling opportunity.
Some sources indicate that the short-term trend is neutral, while the long-term trend remains negative.
Fundamental Analysis:
In the second quarter of fiscal year 2025, Nike's revenue declined by 8% year-over-year, attributed to weak lifestyle sales and changes in franchise management.
Some major investment firms have adjusted their positions in Nike stock.
Nike's profitability score is considered positive based on factors like Return on Equity (ROE), Gross Profit, and Return on Invested Capital (ROIC).
However, an intrinsic value calculation suggests that the stock might be overvalued compared to its current market price.
Overall Considerations:
Your Investment Horizon: Are you looking for a short-term trade or a long-term investment?
Risk Tolerance: Are you comfortable with the volatility of the stock market?
Diversification: What percentage of your portfolio would Nike represent? It's generally not advisable to put all your eggs in one basket.
Company Performance and Future Outlook: Consider Nike's future growth prospects, its competitive position in the market, and any potential challenges it might face.
Before making any investment decisions, it is crucial to conduct your own thorough research and consider consulting with a qualified financial advisor. They can help you assess your individual circumstances and provide personalized recommendations.
Keep in mind that past performance is not indicative of future results, and stock prices can fluctuate significantly.

Nike looking at a possible short term upsideNYSE:NKE Nike is looking at a possible mean reversion to the upside after long-term MACD is looking at a potential crossover of the signal line at the bottom and histogram is nearing to the zero line. Meanwhile, the Stochastic Oscillator has confirmed the oversold crossover, along side with the 23-period ROC rising above the zero line. Price action wise, the bullish engulfing candle at the gap resistance zone signal more buying pressure continuing. Besides that, the Ichimoku has shown two out of three bullish crossover. Short-term target is at 76.00

Expecting a push upwardsDiamond pattern detected on the hourly timeframe in the NYSE:NKE chart. I expect it to close the gap towards $63.xx very soon.

$NKE I expect NYSE:NKE to recover with support from Buy Now Pay Later options, summer sports & activities, and back-to-school sales. These factors can keep steady demand flowing into Nike’s ecosystem. Watch for a potential bounce. #nike

NKE | Buy @LTP | Strict SL below 51 | 1st Target 70📉 Nike Inc. (NKE) – Bullish Swing Setup in Play
Nike has formed a strong base around the $54–$56 zone after a significant downtrend. Price is currently consolidating within a demand zone and showing signs of accumulation. A breakout above this range could trigger a short-term bullish reversal.
📍 Entry: $56.40
🎯 Targets:
TP1: $62.65 (previous support turned resistance)
TP2: $70.51 (strong supply zone)
❌ Stop-loss: Below $52.28
Volume shows signs of drying up, indicating potential exhaustion of selling pressure. This setup offers a favorable risk-to-reward ratio if the reversal holds.

Monthly Demand on NKE!OptionsMastery:
🔉Sound on!🔉
📣Make sure to watch fullscreen!📣
Thank you as always for watching my videos. I hope that you learned something very educational! Please feel free to like, share, and comment on this post. Remember only risk what you are willing to lose. Trading is very risky but it can change your life!

NKE Accumulate in 2025 and new cycle commencementUsing W.D. Gann's Star method, NKE appears to have completed a downward cycle in terms of time, hitting a low of 52.28. The 360-degree angle points to a key support level around 50.19. After trending downward for about 3.45 years, the current price range of 49.8 to 52 looks like an interesting accumulation zone. This could be a potential buying opportunity, with possible selling targets in 2026-2027 around 82 and 115.
Important Note:
I’m just sharing my thoughts here based on this analysis—it’s not financial advice! Please do your own research before making any investment decisions.

Nike ($NKE ) Rally to Fail in 7-Swing PatternNike (NKE) shows a bearish trend that began at its peak on November 8, 2021, indicating potential for further declines. On a shorter cycle, the stock’s drop from its October 1, 2024 high is developing as an impulsive Elliott Wave structure, characterized by sharp downward moves. From that high, wave (1) concluded at $68.62, followed by a wave (2) recovery that peaked at $82.44. The stock then continued its descent in wave (3), reaching $50.87, as illustrated in the 45-minute chart below.
Currently, Nike is in a corrective phase, forming wave (4) as a double three Elliott Wave pattern. From the wave (3) low, wave ((a)) rose to $59.22, followed by a wave ((b)) dip to $51.90. The subsequent wave ((c)) advance ended at $59.76, completing wave W. A pullback in wave X bottomed at $52.28, and the stock is now progressing in wave Y, structured as another double three pattern. From wave X, wave ((w)) reached $59.48. A brief pullback in wave ((x)) is expected to conclude soon, setting the stage for wave ((y)) to push toward the blue box zone of $61.09–$66.49. Sellers are likely to emerge in this area, potentially driving the stock lower again.
