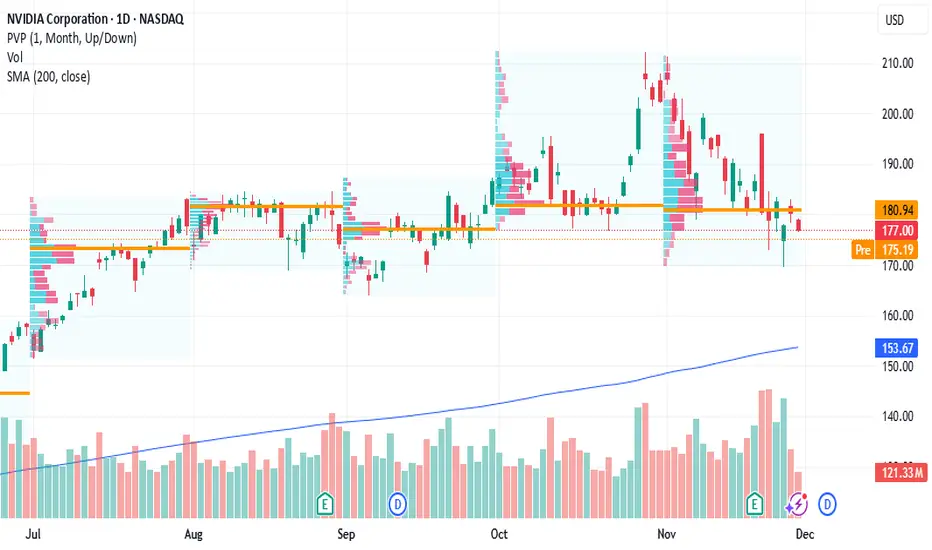
NVDA Wave Analysis – 4 December 2025- NVDA reversed from support zone
- Likely to rise to resistance level 194.30
NVDA recently reversed with the daily Hammer from the support zone between the multi-month support level 170.00 (which has been reversing the price from August), lower daily Bollinger Band and the support trendline of the daily down channel from October.
NVDA just broke the aforementioned down channel from October – which is lily to strengthen the bullish pressure on NVDA .
Given the clear daily uptrend, NVDA can be expected to rise to the next resistance level 194.30 (which reversed the price at the end of November).
Trade ideas

$NVDA - $140 Target - Short Position - AI Bubble About to BurstIn my opinion, Nvidia does not have much to continue the next needed support for a pro-longed bull run, at least in terms of sentiment. The AI bubble has gone on for too long and the actual multiples of valuations in comparison to revenue and profit generations do not seem to have strong support when considering traditional investing strategies. Also, the next wave seems getting closer and closer to a red trend. Retracement potential is possible after hitting $140, but Nvidia needs to do far more benefit for the public good and have a differentiation that doesn't rely on trends such as crypto mining and the boost of LLMs. As always, none of this is investment or financial advice. Please do your own due diligence and research.
NVDA — WEEK 49 TREND REPORT | 12/03/2025NVDA — WEEK 49 TREND REPORT | 12/03/2025
Ticker: NASDAQ:NVDA
Timeframe: WEEKLY
This is a reactive structural classification of NVIDIA based on the weekly chart as of this timestamp. Price conditions are evaluated as they stand — nothing here is predictive or forward-assumptive.
⸻
1) Current Trend Condition [ Numbers to Watch ]
• Current Price @ 180.26$
• Trend Duration: +31 weeks (Bullish)
• Trend Reversal Level (Bullish): 190.87$
• Trend Reversal Level (Bearish Confirmation): 176.52$
• Pullback Support : 167.75$
• Correction Support : 132.86$
⸻
2) Structure Health
• Retracement Phase:
Pullback (approaching 78.6%)
• Position Status:
Caution (interacting with structural layers)
⸻
3) Temperature :
Cooling Phase
⸻
4) Momentum :
Coiling
⸻
5) Market Sentiment
Bullish
⸻
Author’s Note
This analysis is fully reactive, not predictive. Market conditions, trend structure, and behavior are classified as they appear in real time. The objective is to identify where directional shifts first occurred, where structural integrity remains intact, and where it would begin to weaken if key levels were breached.
Predictive analysis projects outcomes that do not exist yet. Without price confirmation, prediction is built on baseless assumptions. This framework avoids that entirely by responding only to verified structural changes and live conditions.
The levels shown simply identify where the current trend structure first shifted and where it would begin to lose integrity if breached. Recognizing these boundaries allows for clearer interpretation of market behavior without relying on forward guarantees, speculative projections, or unsupported assumptions.
⸻
Methodology Overview
This classification framework evaluates directional conditions using internal trend-interpretation logic that references price behavior relative to its structural layers. These relationships are used to identify when price movement aligns with the framework’s criteria for directional phases, transition points, or regime shifts. Visual elements or structural labels reflect these internal interpretations, rather than explicit trading signals or preset indicator crossovers. This framework is observational only and does not imply future outcomes.

NVDA QuantSignals Alert: High-Volatility Bearish Move IncomingNVDA QuantSignals Katy 1M Prediction 2025-12-02
QuantSignals Katy AI Stock Analysis
Analyzed 1 stock(s): NVDA
NVDA Analysis
Current Price: $183.28
Final Prediction: $181.20 (-1.14%)
30min Target: $180.13 (-1.72%)
Trend: BEARISH
Confidence: 57.6%
Volatility: 37.9%
🎯TRADE SIGNAL:
Direction: SHORT
Entry: $183.28
Target: $181.62
Stop Loss: $186.03
Expected Move: -1.14%
Summary: Generated 1 trade signals from 1 successful analyses out of 1 symbols.

NVDA Swing Trade – Bearish Reversal SetupInstrument: NVDA
Direction: Buy Puts (Short)
Strike: $165.00
Entry Price: $1.08
Profit Target 1: $1.85
Profit Target 2: $2.50
Stop Loss: $0.65
Expiry: 14-day horizon
Position Size: 3% of portfolio (medium conviction)
Confidence: 65%
Risk Level: Moderate – counter-trend trade against broad market strength
Analysis Summary:
Katy AI predicts a bearish move toward $165-$170 based on technical weakness.
BEARISH_ENGULFING candlestick pattern confirmed; VWAP and momentum indicators suggest selling pressure.
High put/call ratio (3.60) shows strong institutional hedging.
Moderate risk due to broad market bullishness; monitor SPY/QQQ correlations.
This trade is a contrarian play, designed to capture downside in NVDA despite overall market strength.

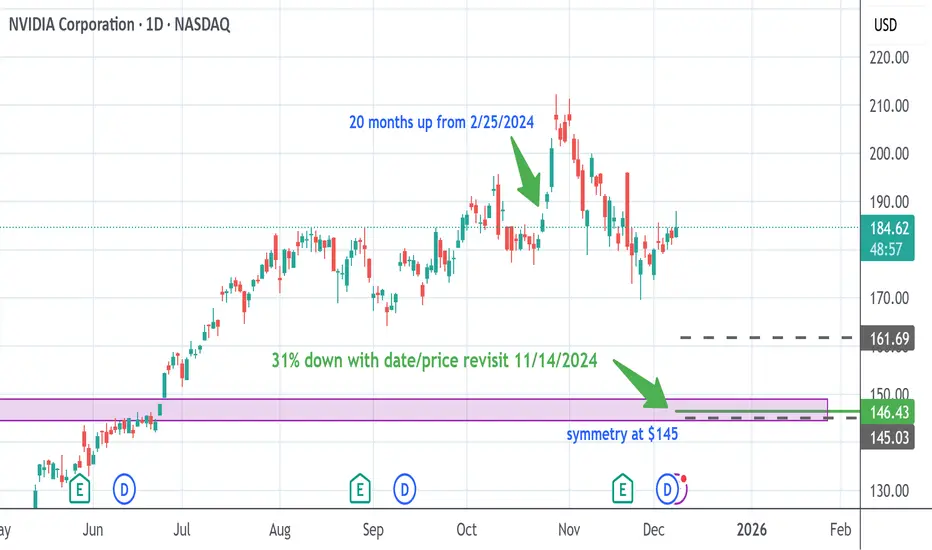
How low do we go? NVDAI get my information on where stocks might be headed based on my dowsing- as-in, with a pendulum. A super interesting thing occurred, which is that I did a reading on NVDA back on Feb. 25, 2024, which suggested a future date to be aware of in 20 months from then.
I just put the date in my my phone calendar for Oct. 24th 2025 with a couple alerts so I can pay attention. When I saw NVDA made these highs and pulled right back, I was super intrigued as it was in my date window. It's now head and shouldersy looking, and as such, I did draw a couple symmetry lines (are annotated as gray dashes) for reference.
(Love than my target is right above the second symmetry.)
I have been getting lower levels on NVDA, but I'm getting tired of some of these multiple numbers I get, so I just asked what advice there is and it said to get a date.
When I get a date, it often means a price revisit, or could be a pattern repeats from the past.. In this case, it's suggesting a price revisit to where NVDA traded on 11/14/2024. Then, I asked how many percent down from the ath at $212 & it gives me 31%.
My joy came when I drew the price lines out for the date, and lo and behold they overlay the 31% down price (146.41)!
I attempted to find out when this may hit, and I get Feb. 20th or 26th zone.
Let's boogie!
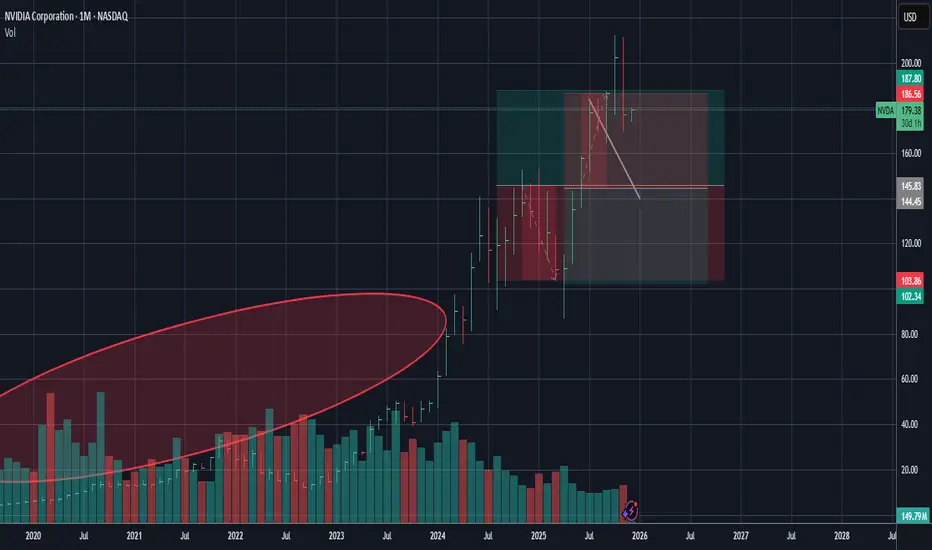
NVIDIA Trading plan from $100 to $1000. Is it plausible?Exactly a month ago, we called the end of the rally on NVIDIA Corporation (NVDA), essentially the end of its multi-year Bull Cycle and the beginning of an aggressive Bear Cycle correction.
** The 10 year Channel Up **
So far this is paying dividends as the stock just completed a 4-week red streak. The essence of NVIDIA's trend has been a decade long Channel Up, as you can see on this chart and that's the basis of all the buy entries and sell exits we've made over the years.
** Bull and Bear Cycles **
Since early 2025, the stock started that Channel Up, whose first Bull Cycle (as well as the next ones with the exception of one breaking) was supported by the 1W MA50 (blue trend-line). Once that Bear Cycle (in the form of the Channel's Bullish Leg) ended, the subsequent Bear Cycle (Bearish Leg) broke below both the 1W MA50 and 1W MA100 (green trend-line) and bottomed exactly on its 1W MA200 (orange trend-line), marginally above the 0.382 Fibonacci retracement level.
The following Bull Cycle as well as the Bear Cycle followed the same structure only, the bottom was this time marginally below the 0.382 Fib. Then the Bull Cycle that just ended started, with only basic difference that its early 2025 correction broke below the 1W MA50 but found Support on the 1W MA100. Every Bull Cycle had such pre-Top correction (blue ellipse). Note also that this last Bull Cycle as been the strongest Leg on +1881% rise and the one before it, the 'weakest' at +1004%.
** The RSI **
Notice also that the 1W RSI has made the same Double Top rejection pattern on the Lower Highs Zone that both previous Bull Cycle Tops did. Strong confirmation therefore of the emerging Bear Cycle.
** The next bottom **
Technically, we expect the market to bottom yet again on the 1W MA200, which by a fair projection of its current trajectory, we expect that to be around $100. That would still be considerably above the 0.382 Fib, which can only get hit if the Bear Cycle falls very aggressively. Note here that historically within this Channel Up, the most optimal buy signal was given when the 1W RSI hit 42.00. Use that in combination with the 1W MA200.
** Future Targets **
So after the Bear Cycle bottoms, what Target can we pursue? Well the 'minimum' projection based on the 2.618 Fibonacci extension of the Bull Cycle that just ended is $700. At the same time, if it rises by again the 'minimum' % of the weakest +1004% Bullish Leg of the Channel, we are looking potentially at a 4-year Target of $1100. It is also worth noting the valuable use of the Sine Waves that have so far accurately grasped the peak formations of the Bull Cycles. We can use this to time our market exits in 2029.
Realistic or not subjectively, the $100 to $1000 path is what the pure technicals and historical data support and clearly show is a very likely probability for a long-term investment.
---
** Please LIKE 👍, FOLLOW ✅, SHARE 🙌 and COMMENT ✍ if you enjoy this idea! Also share your ideas and charts in the comments section below! This is best way to keep it relevant, support us, keep the content here free and allow the idea to reach as many people as possible. **
---
💸💸💸💸💸💸
👇 👇 👇 👇 👇 👇

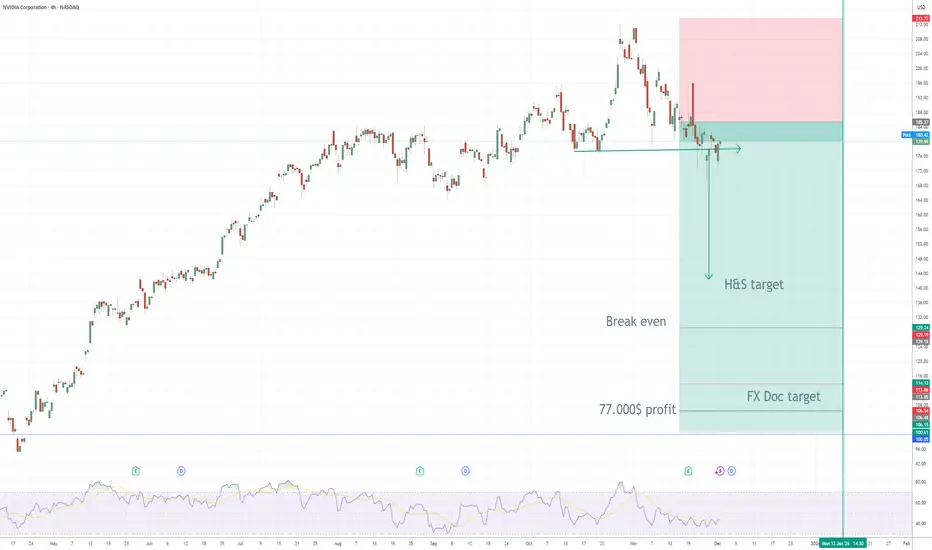
NVIDIA (NVDA) – My PUT Options Position ExplainedI opened a medium-term bearish position on NVDA by purchasing PUT options.
Here’s the full breakdown of the idea, entry logic, and projected targets.
🧠 Why I Entered the Trade
NVDA formed a clear Head & Shoulders (H&S) reversal pattern on the 4H chart — one of the strongest technical reversal signals after an extended bullish trend.
The neckline has now been broken, validating the structure and confirming bearish momentum.
The rejection from the right shoulder, combined with weakening RSI and loss of key market structure, provides additional confirmation.
🎯 My PUT Options Position
I purchased PUT contracts with a defined risk and leveraged downside exposure.
Break-Even Price: ~129 USD
This is the key level where:
the option premium is fully recovered
the position shifts from “loss” to “profit”
As long as NVDA trades below 129 USD before expiration, the position begins generating profit.
💰 Profit Projection
My profit target zone is around 102 USD.
At that level, the trade yields approximately:
➡️ +77,000 USD profit
This aligns with:
the measured target of the Head & Shoulders pattern
previous demand zone turning into resistance
Fibonacci extensions
a full correction of the last impulsive leg
📌 Technical Breakdown
H&S target: ~160 → ~130 → projected extension toward 102
Break-even: 129 USD
FXDoctor target: 102 USD
Trend structure: Major lower lows forming
Momentum: RSI breakdown and bearish continuation signals
The chart clearly shows a potential shift from a hyper-parabolic bullish phase into a deeper correction — a move that benefits PUT buyers with asymmetric risk/reward.
🧨 Summary
I’m holding PUT options on NVDA
Break-even: 129 USD
Projected profit: ~77,000 USD at 102 USD
The trade is based on a clean and validated Head & Shoulders reversal
NVDA is showing early signs of a much larger bearish correction
NVDA to $170? AI Bubble Risk, Big Money Exits & Heavy Shorts !I f you haven`t bought NVDA before the previous earnings:
Now you need to know that NVIDIA has dominated 2023–2025, becoming the face of the global AI boom. But the higher the climb, the harder the fall. While NVDA is still seen as “untouchable,” several major signals suggest the stock could revisit levels near $170 — a healthy correction of 10–15% from here.
1. Major Investors Are Exiting — SoftBank Dumped Everything
SoftBank, one of Nvidia’s earliest and most influential institutional backers, sold its entire stake in late 2025, worth roughly $5.8 billion.
Smart-money exits near all-time highs should never be ignored.
SoftBank rarely sells unless it believes:
- the sector is overheated
- the valuation has run too far
- risk/reward becomes asymmetric
This mirrors their strategy in 2021–2022 when they unloaded overvalued tech before the correction.
SoftBank’s full exit is a red flag for anyone ignoring the possibility of an AI bubble.
2. Michael Burry Bought Massive Puts — A Direct Bet Against the AI Mania
Michael Burry — famous for predicting the 2008 crisis — has quietly increased his put positions on NVIDIA and other AI names.
Why does this matter?
Because Burry doesn’t short “normal” overvaluations.
He shorts bubbles.
His AI thesis:
- expectations are unrealistic
- revenue growth is priced as infinite
- companies are spending billions on AI with no short-term monetization
- chip demand could normalize faster than markets expect
When a contrarian with Burry’s track record bets against a trend, it’s worth paying attention.
3. NVIDIA’s Valuation Is Stretched Even for a Hyper-Growth Company
Even bulls agree: NVDA’s multiples are once again aggressively priced.
Key issues:
• Price-to-Sales historically elevated
NVDA is trading at a P/S ratio that would be insane for any company approaching a $5 trillion market cap.
• Revenue growth expectations assume perfect long-term AI adoption
If AI monetization slows or plateaus even slightly, NVDA’s valuation collapses fast.
4. Are We in an AI Bubble? Many Indicators Say Yes
Top analysts, academics, and even bullish investors admit:
AI has bubble-like behavior.
Evidence of a bubble:
- Stock prices rising faster than actual earnings growth
- Companies buying GPUs “because everyone else is doing it”
- Zero clarity on monetization for many AI firms
- AI startups valued at billions with no revenue
- Media hype similar to 1999 dot-com sentiment
Harvard Business Review, Wired, and Investopedia already discuss the “AI bubble thesis.”
If AI expectations don’t materialize fast enough, NVDA becomes the single most vulnerable stock on the market.

Indices in the Global MarketWhat Is a Market Index?
A market index is a statistical measure that represents the value of a group of stocks. These stocks are chosen based on specific criteria such as industry, market capitalization, liquidity, or sectoral allocation. The purpose of an index is to track the performance of a market segment over time.
Indices provide:
A benchmark for investors to compare their portfolios.
A snapshot of market conditions.
A tool for passive investing through index funds and ETFs.
A reference point for derivative products like index futures and options.
Global indices summarize the performance of economies worldwide, making them vital for understanding international trends.
Types of Global Market Indices
Global indices can be categorized based on their scope and underlying composition. Here are the major types:
**1. Country-Specific Indices
These indices track the performance of a particular country’s stock market.
Examples:
United States:
S&P 500
Dow Jones Industrial Average (DJIA)
Nasdaq Composite
India:
Nifty 50
Sensex 30
Japan:
Nikkei 225
TOPIX
China:
Shanghai Composite
Hang Seng (Hong Kong market)
These indices reflect the economic condition of the respective nation, investor confidence, and market trends.
**2. Regional Indices
These track the combined markets of specific geographic regions.
Examples:
STOXX Europe 600 — represents Europe
FTSE Europe Index — major companies across Europe
S&P Asia 50 — top companies across Asian countries
Latin America 40 (LATAM 40) — top Latin American stocks
Regional indices help investors understand broader continental trends rather than country-level movements.
**3. Global Indices
These reflect the performance of companies worldwide.
Examples:
MSCI World Index — covers developed countries globally
MSCI Emerging Markets Index — tracks emerging economies
FTSE All-World Index — combines developed + emerging markets
Global indices are useful for gauging the health of the worldwide equity market.
**4. Sector-Specific Indices
These track particular industries such as technology, finance, energy, or healthcare.
Examples:
NASDAQ-100 Technology Index — tech-oriented companies
S&P Global Clean Energy Index
MSCI Global Financials Index
These help investors diversify or focus on high-growth sectors.
5. Weighted Indices (Price-Weighted, Market Cap-Weighted, Equal-Weighted)
Most global indices use one of the following methods:
Market Cap Weighted
Larger companies have more influence.
Examples: S&P 500, MSCI World.
Price Weighted
Stocks with higher prices have more influence.
Example: Dow Jones Industrial Average.
Equal Weighted
All stocks contribute equally regardless of size.
Why Global Indices Matter
Indices are more than just numbers—they drive major financial decisions.
1. Indicators of Economic Health
Indices reflect how well sectors or economies are performing.
A rising index generally signals economic expansion, while a falling one indicates slowdown.
For example:
When the S&P 500 rises consistently, it often signals strong U.S. corporate earnings.
When the Nikkei 225 falls sharply, it may indicate issues in Japan's industrial or export sectors.
2. Benchmarks for Portfolio Performance
Investors compare their returns to indices:
If a portfolio grows 10% while the S&P 500 grows 15%, the portfolio underperformed.
Fund managers aim to outperform benchmarks.
3. Underlie Passive Investment Products
Indices form the foundation for:
Index mutual funds
ETFs
Index futures
Index options
This allows investors to gain exposure to entire markets with ease.
4. Tools for Global Diversification
Investors use indices to diversify across:
Countries
Regions
Sectors
Market capitalizations
For example, someone in India can invest in global indices like Nasdaq 100 to gain exposure to U.S. technology giants.
Major Global Market Indices Explained
Below are some of the most influential indices across the world:
1. S&P 500 (USA)
Tracks the top 500 publicly traded U.S. companies.
Considered the most accurate representation of the U.S. economy.
Covers about 80% of U.S. market capitalization.
2. Dow Jones Industrial Average (USA)
Oldest U.S. index.
Tracks 30 large blue-chip companies.
Price-weighted.
3. Nasdaq Composite (USA)
Tech-heavy.
Includes over 3,000 stocks.
Reflects innovation and growth sectors.
4. Nikkei 225 (Japan)
Price-weighted index of 225 major Japanese companies.
Represents Asia’s most influential market.
5. FTSE 100 (UK)
Top 100 companies listed on the London Stock Exchange.
A key benchmark for the UK economy.
6. DAX 40 (Germany)
Tracks Germany's top 40 blue-chip companies.
Represents the powerhouse of the European Union.
7. Hang Seng (Hong Kong)
Represents Hong Kong’s free-market financial hub.
Strong exposure to Chinese companies.
8. Shanghai Composite (China)
Includes all stocks listed on Shanghai Stock Exchange.
Represents China’s domestic economic health.
9. Nifty 50 & Sensex (India)
Nifty 50: Top 50 companies by market cap.
Sensex: 30 large companies.
Both reflect India’s fast-growing economy.
How Global Indices Influence Each Other
In today’s interconnected economy, movements in one major index affect others.
Example:
If U.S. indices crash, Asian and European markets often fall the next day.
When China reports weak economic data, indices like Hang Seng, Nikkei, and even DAX may decline.
Global indices move in a chain reaction due to:
Trade relations
Currency fluctuations
Global risk sentiment
Monetary policy decisions
Indices as Tools for Traders
Global indices are widely used for:
1. Technical Analysis
Price trends, support/resistance levels, and chart patterns influence trading decisions.
2. Futures and Options Trading
Indices like Nifty, Dow, and Nasdaq have liquid derivative markets.
3. Hedging
Investors hedge their equity portfolios using index derivatives.
Conclusion
Global market indices are essential components of the financial ecosystem. They summarize economic performance, guide investment strategies, influence global capital flow, and provide transparent benchmarks for evaluating market trends. Understanding these indices gives traders and investors the ability to make informed decisions, diversify globally, and interpret the broader financial landscape. Whether you follow the S&P 500, Nikkei 225, FTSE 100, or Nifty 50, each index tells a story about its economy, sector, and global interconnectedness—making indices indispensable tools for navigating the world of finance.

Nvidia breakdown signals further downside this weekCurrent Price: $183.11
Direction: SHORT
Confidence Level: 68% (The majority of professional traders highlight ongoing weakness, technical downtrend channels, and critical support at $174.15 as being at risk. Sentiment leans bearish despite some long-term bullish bets.)
Targets:
- T1 = $175.00
- T2 = $164.00
Stop Levels:
- S1 = $187.00
- S2 = $190.00
**Wisdom of Professional Traders:**
I'm seeing consistent caution among the professional traders tracking Nvidia this week. Several traders point out that the price action remains stuck in a downtrend, with multiple mentions of resistance around $185–$187 and support sitting near $174.15. The consensus from the trading community is that Nvidia's inability to regain the 50-day moving average is keeping the momentum tilted toward the downside, especially with competitive threats from Google's TPU chips pressuring sentiment.
**Key Insights:**
The key point here is the near-term weakness that follows Nvidia's last earnings release. Despite strong results, traders observed a “gap and crap” setup, where the initial post-earnings rally quickly reversed. Many traders are watching the $174.15 level closely; a decisive break here could trigger a sharper sell-off toward the May lows around $164. In this short-term context, long-term call leaps into 2028 don't outweigh the immediate technical vulnerability. The repeated failure to hold above $185 shows sellers are defending that zone aggressively.
Another factor to consider is sector rotation. Several traders noted that other semiconductor names like AMD, Broadcom, and Qualcomm are showing relative strength while Nvidia lags. This divergence suggests capital is moving away from Nvidia into peers, which could exacerbate near-term pressure.
**Recent Performance:**
This all played out in recent sessions as Nvidia declined over 12% last month, breaking key technical levels and underperforming both the Philly Semiconductor Index and Nasdaq. Last week’s price closed down 1.8% even as many tech names bounced, underscoring persistent weakness.
**Expert Analysis:**
Multiple professional traders' analysis points to clear downside setups. Several mentioned Nvidia being “bearish unless it breaks 185” with lower-high patterns forming. Support zones at $174.15 and $164 are in play if the trend continues. Many traders highlighted heavy institutional selling, potentially linked to AI bubble concerns. Even those with long-term bullish views admit the near-term chart is unattractive, and that the downtrend channel remains intact.
**News Impact:**
What's interesting is the competitive pressure narrative gaining traction — especially reports about Meta considering Google TPUs in future data centers. This kind of news has already triggered multiple single-day drops exceeding 6%, adding fuel to the bearish case. While the Fed’s policy pivot could help broader markets, traders are pointing out that Nvidia’s specific headwinds—valuation, technical breakdowns, and competitive threats—are more pressing in the short-term.
**Trading Recommendation:**
Putting it all together, I’d look for short setups below $183, targeting $175 first and then $164 if bearish momentum accelerates. Stops should be placed above $187 to limit losses, with a wider emergency stop at $190 in case of a sharp reversal. Position sizing should reflect moderate confidence, with risk kept tight until Nvidia reclaims and holds above the 50-day moving average. This looks like a tactical short for the week, taking advantage of persistent weakness and well-defined technical levels.
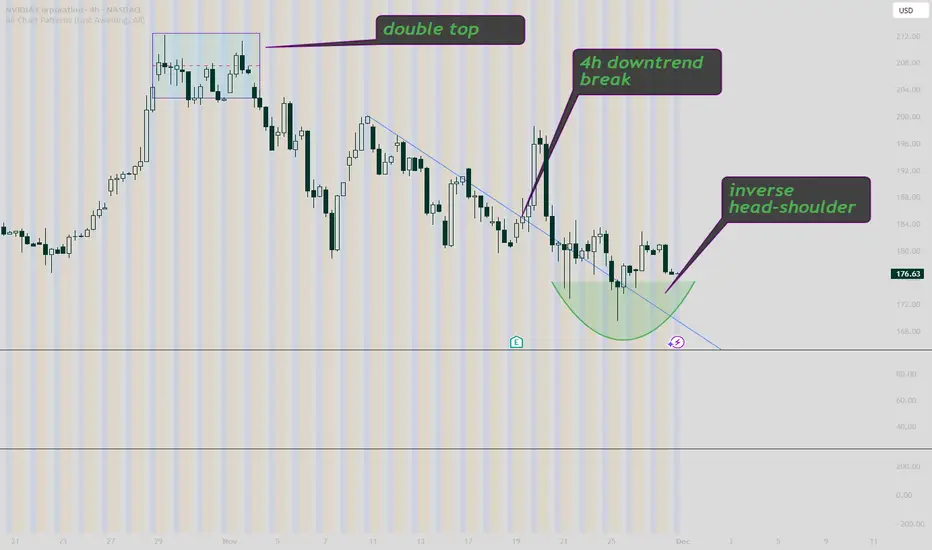
NVDA 4H TECHNICAL ANALYSIS NVDA has broken a downtrend triggered by a double top, and has now formed a inverse head and shoulders
NVDA at a Decision Level – Dec 1–5 OutlookWeekly – Trend Still Up, But Losing Strength
NVDA has been riding a strong multi-month uptrend, but the last few weekly candles show the first real slowdown. A clear CHoCH formed near the recent highs, and sellers stepped in aggressively. The weekly candle closed with a long upper wick and a heavier body — signaling momentum cooling.
Important weekly zones:
* $198–200: previous weekly supply
* $176–178: weekly support where buyers stepped in
* $153–160: deeper weekly demand
* $120s: major demand if the market rolls over hard
Weekly tone → still bullish on the big structure, but fading momentum with the first signs of deeper pullback potential.
Daily – Inside a Pullback After Supply Rejection
Daily shows a sharp rejection from the supply zone near $210–215. Price broke structure downward (CHoCH), then bounced from a lower demand zone but hasn’t reclaimed the supply above.
Daily key levels:
* Resistance: $198 → $212
* Support: $177 → $172
Until price fully reclaims and holds above $198–200, NVDA stays at risk for lower continuation.
Daily tone → trapped underneath supply, struggling to regain upside momentum.
1-Hour – Sideways Grind After Breakdown
The 1H shows clean weakness:
* BOS downward
* Multiple failed retests of $182–183
* Price repeatedly rejecting the underside of the broken trendline
* Buyers only defending short-term at $176–178
The more NVDA keeps getting rejected at the same 1H resistance, the more pressure builds for a deeper dip.
Short-term 1H levels:
* Breakout: above $183 → retest $188–190
* Breakdown: below $176 → flush toward $172–170
1H tone → consolidation after rejection, leaning bearish unless buyers reclaim $183.
15-Minute – Compression Before the Next Move
The 15m chart is compressing inside a tight range after the clean BOS move earlier. This type of structure usually leads to an impulsive move.
The repeated rejection at $182–183 shows sellers defending aggressively. Buyers are only holding the short-term demand around $176–178.
15m tone → leaning bearish unless it breaks above $183 with real strength.
GEX – Options Positioning Shows the Real Pressure Points
On the NVDA GEX chart:
* Highest positive GEX: $185–187 → magnet + resistance
* 3rd CALL wall: near $190 → extension if momentum flips
* PUT walls:
* $172–175: heavy PUT support
* $160: large negative gamma zone
* $145–150: deep support if the market panics
What GEX is saying:
* Below $183, market makers lean bearish and push toward $176–172.
* A clean break above $185 can snap the chart upward into $188–190 fast due to positive gamma.
* A breakdown below $176 opens a straight path to $170–172 with momentum.
GEX aligns perfectly with the TA:
* All timeframes showing pressure from above
* GEX walls lining up with the exact levels on the 1H and 15m
* A bigger move waiting as soon as NVDA loses or reclaims the key areas
Trading Thoughts – Dec 1–5
Bullish Setup
NVDA needs a clean break + hold above $183–185.
Targets:
* Target 1: $188
* Target 2: $190 (CALL wall)
Stop zone → below $176
Call idea (only if breakout happens):
NVDA 185C / 190C, short-dated — ONLY after confirmation.
Bearish Setup
If NVDA loses $176, downside opens quickly.
Targets:
* Target 1: $172
* Target 2: $170
* Target 3: $160 (deep support on GEX)
Put idea (safer):
NVDA 172P or 170P — only valid if breakdown happens.
Overall Outlook for Dec 1–5
NVDA is sitting right at a squeeze point.
Key alignments:
* Weekly: losing momentum
* Daily: stuck under major supply
* 1H: rejecting underside of broken trendline
* 15m: compression before a direction
* GEX: clear resistance above $185 and clear support at $176 → perfect pressure map
The next move will be clean once direction confirms.
This is the type of setup where option traders shouldn’t guess — just wait for the breakout or breakdown and ride the move.
Disclaimer
This analysis is for educational purposes only, not financial advice. Always trade with proper risk management and confirmation.
NVDA Hagia Sophia CRACKING! CAUTION!NVDA is starting to fall apart. Nice rounding top followed by mini towerspike (as shown in the picture) that is now starting to roll over.
The price was rejected after the first crack that bounced lower. That's the big warning CRACK! Now we wait for the bigger CRACK! to occur.
Despite how small it looks on the chart, the reality is that NVDA has lost 20% or 1/5 of its total value already.
There is only so much B.S. they can come out and say to pump the stock. Eventually, that dies off along with the stock.
Remember! Circular financing is flat-out illegal because it fabricates the appearance of real demand, real capital, or real creditworthiness when none actually exists. It’s the financial version of forging a signature. This administration has gutted the SEC, and no one will dare call it out for what it is in AI. But the markets will always correct for theivery in the end.
NVDA should never have gotten this high. But that is the beauty of Reflexivity. We should all be used to it by now.
Eventually, it will all come crashing down. I hope not with you in it. I urge caution to the bulls!
THANK YOU for getting me to 5,000 followers! 🙏🔥
Let’s keep climbing.
If you enjoy the work:
👉 Boost
👉 Follow
👉 Drop a solid comment
Let’s push it to 6,000 and keep building a community grounded in truth, not hype.

NVDA: Key Support at 116.94 and Long-Term Target at 258.33NVDA is attempting to stabilize after a corrective decline, trading just above an important Fibonacci retracement cluster. The broader structure remains constructive as long as price holds above the major support at 116.94, which represents a strong liquidity base and a key long-term demand zone.
A sustained reaction above the current region may open the way for a continuation of the broader bullish cycle. The next upside levels to monitor are:
217.73 (0.75 Fib extension)
242.09 (0.90 Fib extension)
258.33 (primary upside target)
These targets remain valid while the price maintains a higher-low structure.
Alternative Scenario
If the current rebound fails, NVDA may revisit the major support at 116.94. A reaction from this level would still align with the long-term bullish outlook and may serve as a stronger accumulation point before the next upward leg.
Conclusion
The trend remains upward-biased with 258.33 as the main projected target, provided that 116.94 continues to act as the dominant structural support.

NVDA vs. The Narrative: Why I’m Holding Through the NoiseWhile headlines scream "bubble" and Michael Burry loads up on short positions, I’m doubling down on what the charts are actually saying — not the fear-based narratives. This post is for those who trust price structure, volume psychology, and timeframe alignment over media noise. Let’s dive in.
Chart Structure Speaks Louder Than Opinions
Across all timeframes — from 4H to 6M — NVDA and the broader S&P are forming morning star dojis, a powerful reversal signal. These candles are whispering accumulation. Retail isn’t listening. Smart money already has.
Key Observations:
SPY & SPXL (S&P 500 ETFs): Forming higher lows with bullish fib retracements holding tight. No sign of weakness, despite Burry’s apocalyptic tone.
NVDA (NASDAQ):
The 6M chart shows clear magnet zones at 212 and 392.
An unfilled liquidity gap from the 390s is now acting as a gravitational pull — price will revisit it.
Every timeframe confirms this momentum is building for a breakout, not breakdown.
NVDA/USD Confluence: Mirrors the NVDA/NASDAQ structure almost 1:1. This correlation across instruments adds major conviction to the thesis.
Psychology Check: Why I Disagree with Michael Burry
Burry may be shorting because of macroeconomic risk. Or, maybe he’s playing the same game Melvin Capital did — betting retail will panic.
But I believe he’s underestimating the AI revolution, semiconductor demand, and the market’s memory of missed upside in prior decades.
The dot-com boom had hype, yes — but this has utility. AI isn’t a buzzword anymore. It’s infrastructure. And NVDA is at the core.
Liquidity will return. The market will wake up. And those who held the line will reap the rewards.
Final Words:
The media lies. Liquidity hides. But candlesticks don’t fake structure.
If NVDA fills its liquidity magnet, hits prior highs, or simply rides the S&P's tide — the upside is mathematically undeniable.
To those holding — congratulations.
To the bears — good luck.
To Burry — you might be early, but you might also be wrong.
- MoNí

Nvidia ($NVDA) Stock: $2B Synopsys Deal Expands AI Design PowerNvidia has taken another major step to secure its dominance in AI infrastructure by investing $2 billion in Synopsys, one of the world’s leading chip design software companies. The investment instantly makes Nvidia one of the top shareholders and deepens the long-term collaboration between the two firms. The deal strengthens Nvidia’s control over key parts of the AI value chain, from hardware to software tools used in designing new chips across multiple industries.
This partnership gives Synopsys access to Nvidia’s advanced developer tools and GPU-accelerated libraries to boost its electronic design automation (EDA) processes. These improvements aim to speed up chip development cycles at a time when demand for advanced AI hardware continues to surge. For Nvidia, the move ensures it stays positioned at the center of AI innovation and benefits financially from the growth of the entire ecosystem—not just from selling GPUs.
The timing also matters. Synopsys recently reported weakness in its intellectual property segment due to export restrictions tied to China and slower activity from a major foundry customer. Nvidia’s investment restores confidence in Synopsys' long-term outlook while offering Nvidia a strategic foothold in the tools that design the chips running global AI infrastructure.
Technical Analysis
Nvidia’s overall trend remains bullish despite a slight pullback. Price currently trades around $178, holding above a key support zone at $145, which becomes the level to watch if broader tech stocks weaken. Upside momentum resumes if price pushes toward the $212 resistance area—its previous major high. A confirmed breakout above $212 would signal continuation of the broader bullish structure.
With a strong fundamental catalyst and firm long-term trend, Nvidia remains one of the leading names powering AI’s next wave.
NVDA long-term TANvidia is still keeping up the long-term uptrend but the mid-term is currently in distribution since the last couple of weeks, so let the news won't surprise you, it's healthy for Nvidia to fall lower and that's what it been doing recently. Some time is needed for Nvidia to bottom out, while long-term remains bullish, the mid-term is yet bearish.

Nvidia likely to sell off throughout December 2025Nvidia has dominated 2025 with an exceptional upward trend, driven by relentless AI infrastructure demand. Recently, NVDA has finally broken below that steep up-channel — a signal that the stock may need a short-term cooldown before its next leg higher.
A retracement into the mid-$150 range would bring price back to a well-established support zone visible on the chart. This would represent a constructive pullback rather than a change in the long-term trend, especially heading into new product and AI-spending catalysts expected in early 2026.
For perspective: just three years ago, NASDAQ:NVDA was trading near $12 per share — a staggering +1,375% gain in only 36 months. Given that magnitude of appreciation, a modest pullback to $150 should be viewed as healthy consolidation rather than bearish pressure.

Forex Trading Options1. What Are Forex Options?
A forex option is a derivative contract whose value is derived from an underlying currency pair such as EUR/USD, GBP/INR, USD/JPY, or AUD/USD. The buyer of a forex option pays a premium to the seller (writer) in exchange for the right—not the obligation—to buy or sell the currency pair at a predefined price, known as the strike price.
Options help traders manage risk, hedge exposures, and take advantage of directional or non-directional forecasts about the forex market. Because global currencies constantly fluctuate due to interest rates, inflation, monetary policies, geopolitical factors, and macroeconomic data, options give traders flexibility and control over how much they stand to lose or gain.
2. Types of Forex Options
Forex options are broadly divided into two categories: vanilla options and exotic options.
a) Vanilla Options
These are the most basic and widely used options. They come in two forms:
Call Option
A call option gives the buyer the right to buy a currency pair at the strike price.
Example:
Buying a EUR/USD call at 1.0800 means you profit if EUR/USD rises above 1.0800 before expiry.
Put Option
A put option gives the buyer the right to sell a currency pair at the strike price.
Example:
Buying a USD/JPY put at 150.00 means you profit if USD/JPY falls below 150.00.
Vanilla options are straightforward and behave similarly to stock options.
b) Exotic Options
Exotic forex options are complex instruments tailored for advanced hedging or speculative plays. Popular types include:
Binary (digital) options – payoff is fixed if a condition is met.
Barrier options (knock-in, knock-out) – activate or deactivate based on price movement.
Asian options – payoff depends on average price over a period.
Chooser options – allow the holder to choose later whether it is a call or put.
These options are commonly used by institutions rather than retail traders.
3. How Forex Options Work
To understand how options work in forex, you need to understand a few essential terms.
a) Strike Price
The pre-agreed price at which the currency can be bought or sold.
b) Premium
The cost of buying the option. It is non-refundable.
c) Expiry Date
The date when the option contract ends.
d) In-the-Money (ITM)
Option currently has intrinsic value.
e) Out-of-the-Money (OTM)
Option has no intrinsic value and expires worthless unless price moves.
f) At-the-Money (ATM)
Spot price equals the strike price.
4. Option Pricing – What Determines Premium?
The price (premium) of an option is influenced by multiple factors:
1. Spot Price
The current market price of the currency pair.
2. Strike Price
The closeness of the strike to the spot affects intrinsic value.
3. Implied Volatility (IV)
Higher volatility = higher premium.
Forex markets with instability or news events have high IV.
4. Time to Expiry
More time = more premium, since more time means more opportunity for the trade to become profitable.
5. Interest Rate Differentials
Different national interest rates influence currency pair forward values and options pricing.
6. Market Liquidity
Major pairs like EUR/USD have cheaper, more liquid options compared to exotic pairs like USD/TRY.
These factors combine via pricing models like the Garman-Kohlhagen model (a modification of Black-Scholes for forex).
5. Why Traders Use Forex Options
Forex options provide unique advantages not available in spot trading.
1. Limited Risk
The worst-case scenario for option buyers is losing only the premium.
2. Unlimited Upside (for Call Buyers)
If the currency skyrockets, the trader profits significantly.
3. Hedging Tool
Businesses hedge currency risk using options to protect against exchange rate fluctuations.
Example:
An Indian importer expecting to buy goods in USD may buy a USD/INR call option to lock in cost.
4. Flexible Strategies
Options can be combined in creative ways to profit from trending, stagnant, or volatile markets.
5. No Mandatory Execution
If the market goes opposite, the trader can simply let the option expire.
6. Popular Forex Option Trading Strategies
1. Long Call
Expect the currency pair to rise.
2. Long Put
Expect the currency pair to fall.
3. Straddle
Buy both a call and a put at the same strike.
Used when expecting high volatility.
4. Strangle
Cheaper version of a straddle; strikes are wider apart.
5. Bull Call Spread
Buy one call and sell a higher strike call.
Used when expecting moderate upside.
6. Bear Put Spread
Buy put at higher strike, sell put at lower strike.
Used when expecting moderate downside.
7. Protective Put
Used by investors holding forex futures or large spot exposures.
8. Risk Reversal
Combine a long call and a short put to express directional views at lower cost.
Each strategy serves a different market scenario—trend, range, or high-volatility environment.
7. Forex Options vs. Spot Forex Trading
Feature Forex Options Spot Forex
Risk Limited to premium Unlimited (stop-loss needed)
Flexibility Very flexible Less flexible
Cost Requires premium No upfront cost
Profit Potential Unlimited (calls) High but risky
Expiry Yes No expiry
Complexity High Simple
Options are ideal when uncertainty is high, while spot forex is better for immediate price speculation.
8. Risks Involved in Forex Options Trading
Despite protections, options are not risk-free:
1. Time Decay (Theta)
Options lose value as expiration approaches.
2. Complex Pricing
Requires understanding volatility and Greeks.
3. Low Liquidity on Minor Pairs
Wider spreads = less efficient execution.
4. Premium Cost
High volatility = expensive options.
5. Seller’s Risk
Option sellers can face unlimited losses.
Therefore, beginners should focus on buying options rather than writing them.
9. Who Should Trade Forex Options?
Forex options are suitable for:
Intermediate to advanced traders
Businesses hedging currency exposure
Investors wanting limited risk
Traders expecting volatility spikes during events (Fed policy, inflation, elections)
Swing and positional traders who want controlled leverage
Beginners should start with vanilla calls and puts before experimenting with complex structures.
10. Conclusion
Forex options are powerful instruments that provide flexibility, leverage, and limited risk potential. By understanding the mechanics of calls and puts, pricing factors, strategies, and risks, traders can use options to hedge against uncertainties or speculate on currency movements with precision. While more complex than spot trading, forex options offer sophisticated possibilities—especially in volatile global markets driven by economic data, central bank policies, geopolitical events, and macroeconomic trends. With proper knowledge and disciplined strategy, forex options can significantly enhance a trader’s toolkit and open new avenues for profitable trading.
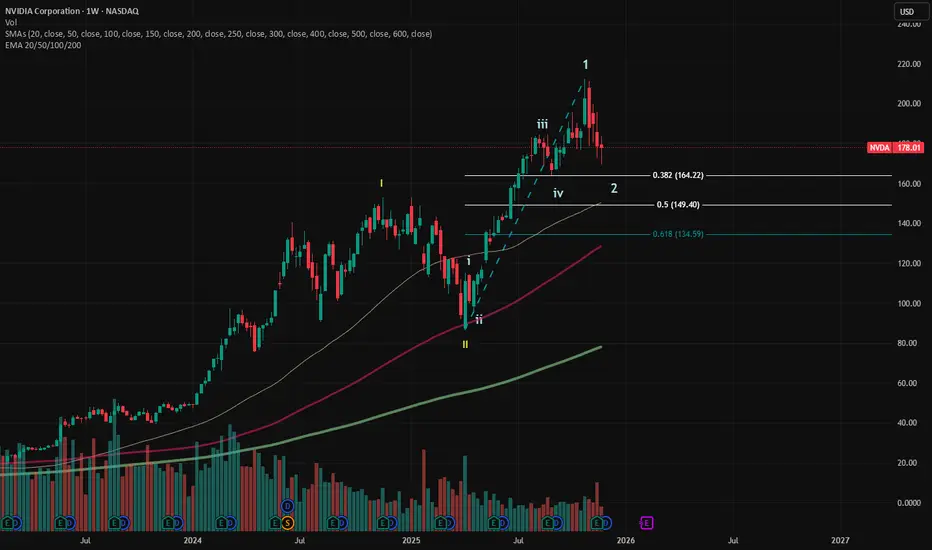
$NVDA: Wave 2 correction in placeNASDAQ:NVDA : I'm long term bullish on NVDA. I count the current weakness as a Wave 2 correction. Wave 2 can correct deeply. Presently, it has not corrected 38.2% yet.
I have a long term NVDA position that accounts for 2.7% of my portfolio. If it drops to 38.2% retracement area, I'll add. If not, I'm happy with holding my current position.
Currently, I'm 8% in cash.
Will Nvda crash the AI bubbleThis channel is not providing individualized trading or investment advice, nor is it a banking service, brokerage service, trading service, investment service or money management service

NVDA Put Alert | QuantSignals V3: Katy AI Predicts Short-Term
Signal Type: 1-Month Prediction (QuantSignals V3)
Date: 2025-11-26
Current Price: $180.19
Predicted Price: $177.34 (-1.58%)
30-Min Target: $178.91 (-0.71%)
Trend: Bearish
Confidence: 60.6%
Volatility: 16.7%
Trade Signal: PUT
Entry: $180.19
Target: $177.91
Stop Loss: $182.89
Expected Move: -1.58%
Analysis Summary:
Katy AI predicts a short-term downward trajectory.
Technical resistance near $182.89 acts as stop loss level.
Moderately high confidence (60.6%) indicates some caution is warranted.
Volatility at 16.7% suggests moderate price swings.
Key Notes:
No additional trade signals; single-symbol analysis.
Ideal for traders looking for short-term bearish exposure.