Nvidia Drill Down for Wave v of 5 of ( 1 ) CompletionIn the micro count, it appears we're in our wave iv with another low to come to complete. From there I am expecting one more high to complete this two-decade pattern.
NVD trade ideas

NVDA Seasonality - Flat to down for rest of year? NVDA has come back up to a resistance point and I feel that it is again over extended. Just like I did a few months ago, I opened a call credit spread way above the highs. The seasonality of NVDA is flat to down for the month of December. Thought the best way to play that would be a credit spread.

Starting Coverage on Nivida (NVDA)Starting with the big picture containing all the price action within Trading View charts.
Based on fib extension levels my long-term green labeled count is my primary. Purple is an alternative, but again, based on fib extensions levels it seems unlikely that purple is the optimal long-term count. Nonetheless, in either scenario, we should be entering a period of sustained downside that even in my alternative count will last years.
I will drill down into the daily and the micro patterns to get at a top for v of V of 5 of (1)

NVDA run into cloud resistance offer sell rallyNASDAQ:NVDA run into cloud resistance around $485 zone, rejection will be dire for bulls? Below $470 looks critical
sell rally: stop above $495 target $447

$NVDA S/R flipPrevious ATH on the daily is $480.88, on the 1H chart NVDA has tested this level as support twice in with price action that looks like a spring —> backtest of spring. Still exceeding expectations with earnings even if guidance wasn’t as bullish as people had hoped. Has obviously run up a lot but very strong uptrend and worth a go to get onboard the trend imo.

NVDA in correction sideways.NASDAQ:NVDA has gone through a great rise and we are currently entering a flat correction that should break further downwards given its increase since mid-October so we could see prices from $395 to $300 to see its correction completed.
I am more inclined to see NVDA between $300-$350 in the coming weeks since the moving averages have not yet given a clear sign of a deep correction, but of a lateralization for its distribution process providing the opportunity for trades within the ranges previously established and for the moment we would be entering in shorts for day traders.

nvidia to 1900 in the next bull runnon stop full speed ahead, its a bull flag! it happened for tesla and it may go sideways for quite sometime.. but this is a growth stock! goodluck!

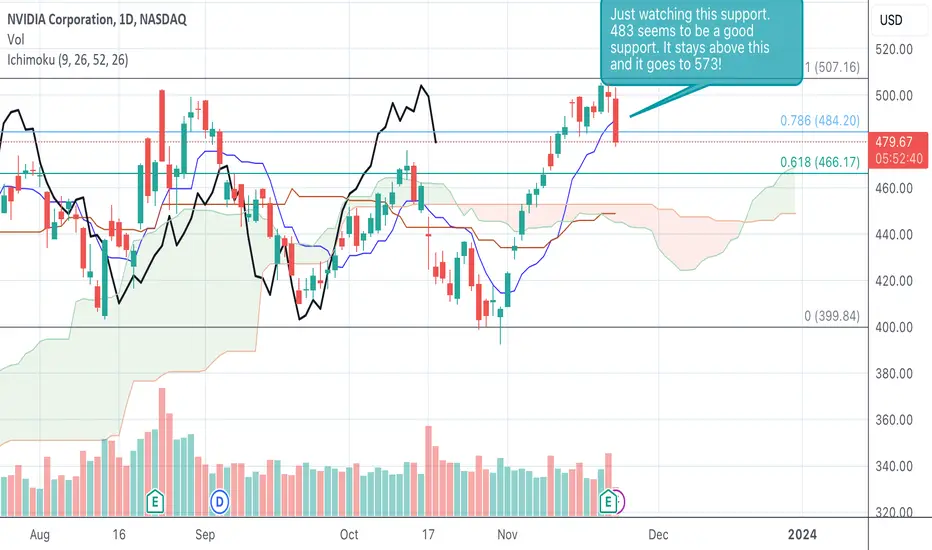
NVDA Pullback - Ichimoku Time Analysis
Long time viewer of ideas, first time posting. I am in no way an experienced expert in any sort of Technical Analysis, let alone Advanced Ichimoku theory, but have spent the last two years learning Advanced Ichimoku where I can. Have been practicing general TA for the past 5 years otherwise. Posting this idea is intended to be part of my educational journey, and I would love to hear any pointers/feedback/corrections/questions the community might have for me.
Brief Explanation before technical analysis:
This chart pairs Heiken-Ashi candles with Ichimoku Kinko Hyo Time Analysis. The timeframe is 1y/1d. I marked 8/24/23's high of $502.66 as the beginning of our analysis. You can see it is marked with a red "+" symbol above it.
I created an Ichimoku Analysis indicator in pinescript that:
a) plots additional "+" symbols to mark basic & complex numerical values cited by Kinko Hyo time analysis. These values are essentially predicted "turning" dates where volatility may cause a reversal or reinforce a trend.
b) calculates 4 targets based on prices of wave peaks + valleys.
Now on to why I think we're looking at a pullback.
Techical Analysis:
Price Action:
- Increased strength in downward movements since NVDA's big pop on 5/24/23, which was due to strong earnings. We are forming somewhat of a megaphone pattern. I have lightly highlighted these movements.
Trend Analysis:
Heiken-Ashi candles are great when it comes to visualizing trends. Pairing completed formation of one or more trend breaking candles with other supporting factors (MACD, volume, etc) greatly increases chance of timing reversals, or hopping in/out of existing trends. We have completed two trend breaking candles, and are looking at the potential development of a bearish MACD cross.
Ichimoku Analysis:
- Price breaking and closing below tenkansen + means we may retreat to the kijunsen line at the $448 mark. For confirmation I would like to see a candle both open and close below the kijunsen.
- The orange line below point C is the NT-Target calculated from Points A-C. Seeing that we never reached the NT-Target during this last move, I wouldn't be surprised if we saw NVDA reaching the $375 area in this next move. Friday the 24th was also a date where we can experience a reversal, as indicated by the blue "+" under Point D. Our next "turning" date is 12/20/23.
Speculation & Sentiment:
This is more of how I feel personally, and incredibly simplified. I think that NVDA continuing to report fantastic earnings is nothing surprising to the big money out there. I think big money has been sitting on some amazing gains over the last few months, and they are itching to lock those in. I think the fall on earnings was confirmation to big money that NVDA will continue to be a great investment for them to dump money into, and now that they have this confirmation it's time to find a better entry. By dropping the price, big money can dump more money in later to increase their holdings and, well, make even more money. Isn't that always the goal?
There's honestly so much more to address here, including positioning of the components of the ichimoku cloud, but I've already listed the parts of my technical analysis I feel is most important. I've been trading as a hobby for the past five years and have found that these aspects have worked best for me personally.
TL;DR: (my predictions)
1. "Tis but a flesh wound." We could fall down to and bounce off of the tenkansen (currently ~$448) and continue upwards to the E & V-Targets located at $540 - $560. This should be in motion if not complete by 12/20/23.
2. "Robert it go down." I think this is the most likely scenario. We fall to our NT-Target of ~$375 by 12/20/23. I think after this it is very likely big money starts adding some buy pressure, and we will revisit $500 soon(ish) after.

Has Nvidia finally topped?NVDA just put in a weekly bearish engulfing candle!
This is the first sing of a leading Mega Cap potentially seeing some distribution.
If this bell weather names keeps falling its going to turn the sentiment in the semiconductors slightly more bearish and will weigh in on the QQQ.

NVDA buy the dipwait to buy NASDAQ:NVDA on this corrective wave-c down at $360 with a stop loss at $300 target profit $780. 1:7 risk reward

Impressive results of Nvidia in Q3 2023Nvidia Corp. delivered an impressive financial report for Q3 2023. Net profit amounted to 9.24 billion USD, and revenue reached 18.12 billion USD. In comparison, last year's figures were 680 million USD and 5.93 billion USD, respectively. This increased performance is attributed to advancements in the company's data processing department, utilising chips with artificial intelligence.
Today, our focus is on the Nvidia Corp. (NASDAQ: NVDA) stock chart.
On the D1 timeframe, support at 487.16 was breached yesterday, 22 November, and the resistance moved to 505.48. The issuer's securities are currently decreasing in value after updating their historical maximum.
Nevertheless, the fair value of the stock, based on the P/S multiplier (the ratio of capitalisation to revenue), as outlined in Nvidia's latest quarterly report, may exceed 700 USD.
On the H1 timeframe, if quotes return to the previous support at 487.16, the medium-term target could be set at 550.45.
—
Ideas and other content presented on this page should not be considered as guidance for trading or an investment advice. RoboMarkets bears no responsibility for trading results based on trading opinions described in these analytical reviews.
The material presented and the information contained herein is for information purposes only and in no way should be considered as the provision of investment advice for the purposes of Investment Firms Law L. 87(I)/2017 of the Republic of Cyprus or any other form of personal advice or recommendation, which relates to certain types of transactions with certain types of financial instruments.
Risk Warning: CFDs are complex instruments and come with a high risk of losing money rapidly due to leverage. 67.85% of retail investor accounts lose money when trading CFDs with this provider. You should consider whether you understand how CFDs work and whether you can afford to take the high risk of losing your money.

NVDA Shares Decline after Strong ReportThe previous historical record and maximum for 2023 (USD 502.66 per share) was set on August 24 against the backdrop of the publication of the 2nd quarter report.
This week, NVidia published its report for the Q3, and again the price set a record high, as the report turned out to be better than expected:
→ earnings per share: actual = USD 4.02, forecast = USD 3.37;
→ gross revenue: actual = USD 18.12 billion, forecast = USD 16.18 billion.
However, after the publication of the report, the NVDA share price shows bearish dynamics — perhaps the information from the company disappointed overly optimistic investors. Or perhaps some market participants used the excitement associated with the publication of the report in order to lock in profits from the 2023 rally.
However, NVDA shares fell 2.6% yesterday after CFO Colette Kress said sales to China, impacted by recent US government export controls, would decline significantly in the fourth quarter.
Thus, the chart of NVDA shares develops a picture that may worry the bulls:
→ The price fell below USD 480 per share yesterday, despite the recently published good report.
→ The price is near the median line of the ascending channel, which describes the market dynamics starting from the gap on May 25 (excluding the second half of October). Moreover, the events of this week show that the median line acts as resistance.
If the price is able to hold above the USD 480 level, this could mean that the CFO's statement caused only a short-term correction, then a gradual increase along the median line would be a sign of a strong market. Otherwise, the price may continue to decline to the lower border of the channel, acting bearishly after the publication of a strong report — just like 3 months earlier.
This article represents the opinion of the Companies operating under the FXOpen brand only. It is not to be construed as an offer, solicitation, or recommendation with respect to products and services provided by the Companies operating under the FXOpen brand, nor is it to be considered financial advice.

Nvidia Is Still Bullish💸Hello Traders,
My name is Philip and I am just an average stock and indices trader with over 4 years of trading experience💻
-------------------------------------------------------------------
➡️In today's video, I will analyse Nvidia for you🫡
-------------------------------------------------------------------
➡️Let me know your opinion about today's analysis in the comments below👇
➡️I will only enter a trading position if ALL of my trading/entry criterias are met!
Keep your long term vision!
P.S. Trading is risky and most beginner traders lose money!

$NVDA - can it hang on?NASDAQ:NVDA Nvidia hit the prior high resistance, and it is still hanging onto the trendline despite the pullback.
It looks to be a brief pause before the next leap to $520. 👀

NVDA; The Natural Technical Short ApproachHey Traders,
Within the madness around NVDA you are seeing continuous bombardment of fundamental aspects.
It is true, the overall movement within in any stock on any exchange will always be moved by fundamentals, but there is a lot you can tell from price charts.
This is a technical approach to show you what you can do to save your butt.
Watch for more.

Update on $NVDA Daily. Updated support and targetThis is for my learning and storing it for eternity. Collaboration is a good idea and posting it for educational purpose only. Slow and Steady wins the race
NVIDIA is at balance. Here are my long/short scenariosWhen you trade the Model of the Medianlines/Pitchforks, you know now that price of NVDA is at balance.
Why?
It's at the Center-Line.
From here Chances for up or down are equal weighted
Details?
Well, price closed above the CL. This is bullish.
Price usually pull back to it.
Then it should continue to the other extreme, which is the Upper-Medianline-Parallel.
If it fails it's target and instead open and close below the CL, we have a short at hand.
OK, so how could we play either side?
LONG:
After the pullback to the CL, I watch for a upside continuation. I want price closing above a previous candle. Stop/Loss goes below the CL.
Profit target is the U-MLH.
SHORT:
After a open/close below the CL, I'm short immediately and my stop is above the highest Bar above the CL.
Profit target is the L-MLH.
Save trading4all

Nvidia to $550 by year end 2023Nvidia report yet again another amazing quarter. This stock goes to $550 by year end in my opinion, there is not a more obvious trade out there right now....

NVDA DEC 24Just looking at this being a possible channel. if it is, seems like a good time to get in.

A Deep Dive into NVIDIA's Financial SuccessNVIDIA , a leading player in the world of accelerated computing and artificial intelligence, has once again demonstrated its financial robustness and strategic foresight in the technology sector. The company's recent financial report for the third quarter ended October 29, 2023, reveals a remarkable growth trajectory, emphasizing NVIDIA's significant role in the evolving landscape of computing and AI.
Record-Breaking Financial Performance
NVIDIA's revenue for Q3 reached a staggering $18.12 billion, marking an impressive 206% increase from the same period last year and a 34% rise from the previous quarter. This growth trajectory is not just a testament to the company's innovative products and services but also reflects the increasing demand for advanced computing solutions across various industries.
The GAAP earnings per diluted share stood at $3.71, a more than twelve-fold increase from last year and a 50% increase from Q2. The Non-GAAP earnings per diluted share were even more striking at $4.02, showcasing nearly six times growth from the previous year and a 49% increase from the preceding quarter.
Data Center Dominance
A significant contributor to NVIDIA's success is its Data Center segment, which reported a record $14.51 billion in revenue. This figure represents a 41% increase from Q2 and an astounding 279% increase from the same period last year. The introduction of innovative products like NVIDIA HGX™ H200 with HBM3e memory and the integration of NVIDIA Spectrum-X™ Ethernet networking platform in servers from major tech companies like Dell Technologies and Hewlett Packard Enterprise have been pivotal in this growth.
The Generative AI Revolution
NVIDIA's CEO, Jensen Huang, attributes the company's robust growth to the broad industry transition from general-purpose to accelerated computing and generative AI. The company has positioned itself at the forefront of this revolution, offering comprehensive solutions like AI foundry services and NVIDIA AI Enterprise software. These offerings are rapidly being adopted by various sectors, including large language model startups, consumer internet companies, and global cloud service providers.
Future Outlook and Strategic Moves
Looking ahead, NVIDIA expects its Q4 revenue to be around $20.00 billion. The company continues to innovate and expand its product line, evident in its recent launches in the gaming sector and professional visualization. For instance, the introduction of DLSS 3.5 Ray Reconstruction for enhanced gaming experiences and the release of TensorRT-LLM™ for Windows reflect NVIDIA's commitment to staying ahead of technological advancements.
Diverse Growth Areas
Beyond data centers and gaming, NVIDIA has made significant strides in professional visualization and automotive sectors. The company's collaboration with Mercedes-Benz to use NVIDIA Omniverse for creating digital twins of manufacturing and assembly facilities exemplifies its influence in professional visualization. In the automotive sector, NVIDIA's partnership with Foxconn to develop next-generation electric vehicles underscores its strategic vision.
Conclusion:
NVIDIA's latest financial report is not just a display of numbers but a narrative of a company that is effectively navigating the rapid advancements in technology. With its continued focus on innovation and strategic partnerships, NVIDIA is not just achieving financial success but is also shaping the future of computing and AI. As the era of generative AI takes off, NVIDIA stands as a pivotal player, driving growth and innovation in a world increasingly reliant on advanced computing solutions.

SELL NVIDIA AFTER EARNINGS 350 TP Market sentiment Sell OFF
Sell Nvidia from 500 - 510
Stop Loss 550
all the way back to 450 TP - TP SELL OFF 350 FINAL
be patient until December 2023 - January 2024
CAFE CITY STUDIO
Put your Stop Loss Because thats your Insurance !!!

$NVDA Fib and Ichimoku Target Long $520 if stays above $500NASDAQ:NVDA Fib and Ichimoku Target Long $520 if stays above $500
Again this learning exercise as of 11/21/2023

NVDANVDA earnings today
I took previous all-time high to cyclical low distance and made an extension of equal size above, from previous all-time high, which gives us targets to upside
525 (ez imo)
580 bull case
