NVDA in BUY ZONEMy trading plan is very simple.
I buy or sell when at either of these events happen:
* Price tags the top or bottom of parallel channel zones
* Money flow volume spikes beyond it's Bollinger Bands
So...
Here's why I'm picking this symbol to do the thing.
Price in buying zone near bottom of channels
Money flow momentum is spiked negative and under bottom of Bollinger Band
Entry at $170
Target is moving average at $185
Looking to catch a quick bounce this week.
Will be buying as low as $167.
Set your own stop.
Trade ideas
11/25/25 - $NVDA - Norms gonna norm11/25/25 :: VROCKSTAR :: NASDAQ:NVDA
Norms gonna norm
- there are basically two things that you can own in this world
- AI and L1s (BTC and ETH)
- in AI landia, there's the king
- you own the kings
- "yuh but V google's making chips". yes. so does AMD... AVGO... MRVL...
- fade the norms. 25x PE for NVDA, laughably easy at this pt.
- higher.
V

NVDA Weekly CALL Alert: Bullish Momentum + Extreme Options FlowNVDA QuantSignals V3 Weekly 2025-11-25
Ticker: NVDA
Signal Type: Weekly Options Setup (Expiry: 2025‑11‑28)
Direction: BUY CALLS
Confidence: 65% (Medium conviction)
Strike Focus: $177.50
Entry Range: ~$2.55
Target 1: ~$4.08
Stop Loss: ~$1.53
Weekly Momentum: Neutral (+0.59% 1W)
Options Flow / PCR: Bullish (PCR ~0.37)
Risk Level: Moderate — trending strength plus overbought indicators
🧠 Key Technical & Chart Insights
According to TradingView’s technical ratings, NVDA is currently neutral, with short‑term signals mixed and the 1‑week rating showing a prevailing buy trend.
TradingView
On the chart:
Price is trading around ~$176.71 in your system, above a recent support at ~$174.05.
Weekly momentum is neutral but 2‑week trend is bullish (+2.91%), suggesting underlying upward drift.
RSI is elevated (~72.1) and strength regime ~94.4%, which suggests trend heredity but also risk of pullback.
Key resistance zone near ~$184.56, and support near ~$174.05.
From published trade ideas on TradingView:
NVDA has faced a major resistance around ~$183‑185 region; a breakout above that could propel price higher, while failures may lead to pullbacks toward ~$165‑$175 zone.
TradingView
+1
Fundamental metrics show strong valuation: price‑to‑sales ~27.05 and EV/EBITDA ~45.58.
TradingView
+1
News & flow context: Despite some caution in sentiment (concerns about overvaluation, AI regulatory risk), the options flow (low PCR) signals institutional bullish bets.
🎯 Trade Rationale
The combination of strong trending regime + bullish options flow offers an edge for an upside trade.
Entry at $177.50 allows participation in breakout potential toward ~$183‑184, aligning with your target ~$4.08 (roughly +60% return) if the move plays.
Stop at ~$1.53 (~40% loss) balances risk/reward given moderate confidence.
The trade is time‑limited (3‑day expiry) — so timing and volatility matter.
⚠️ Key Risks & Watchpoints
RSI overbought and technical structure near resistance means upside is not guaranteed and may be limited if breakout fails.
If NVDA fails to hold support near ~$174, downside risk increases — especially given prior resistance around ~$183‑185.
The 3‑day expiry means time decay and implied vol shifts will heavily impact option premium.
News or sector rotation (e.g., semiconductor weakness, AI regulation) could trigger sharp reversal.
The neutral weekly momentum suggests strength, but not overwhelming strength — cautious size is warranted.
NVDA buy zone NVDA has had some bearish news recently despite very strong earnings. I believe this was the extent of the pullback and the stock has reached a local weekly demand zone. Given the multi year strength I doubt it pulls back to 130-140 but anything is possible. If I enter the trade here I’d be net long.

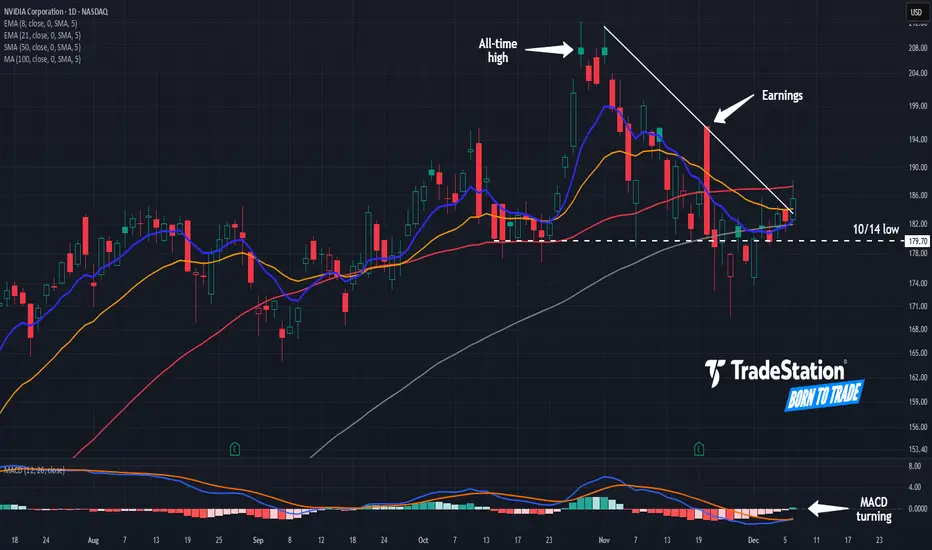
Is Nvidia’s Next Up Leg Coming?Nvidia has paused after a rally, and some traders may think the next up leg is coming.
The first pattern on today’s chart is the series of lower highs since November 3. The AI chip giant closed above that falling trendline yesterday, which could mean that the short-term resistance is fading.
Second is the failed rally on November 20 after earnings and revenue beat estimates. MACD was falling at the time, which prevented the shares from holding their gains. But now the oscillator has turned up, which may suggest that momentum has grown more favorable.
Third, prices have consolidated around their 50- and 100-day simple moving averages. That could reflect a bullish long-term trend.
Next, the 8-day exponential moving average (EMA) is rising toward the 21-day EMA. Crossing above may signal bullishness in the short term.
Finally, NVDA is a highly active underlier in the options market. (Its average daily volume of 3.6 million contracts ranks first in the S&P 500, according to TradeStation data.) That may help traders take positions with calls and puts.
TradeStation has, for decades, advanced the trading industry, providing access to stocks, options and futures. If you're born to trade, we could be for you. See our Overview for more.
Past performance, whether actual or indicated by historical tests of strategies, is no guarantee of future performance or success. There is a possibility that you may sustain a loss equal to or greater than your entire investment regardless of which asset class you trade (equities, options or futures); therefore, you should not invest or risk money that you cannot afford to lose. Online trading is not suitable for all investors. View the document titled Characteristics and Risks of Standardized Options at www.TradeStation.com . Before trading any asset class, customers must read the relevant risk disclosure statements on www.TradeStation.com . System access and trade placement and execution may be delayed or fail due to market volatility and volume, quote delays, system and software errors, Internet traffic, outages and other factors.
Securities and futures trading is offered to self-directed customers by TradeStation Securities, Inc., a broker-dealer registered with the Securities and Exchange Commission and a futures commission merchant licensed with the Commodity Futures Trading Commission). TradeStation Securities is a member of the Financial Industry Regulatory Authority, the National Futures Association, and a number of exchanges.
Options trading is not suitable for all investors. Your TradeStation Securities’ account application to trade options will be considered and approved or disapproved based on all relevant factors, including your trading experience. See www.TradeStation.com . Visit www.TradeStation.com for full details on the costs and fees associated with options.
Margin trading involves risks, and it is important that you fully understand those risks before trading on margin. The Margin Disclosure Statement outlines many of those risks, including that you can lose more funds than you deposit in your margin account; your brokerage firm can force the sale of securities in your account; your brokerage firm can sell your securities without contacting you; and you are not entitled to an extension of time on a margin call. Review the Margin Disclosure Statement at www.TradeStation.com .
TradeStation Securities, Inc. and TradeStation Technologies, Inc. are each wholly owned subsidiaries of TradeStation Group, Inc., both operating, and providing products and services, under the TradeStation brand and trademark. When applying for, or purchasing, accounts, subscriptions, products and services, it is important that you know which company you will be dealing with. Visit www.TradeStation.com for further important information explaining what this means.
Forex Trading Secrets1. Price Action Is the Real King (Not Indicators)
Most beginners clutter their charts with dozens of indicators hoping to find a perfect buy–sell formula. Professionals know the truth: price itself gives the most reliable information. Indicators lag because they represent past price data, not current market intent.
What professionals focus on:
Support and resistance zones
Market structure (higher highs, lower lows)
Liquidity levels (areas where stop-loss clusters exist)
Candlestick strength (rejection wicks, engulfing candles)
When a trader learns to read price action—how candles react to zones, how momentum builds or fades—they can trade profitably even with a clean chart. Indicators become secondary confirmation tools, not primary decision drivers.
2. Liquidity Is What Moves the Market
Here’s a hidden truth: forex markets move to fill liquidity, not because of random price swings. Big players like banks and institutional traders execute massive orders, and they need liquidity to fill those orders efficiently. That means:
Price hunts stop-loss clusters
Price sweeps highs and lows before reversing
Spikes occur to capture pending orders
This is why you often get stopped out right before the market moves in your favor. Understanding liquidity behavior gives traders a powerful edge.
Liquidity concepts include:
Stop hunts
Fake breakouts
Order block zones
Liquidity grabs
Smart traders expect these moves and position themselves accordingly.
3. The Trend Is Stronger Than Your Analysis
One of the biggest secrets is deceptively simple: Trading with the trend dramatically increases win probability. Many traders try to catch tops and bottoms, but institutional players rarely fight the trend—they ride it.
Characteristics of trend-following success:
Higher time-frame confirmation
Entering on pullbacks, not chasing
Using simple trend continuation patterns
Keeping trades open longer during strong trends
The trend holds more weight than any indicator or news event. Fighting the trend is one of the fastest ways to blow up an account.
4. Risk Management Is the Most Guarded Secret
Ask any long-term successful trader their biggest edge, and the answer won’t be a strategy—it will be risk management.
Key risk management secrets:
Never risk more than 1–2% per trade
Position sizing is more important than entries
A trader with moderate accuracy and strong risk rules often outperforms a trader with high accuracy but poor risk control
Understanding when not to trade is also a powerful risk strategy. Not trading low-quality setups protects your capital and mental energy.
5. Trading Psychology Outweighs Strategy
This is the hardest secret for beginners to accept: Your mindset determines your results more than your system.
The psychological traits professionals share:
Patience to wait for ideal setups
Discipline to follow rules consistently
Neutrality—no emotional attachment to wins or losses
Resilience after a losing streak
Confidence built on data, not hope
A trader can have the world’s best strategy, but fear, greed, revenge trading, and impulsiveness will destroy the account. This is why psychology books are more valuable than indicator tutorials.
6. Higher Time Frames Reduce Noise and Increase Accuracy
A hidden secret among consistently profitable traders is that they rely heavily on higher time frames like the daily or 4-hour.
Why higher time frames work:
Clearer market structure
Stronger trend visibility
Fewer false signals
Trades require less screen monitoring
Better risk-to-reward setups
Scalping looks attractive, but it magnifies emotions and often leads to over-trading. Higher time-frame trading reduces mental stress and increases consistency.
7. Fundamental Catalysts Drive Major Moves
Forex is deeply influenced by macroeconomic factors. Professionals use fundamentals to understand why the market is trending and where major volatility will occur.
Major catalysts include:
Central bank interest rate decisions
Inflation data (CPI, PCE)
Employment data (NFP, unemployment rates)
GDP figures
Geopolitical events
Fiscal policies
Ignoring fundamentals means ignoring the very forces that create trends.
But the secret is: You don’t need to be an economist—just know when news is happening and how it affects risk.
8. Smart Money Concept (SMC) Edge
Institutional-style concepts, once hidden from retail traders, are now increasingly discussed. These include:
Order blocks
Fair value gaps (FVG)
Market structure shifts (MSS)
Imbalance zones
Buy-side and sell-side liquidity
These concepts explain how institutions accumulate and distribute positions. Traders who master SMC often experience a major breakthrough in accuracy.
9. Consistency Beats Intensity
This secret is rarely acknowledged.
Successful traders:
Follow a structured routine
Practice the same strategy repeatedly
Keep a trading journal
Backtest regularly
Set trading sessions and stick to them
Failure in forex often comes from randomness—random indicators, random entries, random time frames. Success comes from consistency, not constant experimentation.
10. Forex Is a Business, Not Gambling
Treating forex like a business means:
Maintaining a trading plan
Logging trades
Tracking performance metrics
Identifying weak areas
Improving process instead of chasing profits
Traders who approach forex like gambling lose money. Traders who approach it like a business grow gradually and sustainably.
Conclusion: The “Secrets” Are Not Hidden—They Are Underrated
The real secrets of forex trading are not magic formulas or mysterious tools. They are principles that professionals use every day but beginners often overlook in search of shortcuts.
To summarize:
Price action matters most
Liquidity drives the market
Trend-following improves probability
Risk management is the true edge
Psychology determines consistency
Higher time frames simplify trading
Fundamentals guide long-term trends
SMC offers an advanced structural view
Consistency builds mastery
Treating trading as a business ensures longevity
Mastering these secrets takes time, discipline, and patience. But once internalized, they form the foundation of sustainable forex success.
Case Studies of High-Growth Emerging EconomiesIntroduction
Emerging economies play a pivotal role in shaping global economic dynamics. Characterized by rapid industrialization, increasing integration into global markets, and significant socio-economic transformation, these countries often exhibit higher growth rates compared to developed economies. Understanding their trajectories offers critical insights into developmental strategies, policy formulation, and investment opportunities. This case study analysis focuses on select high-growth emerging economies, examining the factors that fueled their rise, challenges they faced, and lessons that can inform other countries.
1. China: The Manufacturing Giant
Economic Transformation:
China’s growth story is one of the most studied among emerging economies. Since the late 1970s, China transitioned from a centrally planned economy to a market-oriented one. Reforms, such as the establishment of Special Economic Zones (SEZs) and liberalization of trade, catalyzed manufacturing and exports, positioning China as the “world’s factory.”
Key Growth Drivers:
Export-Led Growth: China leveraged low-cost labor and improved infrastructure to dominate global manufacturing.
Investment in Infrastructure: Massive investments in roads, ports, and energy supported industrial expansion.
Technology Adoption: China strategically invested in technology transfer, innovation, and R&D, gradually moving from low-end manufacturing to high-tech industries.
Challenges:
Environmental degradation due to rapid industrialization.
Rising labor costs leading to the relocation of manufacturing to other emerging markets.
Increasing reliance on debt-financed infrastructure projects.
Lessons Learned:
China’s model illustrates the effectiveness of phased liberalization, export-driven strategies, and strategic government intervention in catalyzing rapid growth.
2. India: Services-Led Growth
Economic Transformation:
India represents a contrasting high-growth model driven predominantly by services rather than manufacturing. Since economic liberalization in 1991, India’s GDP has grown steadily, propelled by information technology (IT), software services, and business process outsourcing (BPO).
Key Growth Drivers:
Human Capital: A large, young, and English-speaking workforce facilitated the IT and services boom.
Policy Reforms: Liberalization, privatization, and deregulation attracted foreign investments and promoted entrepreneurship.
Global Integration: India leveraged globalization to become a hub for IT exports, serving international markets.
Challenges:
Infrastructure bottlenecks, particularly in transport and energy, limit manufacturing growth.
Income inequality and regional disparities pose social and political challenges.
Dependence on global demand for IT services makes the economy vulnerable to international shocks.
Lessons Learned:
India’s case underscores the potential of services-led growth and the importance of investing in human capital and digital infrastructure.
3. Vietnam: Export-Oriented Manufacturing
Economic Transformation:
Vietnam’s growth trajectory has been remarkable, with GDP expanding rapidly over the past two decades. Economic reforms under Đổi Mới in 1986 shifted Vietnam from a centrally planned to a market-oriented economy, stimulating private enterprise, foreign investment, and export-led manufacturing.
Key Growth Drivers:
Foreign Direct Investment (FDI): Incentives and trade agreements attracted global manufacturers in electronics, textiles, and footwear.
Competitive Labor Costs: Vietnam’s young workforce and low wages made it a preferred alternative to China for global supply chains.
Trade Liberalization: Membership in the World Trade Organization (WTO) and bilateral trade deals integrated Vietnam into global markets.
Challenges:
Overreliance on FDI and exports exposes the economy to external shocks.
Environmental concerns due to industrialization and urban expansion.
Need for skilled labor and innovation to move up the value chain.
Lessons Learned:
Vietnam highlights the effectiveness of combining market reforms with targeted FDI policies to achieve rapid industrial growth.
4. Ethiopia: Agriculture and Industrial Parks
Economic Transformation:
Ethiopia’s growth story differs from East Asian models, as it relies heavily on agriculture and government-led industrialization. Over the past decade, Ethiopia has been one of Africa’s fastest-growing economies, with infrastructure projects and industrial parks driving development.
Key Growth Drivers:
Agricultural Reforms: Modernizing agriculture through irrigation, mechanization, and value-chain development.
Industrial Parks: Establishment of textile and garment industrial parks attracted foreign investment.
Infrastructure Development: Roads, energy projects, and telecom expansion improved productivity and connectivity.
Challenges:
Political instability and regional conflicts have hampered sustained growth.
Heavy reliance on donor funding and external loans poses debt sustainability risks.
Climate vulnerability affects agricultural output.
Lessons Learned:
Ethiopia demonstrates how strategic public investment in infrastructure and industrial policy can drive growth, even in low-income economies, but highlights the importance of political stability.
5. Brazil: Resource-Led Growth and Diversification
Economic Transformation:
Brazil’s growth has been fueled by abundant natural resources, agricultural exports, and a diversified industrial base. The country emerged as a key player in commodities such as soybeans, iron ore, and oil.
Key Growth Drivers:
Natural Resources: Exploitation of oil, minerals, and agricultural commodities drove export revenues.
Social Programs: Initiatives like Bolsa Família improved human development indicators, supporting domestic consumption.
Industrial Diversification: Investment in automotive, aerospace, and manufacturing sectors reduced dependency on raw materials.
Challenges:
Volatile commodity prices exposed the economy to global shocks.
Political corruption and policy inconsistency hindered long-term growth.
Structural inequality and inflationary pressures remained persistent challenges.
Lessons Learned:
Brazil’s experience underscores the importance of diversifying growth drivers and managing the resource curse through effective policies.
Comparative Analysis
Across these case studies, several common patterns emerge:
Policy Reforms Matter: Successful emerging economies implemented liberalization, trade openness, and regulatory reforms to attract investment.
Human Capital is Key: Education, skill development, and labor force quality are crucial for sustaining growth.
Infrastructure Investment: Physical and digital infrastructure accelerates industrialization and trade integration.
Global Integration: Leveraging globalization through exports and FDI is a consistent growth enabler.
Challenges Remain: Environmental sustainability, inequality, and political stability are recurring constraints that need continuous attention.
While the paths differ—China’s manufacturing-led growth, India’s service-led expansion, Vietnam’s FDI-driven industrialization, Ethiopia’s public-sector infrastructure model, and Brazil’s resource-led diversification—they all highlight that a combination of strategic policies, investments in human and physical capital, and integration into global markets drives high growth.
Conclusion
High-growth emerging economies offer valuable lessons in economic transformation. Their experiences demonstrate that while growth strategies can differ based on comparative advantages, consistent factors such as policy reforms, human capital development, infrastructure investment, and global engagement are universally critical. However, challenges such as inequality, environmental sustainability, and political stability must be addressed to ensure long-term, inclusive growth.
Understanding these cases equips policymakers, investors, and scholars with insights on how emerging economies can navigate the complexities of globalization, industrialization, and socio-economic development, while providing a roadmap for other developing nations aspiring for rapid and sustainable growth.

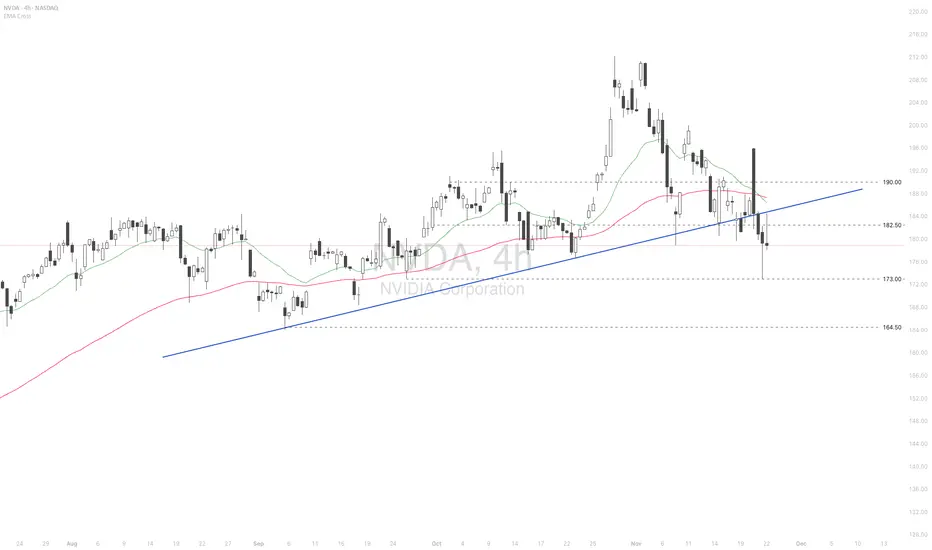
Nvidia plummeted amid the threat of competition from GOOGL
Optimism surrounding the Gemini 3 and news that Alphabet (GOOGL) will internally supply its TPUs to Meta Platforms (META) supported the AI rally. On the other hand, Nvidia (NVDA) experienced a significant decline due to concerns over the potential GOOGL threat.
Mizuho noted that the "Google wins, OpenAI/Nvidia loses" trade is gaining traction, accelerating the sell-off in OpenAI-related stocks like NVDA and Oracle (ORCL).
Meanwhile, the US administration's decision regarding the allowance of NVDA's H200 chip sales to China remains a potential positive catalyst for future NVDA stock prices.
NVDA briefly fell below the support at 173.00 after breaking below the ascending trendline. Diverging bearish EMAs indicate a potential extension of the downtrend.
If NVDA breaks below 173.00 again, the price could further decline to the next support at 164.50.
Conversely, if NVDA closes above 182.50, the price may advance toward the following resistance at 190.00.

NVDA – Inventory Panic or Blackwell Positioning?Nvidia just became the center of another “AI bubble” debate after headlines highlighted a 32% Q/Q inventory increase. The surface-level take was bearish, but the clarification from management changed the context. According to today’s memo, the buildup is preemptive staging for the Blackwell platform, not a sign of weakening demand. These units are tied to presold systems, meaning this is logistics positioning, not channel stuffing.
On the tape, the story is more technical than fundamental. Heavy insider selling (CEO/CFO), hedge fund trimming, and SoftBank pressure all created the sell-side imbalance we’ve been seeing for weeks. But despite those headwinds, the chart continues to defend major support zones.
Key Observations:
• 177–178 acted as the first demand pocket, aligning with trend support and prior volume nodes.
• Price continues trading within a controlled downtrend, but each flush is producing diminishing downside extension—a sign of seller exhaustion.
• The real liquidity magnets remain below:
– 172.93
– 170.69
– 164.01 (golden support if the market unwinds further)
The bearish narrative points to elevated inventories and institutional unloading. The bullish narrative focuses on Blackwell staging and enterprise AI demand still being early-cycle. Both can be true at once. That’s why the environment favors high-probability scalps, not oversized directional bets.
My Read: This is a volatility market. NVDA is still in discovery mode, and both sides will get opportunities. Until NVDA reclaims 182.55, sellers maintain short-term control. A break below 172.93 opens a path into the 170/169s where real buyers should step in.
This isn’t about predicting a hero reversal—it's about respecting levels and trading the reaction.
📌 PROFIT TARGETS & STOP ZONES (Required by TV)
Upside Targets:
• 182.55 (first resistance)
• 186.20 (gap fill supply zone)
• 190.17–191.05 (major distribution shelf)
Downside Targets:
• 172.93
• 170.69
• 164.01 (golden support)
Invalidation / Stop Zone:
• Close above 186.50 invalidates the short-term bearish drift.
• Close below 170 invalidates the shallow bounce thesis and opens deeper liquidity.

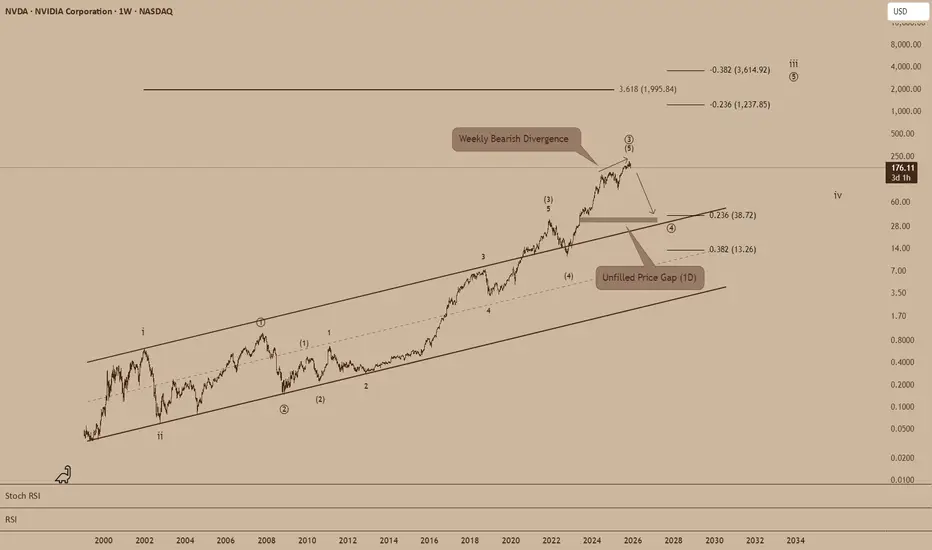
Nvidia’s Momentum Faces Its First TestFor much of the past decade, Nvidia has stood at the centre of a profound technological shift. Its chips underpin the modern artificial-intelligence ecosystem, and the company has become one of the most influential constituents of global equity markets. Yet after an extraordinary run, a combination of technical signals and slowing market dynamics suggests the stock may be approaching a period of consolidation.
Long-term price analysis shows Nvidia’s shares have risen within a broad upward channel since the early 2000s, a structure that has guided each major expansion and subsequent correction. The most recent advance fuelled by unprecedented demand for AI-related hardware has carried the stock to the upper edge of this decades-long formation.
A Mature Price Structure Meets Waning Momentum
Technical readings indicate the current rally may be nearing exhaustion. The share price has formed a completed five-wave structure at the upper boundary of its long-term channel, accompanied by a notable bearish divergence on weekly momentum indicators. Such developments are typically associated with the late stages of a major trend.
If this marks the completion of a long-running impulsive phase, the stock may be entering a corrective chapter. The first substantial support appears near $38, aligning with earlier congestion zones and a shallow retracement level. A deeper drawdown could expose the gap left by previous trading and a secondary support area closer to $13, where the lower channel boundary intersects longer-term Fibonacci projections.
This would be consistent with the type of multi-quarter pause usually seen between major structural waves in extended growth cycles.
Underlying Strength, but With Signs of Normalisation
Despite these technical signals, Nvidia’s business remains fundamentally strong. Demand for AI accelerators continues to drive high revenue and margin levels, and the company retains a dominant position in the market for large-scale compute.
However, several trends suggest that the exceptional conditions of recent years are beginning to moderate.
Valuations and Expectations
Nvidia trades at valuations well above its historical norms. Consensus estimates still point to healthy growth, but some analysts question whether current multiples fully account for the natural deceleration that follows rapid capacity build-outs among cloud providers.
A More Balanced AI Investment Environment
The initial wave of infrastructure spending by hyperscale operators has eased, shifting from aggressive expansion towards more measured investment cycles. While the long-term trajectory for AI remains constructive, the sector’s near-term capital intensity appears to be flattening.
Emerging Competitive Pressures
Rivals such as AMD are gaining traction in certain segments, while large technology companies continue developing internal AI chips to reduce dependence on external suppliers. Nvidia’s leadership remains intact, though the competitive field is broadening.
Policy and Regulatory Considerations
Export restrictions on high-performance semiconductors and heightened regulatory attention in the US have added another layer of uncertainty. These challenges are not existential, but they contribute to a more complex environment than the one that propelled the company’s recent surge.
A Period of Rebalancing Rather Than Reversal
Taken together, the technical and fundamental perspectives point to a market that may be re-evaluating the pace, not the direction of Nvidia’s long-term story. The company remains one of the key beneficiaries of the AI era, but the alignment of slowing momentum, stretched valuations and maturing investment cycles suggests that the share price may face a period of consolidation.
For investors with a longer horizon, such an adjustment could eventually offer an attractive entry point. For now, the signals imply that Nvidia’s next phase may be characterised less by acceleration and more by moderation.
$NVDA Structure keeps improving for a move lower.Just added to my NASDAQ:NVDA short.
Structure keeps improving for a move lower.
And the competitive pressure is real:
NASDAQ:GOOGL ’sTPU stack is becoming a legitimate alternative to Nvidia for training/inference.
Why Structure Beats Prediction|The Core Philosophy of UIA **Why Structure Beats Prediction|The Core Philosophy of UIA
(英文为主・中文为辅)**
Most traders try to predict market direction.
But prediction is unreliable, emotional, and impossible to repeat.
At UIA Institute, our core belief is simple:
Markets cannot be predicted.
But structure can always be read.
(中文:市场无法预测,但结构可以被读取——这是 UIA 方法论的核心。)
🔵 1. Why prediction fails(预测为何不可靠)
Prediction depends on assumptions, and assumptions fail because:
Liquidity shifts without warning
Macro events disrupt trends instantly
Reversals never send a notification
Emotions distort expectations
Every prediction increases the gap between “what we think” and “what the market actually does.”
(中文总结:预测依赖假设,而假设越多,错误越多。)
🔵 2. Why structure works(结构为何可靠)
Structure is built from facts, not guesses.
Price → Volume → Reaction → Rhythm
These reflect what has already happened, and therefore can be read objectively.
Structure tells us:
T — When a trend starts
E — Whether the trend is extending healthily
H — Where key swing points form
X — When the trend is exhausted and ending
(中文:结构来自“市场已经发生的事实”,因此可被辨识、可被重复。)
🔵 3. Reacting beats predicting(反应比预测更强)
The UIA methodology is designed around one principle:
Don’t predict the future.
React to the structure.
Reacting means:
You act on confirmed information
You avoid emotional bias
You stay synchronized with real market rhythm
You reduce unnecessary trades
This dramatically improves consistency and longevity.
(中文:UIA 做的是“结构出现后再反应”,成功率高得多。)
🔵 **4. Structure is the only repeatable edge
(结构是唯一可重复的优势)**
Indicators change.
News changes.
Sentiment changes.
But structure is timeless.
Price will always move in rhythms of:
Expansion
Pullback
Continuation
Exhaustion
Reversal
This universal rhythm is why UIA focuses exclusively on structural reading.
(中文:结构具有可重复性,是任何市场、任何周期都适用的通用语言。)
🔵 5. Conclusion(总结)
Prediction creates stress.
Structure creates clarity.
Structure allows traders to understand:
What the market is doing now
When to participate
When to exit
When to stop
When to observe
When to wait
This is the foundation of the UIA Trend Engine, Wave Engine, and TSX Engine.
(中文:结构让交易回到“可控、可读、可执行”的节奏。)

UIA Lite – Trend Structure Preview Release|Full Explanation of T⭐ UIA Lite – Trend Structure Preview Release|Full Explanation of T / E / H / X (Free Preview)
Hello everyone, this is UIA Institute.
We focus on developing clean, systematic, and repeatable market structure tools based on pure price action.
Today, we are releasing the UIA Lite – Trend Engine (Free Preview).
This preview showcases the four core structural events used in the UIA Trend Engine.
These four events form the “structural backbone” of a trend.
🔵 The Four UIA Structural Events (T / E / H / X)
T — Trend Start
Marks the beginning of a trend.
Price transitions from consolidation into a directional move.
E — Trend Extension
Confirms that the trend is healthy and continuing.
Often appears after a controlled pullback or continuation pattern.
H — Structural High / Low
Key swing points formed during the trend.
These are commonly used for scaling out or tightening risk.
X — Trend Exit / Reversal
Indicates that the trend has completed and the market may shift into
either sideways consolidation or a reversal phase.
These four events together define the life cycle of a trend.
🔵 What’s included in the Free Preview
To help more traders understand UIA’s structure-based methodology,
this Preview version focuses on:
Clean labeling of T / E / H / X
Minimal parameters
No prediction, no signals
100% price-action-based logic
Simple, transparent structural rules
The full version of UIA Lite will include additional filters,
higher-precision logic, and more stable structural mapping.
🔵 UIA Lite – Free Preview indicator link:
👉
Feel free to add it to your chart and experiment with it.
🔵 About UIA Institute
We are developing a complete structural analysis framework:
UIA Trend Engine (Trend Structure)
UIA Wave Engine (Swing Structure)
UIA TSX Engine (Early-Structure Signals)
Our philosophy is simple:
No prediction, no emotional trading, no over-indicator setups.
Only structure, rhythm, and repeatability.
**We welcome English-speaking users to join the discussion.
More UIA content will be released soon.**
Are Derivatives Powerful in the Global Trade Market?1. What Are Derivatives?
A derivative is a financial contract whose value is derived from an underlying asset. This asset could be:
Commodities like crude oil, gold, wheat, natural gas
Currencies such as USD, EUR, JPY
Equity indices like Nifty 50, S&P 500
Interest rates such as LIBOR or government bond yields
Credit instruments like corporate bonds
The most common derivatives include:
Futures
Options
Swaps
Forward contracts
In the global trade market, derivatives’ primary purpose is risk transfer, although they are also used for speculation and arbitrage.
2. The Global Influence of Derivatives
Risk Management Backbone of Global Trade
Global trade is full of uncertainties—currency fluctuations, commodity price volatility, geopolitical tensions, supply chain disruptions, and interest rate changes. Derivatives serve as insurance-like tools that allow participants to lock in future prices, hedge risks, or stabilize cash flows.
For example:
An airline company hedges jet fuel futures to protect against rising crude prices.
An importer hedges currency risk using forex forwards to avoid losses if the dollar rises.
Exporters use options to protect against weakening foreign currencies.
Without derivatives, global trade would be significantly more dangerous and unpredictable.
3. Derivatives and Commodity Markets
Commodity derivatives such as oil futures, agricultural futures, and metal contracts are essential in global trade.
Why are commodity derivatives powerful?
Price Discovery
Derivatives markets reflect real-time global supply and demand conditions. Oil prices, for example, are heavily influenced by futures traded on major exchanges.
Stabilizing Prices for Producers and Consumers
Farmers hedge crop prices to secure income; manufacturers lock in raw material prices to control costs.
Enhancing Global Trade Flows
Multinational companies plan procurement and distribution based on futures price signals.
Reducing Market Manipulation
Transparent derivative markets help in curbing cartel behavior and monopolistic pricing.
Thus, commodity derivatives are one of the strongest tools that keep global trade systems efficient and predictable.
4. Currency Derivatives – The Engine of Cross-Border Commerce
In global trade, currency fluctuations can make or break profitability. A stable currency environment is a dream, but not the reality. Hence, forex derivatives are widely used.
How currency derivatives empower global trade?
Hedging exchange rate risks
Importers/exporters use forwards, futures, and options to secure exchange rates.
Supporting multinational operations
Corporations manage exposure across dozens of currencies simultaneously.
Providing liquidity to global markets
Forex derivatives markets are the largest in the world, with trillions traded daily.
Enhancing financial stability
Countries with export-driven economies rely on currency derivatives to prevent economic shocks.
Currency derivatives act as the hidden shield that protects companies and nations from unpredictable foreign exchange swings.
5. Interest Rate Derivatives – The Heart of Financial Stability
Because interest rates influence the cost of borrowing globally, interest rate swaps and futures form the backbone of global financial markets.
Their key powers include:
Helping governments manage debt.
Allowing banks to hedge interest rate exposure.
Enabling corporations to stabilize borrowing costs.
Ensuring smoother global credit flow.
Without interest rate derivatives, global financing would be far riskier, costlier, and more unstable.
6. Derivatives as Speculative and Profit-Making Instruments
While derivatives are risk-management tools, their power also comes from:
Speculation
Traders take positions on future market movements to earn profits. This:
Increases market liquidity
Enhances price discovery
Draws global capital into trade markets
However, speculation can also increase volatility if unchecked.
Arbitrage Opportunities
Derivatives allow traders to exploit price differences in different markets:
Spot vs futures
Domestic vs international exchanges
Currency arbitrage
Commodity pricing discrepancies
Arbitrage ensures that global markets remain efficient and interconnected.
7. How Derivatives Strengthen Global Market Efficiency
Derivatives contribute to global trade in several powerful ways:
A. Increased Liquidity
Markets with high liquidity:
Reduce transaction costs
Facilitate smoother trade
Attract global investors
Improve pricing accuracy
Derivative markets like CME, ICE, NSE, LME, and SGX provide massive liquidity to commodities, currencies, and equities.
B. Better Price Stability
Derivatives reduce sharp price swings, especially in commodities and currencies. This is essential for long-term contracts and procurement.
C. Improved Risk Sharing
Derivatives distribute risks across participants:
Hedgers transfer risk
Speculators accept risk
Arbitrageurs eliminate inefficiencies
This creates a smooth ecosystem for global trade.
D. Facilitation of Global Investments
Investors use derivatives to:
Hedge portfolio risks
Gain exposure to foreign markets
Manage geopolitical risks
This flow of capital boosts global trade volumes.
8. Challenges and Risks of Derivatives
Even though derivatives are powerful, they also have downsides:
1. High leverage risk
Small price movements can cause large profits or losses.
2. Systemic risk
Excessive derivatives trading contributed to crises such as:
2008 Global Financial Crisis
LTCM collapse
Oil futures flash crashes
3. Complexity
Sophisticated instruments like credit default swaps (CDS) are difficult to understand.
4. Counterparty risk
Failure of one party can create a chain reaction.
Despite these risks, regulatory reforms and clearinghouses have made derivative markets safer and more transparent.
9. The Future of Derivatives in Global Trade
Derivatives are becoming more powerful due to:
Digital platforms and electronic trading
AI-driven risk models
Expansion of global markets (India, China, ASEAN)
Growth in commodity and currency volatility
Rise of ESG and carbon credit derivatives
The next decade will see derivatives become even more integrated with global supply chains, energy markets, and financial systems.
Conclusion
Yes, derivatives are extremely powerful in the global trade market. They are not merely financial instruments but essential tools that support world commerce by:
Managing risks
Stabilizing prices
Enhancing liquidity
Improving efficiency
Supporting international investments
Strengthening financial stability
From farmers to oil companies, from banks to governments, derivatives underpin decisions and strategies across the global trade ecosystem. Without them, global markets would be less predictable, less efficient, and far more vulnerable to shocks.
NVDA at a Critical Breakdown. Bounce Coming or Flush to $175NVDA at a Critical Breakdown Zone – Bounce Coming or Full Flush Below $175? 🔥
Weekly Trend (Big Picture)
NVDA’s weekly chart just did something important:
✅ Broke below the long-term rising structure
✅ First real weekly lower high since the major uptrend started
✅ Strong selling wick at the top
This shift tells us momentum is no longer purely bullish. Buyers lost control near $220–$230, and the weekly now leans corrective, not trending.
Key weekly support: $176–$180
This is where the prior trendline, demand, and volume cluster meet.
If NVDA loses this zone on a weekly close → the next major weekly demand isn’t until $160–$165.
Daily Structure
The daily makes the story even clearer:
* Multiple CHoCH signals (trend weakness)
* Failed continuation after breakout attempt
* Price rejecting the daily bearish order block around $198–$205
* Holding inside a large daily demand zone $175–$182
This is the final defense for bulls.
As long as NVDA holds $176–$180 on the daily, we can see:
➡️ Relief bounce toward $187–$192
➡️ Possibly $198 retest
But if $176 breaks…
➡️ Daily breakdown
➡️ Clean air to $165
➡️ Fast move likely
1-Hour View (Trader Timing)
The 1H structure is currently:
* Downtrend channel
* Lower highs
* Multiple failed bounces
* Buyers defending the green demand block $177–$182
Short-term, this is range to down, but oversold enough for intraday bounces.
Best actionable levels:
✅ Long scalp only if price holds above $180 → target $184–$187
❌ Avoid longs below $179
📉 If $176 breaks → expect momentum selling toward $170–$165
GEX (Options Positioning Signal)
This is the key confluence.
GEX shows:
🔴 PUT dominance
🔴 Highest negative exposure at $175
🟥 Strong PUT support wall below $175
🟢 Light CALL interest above $188–$195
What this means:
Institutions are positioned for downside or pinning around $175–$180.
If price cracks $175, dealers flip into accelerated selling → this is where the flush to $165 can trigger quickly.
If price holds above $180 and pushes toward $187+, GEX shifts to neutral and a bounce can develop.
My Thoughts
NVDA is the opposite of AAPL and GOOGL right now.
Those are pushing highs with momentum.
NVDA is:
* Weakest of the big names
* Losing trend structure
* Sitting on final support
* Option flow leaning bearish
This usually leads to:
🔥 Either a violent bounce
🔥 Or a breakdown flush
No middle.
Direction Summary
Bullish scenario:
Hold $180 → push into $187–$192
Bearish scenario (higher probability if $176 breaks):
Break $176 → unwind to $165 fast
Disclaimer:
This analysis is for educational purposes only and does not constitute financial advice. Always do your own research and manage your risk before trading.

NVDA Katy AI Analysis – Neutral, Monitor for BreakoutNVDA QuantSignals Katy 1M Prediction – 2025-11-24
Current Price: $179.09
Final Prediction: $179.64 (+0.30%)
30-min Target: $179.46 (+0.20%)
Trend: NEUTRAL
Confidence: 55%
Volatility: 13.3%
⚠️ Trade Signal:
No trade generated – insufficient confidence and move size
🧠 Analysis Summary:
Katy AI shows minor upside but not enough for actionable entry
Low expected movement implies limited risk/reward opportunity
Traders may monitor for upcoming catalysts or volatility spikes

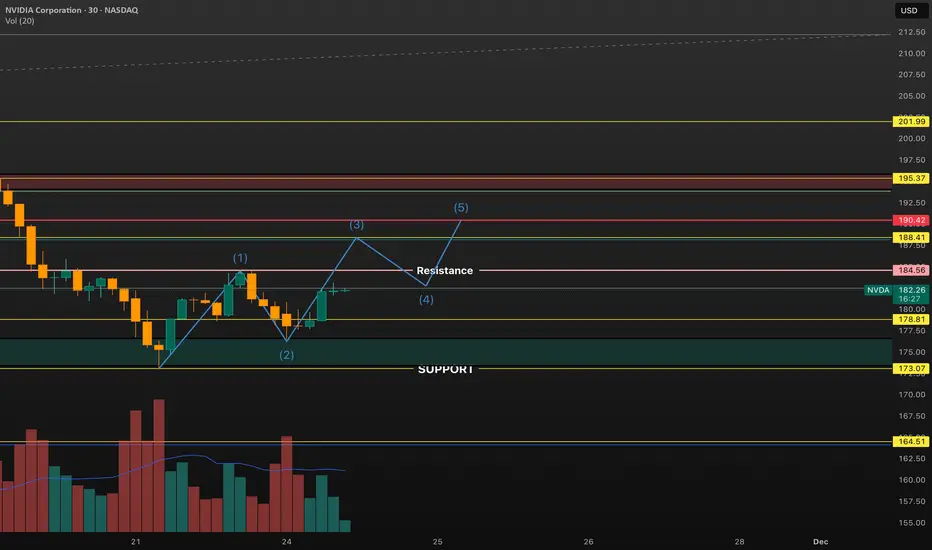
Nvda break through ~184? Can we see higher this week Nvda looks good this week with bounce on support and look for a test of 184. There is a lot of selling pressure in 190's get through that back to all time high. But for this week lets get over 184 first. My opinion only
NVDA Corrective Structure Completing? Critical Fib & Trendline CNVIDIA is completing an ABC correction after the recent top. Price is now sitting on a strong support area around 174–177, where multiple Fibonacci levels and a long-term trendline meet.
If this zone holds, NVDA may start a new move up toward 182–194.
If it breaks below 174, deeper levels like 164 become possible.
Watching for a reaction here to confirm the next direction.
Your Playbook for Deep Corrections: Top Seven Things to KnowEvery trader hopes that whatever is happening with any pullback is healthy. “Just a healthy retreat, it’ll go back, it always does. R-r-right?”
While that’s true (obviously, markets had always shot up to records after deep losses), your job is to survive that lower leg and ideally come out stronger than before.
Because sometimes the market doesn’t correct immediately. It drops, turns around, drops some more and doesn’t ask you how you’re doing.
Where are we in the valuation cycle now? In the “Is this AI thing a bubble” talks.
With stocks stretched, AI valuations orbiting Saturn, and Nvidia NASDAQ:NVDA dictating the market’s fate, investors are starting to ask: What happens if this thing unwinds… fast?
A deep correction shakes your portfolio like nothing else, ultimately putting your strategy (and sanity) to a test. That's why you must know how to deal with correction ( if when it comes).
Here’s your playbook. Seven things every trader should know when markets get serious.
⚡️ 1. Know What’s Driving the Tempo
Right now, the tempo-setter isn't in the economic calendar (but good to keep an eye on it). It's not gold, the US dollar, oil prices, or consumer sentiment.
It’s Nvidia NASDAQ:NVDA
The stock has shot to stratospheric levels, climbing with such force that the entire market now reacts to its every earnings forecast, capex comment, and Jensen Huang metaphor about the "virtuous cycle of AI.”
When a single company starts steering the market’s mood, you know the stakes are high. Nvidia’s rise has been spectacular. Its potential fall could also be spectacular.
If there’s a crash in the current market, undoubtedly tech goes first, and AI-tied shares are poised to lead the plunge. Not because the companies are bad, but because valuations are sky-high, crowded, and pumped by shady-looking multi-billion-dollar deals.
🧨 2. Sky-High Valuations Fall the Hardest
AI has been the market’s darling. And like any hot market corner, the exit door gets crowded when the music stops.
These stocks work great in a liquidity-rich, momentum-heavy environment. But in a deep correction, they can drop first and fastest.
Why?
They’re relatively expensive.
They’re owned by institutions (by boatloads).
They’re deeply intertwined with leverage.
When selling starts, it spreads: chips, software, cloud. Really anything with “AI initiative” mentioned in the last five earnings calls.
If the correction deepens, correlations go to 1 , and “diversification” starts to feel like a theoretical concept.
🧺 3. Staples Can Survive. But Aren’t Safe.
What tends to hold up in a downturn?
Companies that produce things people buy every day.
Coca-Cola NYSE:KO , Procter & Gamble NYSE:PG , Walmart NYSE:WMT , Costco NASDAQ:COST . These are the boring giants who don’t need AI hype to sell toothpaste, detergent, and caffeine.
But here’s the catch.
When tech crashes, fund managers don’t just sell tech.
They sell everything with liquidity to buy the tech names they've been waiting to own at a discount.
That includes consumer staples. Even the defensive darlings can get dumped to fund someone’s impulsive “NVDA is finally cheap!” moment.
🧭 4. Corrections Have Phases. Know Which One You’re In.
Corrections tend to move in waves:
Denial: “This is just a dip.”
Realization: “This is not a dip.”
Capitulation: “Sell everything.”
Bargain hunting: “Wait… everything is on sale.”
Recovery: “We survived. Buy up!”
Don’t confuse early weakness with late-stage panic.
Ideally, you want to buy when everyone else is emotionally unavailable, not when they’re still debating if it’s a pullback or an opportunity.
📊 5. Liquidity Matters More Than Fundamentals
In a deep correction, fundamentals usually take a backseat.
Everything becomes about liquidity.
Who needs cash?
Who has margin calls?
Who needs to rotate?
Which institutions need to de-risk?
This is why great companies drop alongside mediocre ones.
Liquidity can trump logic.
Market structure can trump valuation.
And algos don’t care that you really like that stock long-term.
🧘♂️ 6. Your Mindset Is a Position Too
Corrections can provoke every trading impulse, especially if they're steep and you expect a quick rebound:
Revenge trades
Over-leveraged dip buying
Premature bottom-calling
The hardest thing during a deep correction isn’t predicting the bottom, but not losing your head (and cash) before the bottom arrives.
Pro traders work with a few rules that help them avoid emotional decision making:
Pre-set drawdown limits
Scaling entries
Non-negotiable stop-losses
Portfolio hedges
Cash as an asset
If you don’t have a playbook before the drop, you’ll be writing one during the drop.
🛒 7. Buy the Best, Not the Loudest
When markets crack, everything goes on sale, everyone knows that.
Before you go bargain hunting and deep discount shopping, prioritize:
Cash-generating giants
Companies with pricing power (and moat)
Firms selling essentials in whatever industry
Businesses that don’t rely on hype to survive
🧾 The Takeaway
A deep correction may not be the end of the world, but it could be the market’s way of redistributing opportunity.
Nvidia and the AI titans have been running the show. And they’ll likely lead any sharp selloff.
And yes, even your safe, boring consumer staples can get dragged into the downside.
But corrections create clarity. They separate narrative from value, hype from durability, and momentum from substance.
If you stay disciplined, patient, and unemotional, a correction becomes less of a threat and more of a roadmap, pointing you toward assets worth owning when the next bull run begins.
Off to you : What’s your take on the current market situation? Do you see a bubble in the works, ready to go pop? Or it’s all looking fine and dandy, no reason for caution?

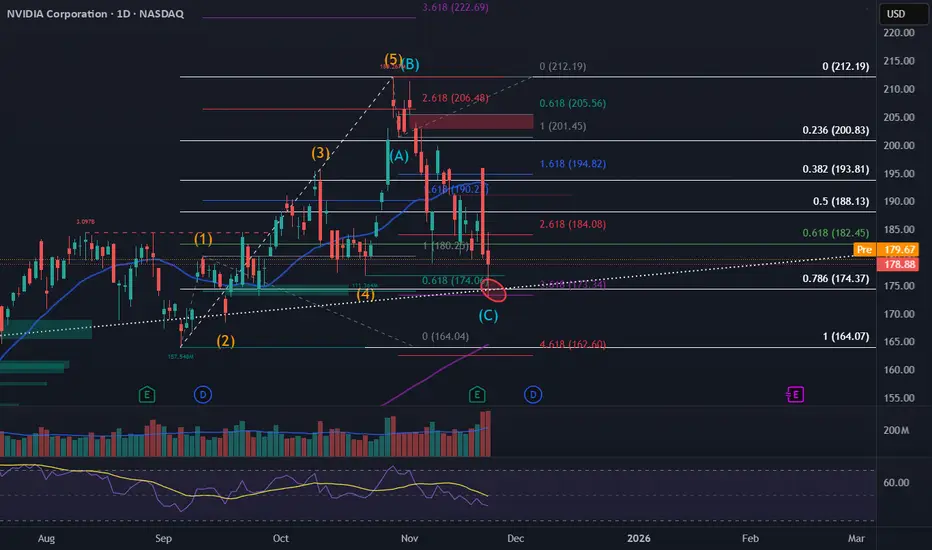
Analysis of the Nvidia (NVDA) Share ChartAnalysis of the Nvidia (NVDA) Share Chart
Last week, we published a post titled “Ahead of Nvidia’s (NVDA) Earnings: How the Price Could Move”, in which we:
→ Drew an ascending channel (shown in blue);
→ Suggested that market participants’ overly high expectations would likely not be met when earnings were released, leading to a decline in NVDA’s price towards the lower boundary of the ascending channel, where support lies at $165.
In reality, the earnings report turned out to be very strong:
→ Gross revenue: actual = $57bn, forecast = ~$54.9bn.
→ Earnings per share (EPS): actual = $1.30, forecast = $1.26 (previous quarter = $1.05).
The surge in price with a bullish gap towards point A reflected the initial reaction to the strong figures, but the share price then began to fall (reaching a two-month low), thereby confirming our expectations.
Technical Analysis of the Nvidia (NVDA) Chart
An analysis of NVDA’s price action suggests that the current situation can be viewed as a correction (shown with red lines), forming within an expanded ascending channel.
If NVDA’s share price declines towards the $165 level, where the lower boundary of the channel lies, this could encourage the bulls to attempt to resume the 2025 uptrend and mount a new push towards the psychological $200 mark.
This article represents the opinion of the Companies operating under the FXOpen brand only. It is not to be construed as an offer, solicitation, or recommendation with respect to products and services provided by the Companies operating under the FXOpen brand, nor is it to be considered financial advice.

Nvidia poised for rebound as support holds despite recent sell-o
Current Price: $183.11
Direction: LONG
Confidence Level: 68%
Targets:
- T1 = $186.00
- T2 = $193.00
Stop Levels:
- S1 = $180.00
- S2 = $175.00
**Wisdom of Professional Traders:**
When I combine what multiple professional traders have been sharing, I'm seeing a setup where the recent pullback in Nvidia is being treated more as a buying opportunity than a sign of deeper trouble. Several traders are watching the $180 area as a key short-term support, pointing out that despite intense volatility and "pump-and-dump" style reversals around earnings, the underlying fundamentals and demand for AI hardware remain strong. The collective view leans toward upside if key resistance levels are reclaimed this week.
**Key Insights:**
Here's what's driving my thinking — the $184 level has been cited over and over as a critical pivot. A sustained move above that could quickly attract momentum buyers again. While bears have been vocal post-earnings, the consensus from market experts is that Nvidia’s growth story hasn’t changed; the sell-off was largely technical and sentiment-driven. Repeated mention of potential rallies into gaps above $190 adds weight to a bullish bias.
What's interesting is that traders are balancing concerns over valuation with the reality of Nvidia’s unique market position. Many acknowledge Michael Burry’s short and general AI bubble fears, but they’re countering that with hard numbers: record revenues, data center and networking growth, and still-dominant market share. That tug-of-war is exactly why reclaiming $184 is such a big psychological shift.
**Recent Performance:**
This all played out in the price action last week. Nvidia gapped up after its earnings beat, ran into resistance just under $200, and then reversed hard, dropping almost 6% in a single session to tag its 21 EMA around $179. We saw multiple intraday swings of 3-5%, reflecting just how reactive traders were to each headline. Still, the $180 zone held into the week’s close.
**Expert Analysis:**
Several professional traders I track are framing the $180-$184 band as the immediate battlefield. They expect buyers to defend $180 in the short term, with any push above $184 potentially triggering a squeeze toward $190-$193 — levels mentioned by more than one commentary. Others note that the stock has pulled back into a prior consolidation zone from August, which often acts as a demand area for swing traders.
The professional consensus also points out that Nvidia still commands a 90% share of the AI chip market, and demand massively outpaces supply. That fundamental backdrop is why even technically-oriented traders are leaning to the long side here despite recent bearish chart patterns.
**News Impact:**
The main news catalyst remains U.S.-China trade policy chatter — any positive movement toward allowing Nvidia to sell advanced chips to China has prompted immediate price spikes. On top of that, the market is still digesting blockbuster earnings that were overshadowed by valuation worries. If geopolitical developments break positively this week, they could be the trigger that catches shorts off guard and propels price above the critical $184 level.
**Trading Recommendation:**
Here’s my take — with support at $180 still intact and multiple traders eyeing a move above $184, the risk-reward for a tactical long makes sense this week. I’d look to enter around current levels, with stops just under $180 to protect capital. Initial target sits at $186 for a quick momentum trade, and if that breaks, aim for $193 where the next overhead supply is likely to show up. This remains a short-term swing idea while the technical and news catalysts align.

Midterm Stock Forecast for NVIDIANASDAQ:NVDA shows weakening momentum after its extended rally, with H1 structure signaling a corrective phase. A drop from $178 toward $150 aligns with cooling AI-driven sentiment and stretched valuation multiples. Fundamentally the long-term demand for GPUs remains strong, but midterm pricing pressure and slowing data-center spending could weigh on sentiment. A retracement to $150 would reset indicators and create a healthier base for long-term buyers.

Nvidia loses steam despite exceptional 3Q performance
Nvidia (NVDA) posted a record-breaking 3Q performance, with revenue surging 62% YoY to 57 bln USD. Its 4Q guidance points to another 65% increase, reinforcing optimism that growth momentum will continue to accelerate. CFO Kress noted that the guidance does not include any contribution from China sales, while CEO Huang pushed back against recent AI-bubble concerns raised by Michael Burry.
Nevertheless, AI valuation risks remain elevated. Beyond strong earnings, the scale of AI infrastructure spending and the surge in bond issuance required to fund it continue to dampen investor sentiment.
Goldman Sachs (GS) has warned about the fragility in the private credit market. The firm highlighted that Blue Owl Capital, with more than 295 bln USD in AUM, over half of which is credit-exposed, has seen its share price fall nearly 30% since Sep. Major credit-heavy players such as KKR and Blackstone are also showing signs of pressure, underscoring how AI-driven anxiety is spilling into private credit.
NVDA briefly breached above the psychological level at 195.00 but surrendered all gains, falling back below 182.00. The price remains under the death-crossed EMAs, indicating a potential expansion of the bearish bias.
If NVDA breaks below the support at 173.00, the price could decline further toward the following support at 164.50.
Conversely, if NVDA breaches above the resistance at 182.50 and the ascending trendline, the price may advance toward the subsequent resistance at 190.00.