Oracle's surge is a bull market warningOracle has become the latest torch bearer of this market’s fever. A sharp, double-digit jump in days. Not because of numbers on a balance sheet, but because of mood. Sentiment is running wild, and traders are piling in.
These are the signs of caution experienced traders take during bull markets.
This market doesn’t need fundamentals. It needs stories. Oracle provided one, AI, cloud infrastructure, and firming whispers of a TikTok tie-up. That’s all it takes in a market already priced for perfection. The hotter the tape, the more dramatic the reactions.
The narrative is seductive. Media and enterprise tech converging. Old-guard software reborn as a cloud giant. These are big, glossy ideas. But when valuations are stretched, stories become more dangerous than compelling.
We’ve seen this play out before. In hot markets, price runs ahead of reality. Crowds cheer the breakout, analysts upgrade, and traders convince themselves this time is different. Then something shifts. Sentiment cracks. The same names that soared, collapse first.
Oracle is not the problem. It’s the signal. A sign that markets are running on fumes of optimism. The Nasdaq is back to trading at extreme multiples. Liquidity is abundant, and money is chasing flash. When that music stops, the hangover will be sharp.
Caution is the trade here. Oracle’s rally is not a testament to strength. It’s evidence of a market too eager to believe its own stories.
The forecasts provided herein are intended for informational purposes only and should not be construed as guarantees of future performance. This is an example only to enhance a consumer's understanding of the strategy being described above and is not to be taken as Blueberry Markets providing personal advice.
Trade ideas
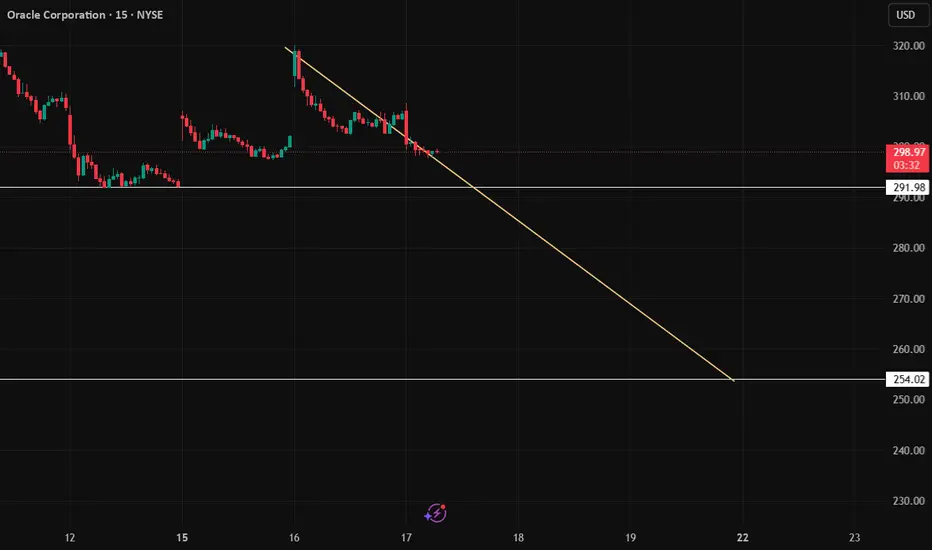
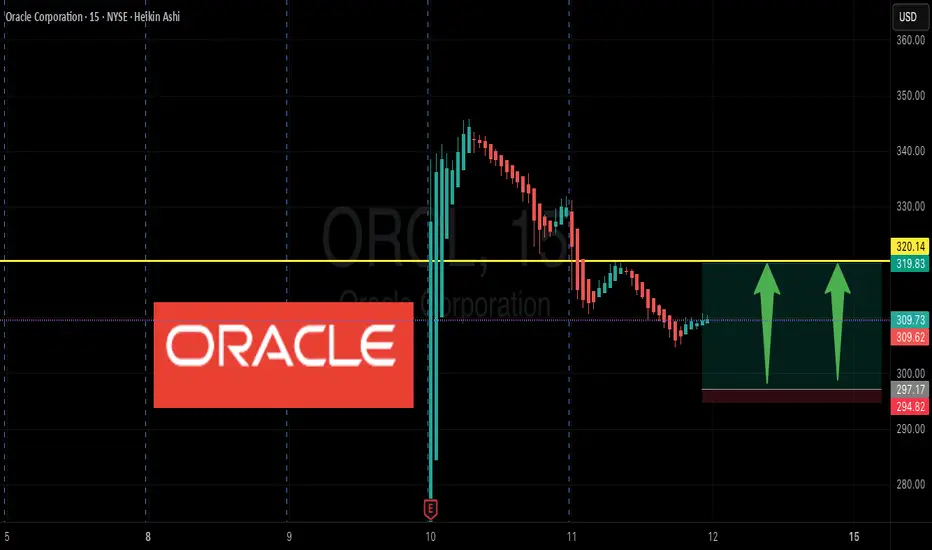
This what i see This what i see in the short term main reason overbought only if it break it 292.00
-opinion
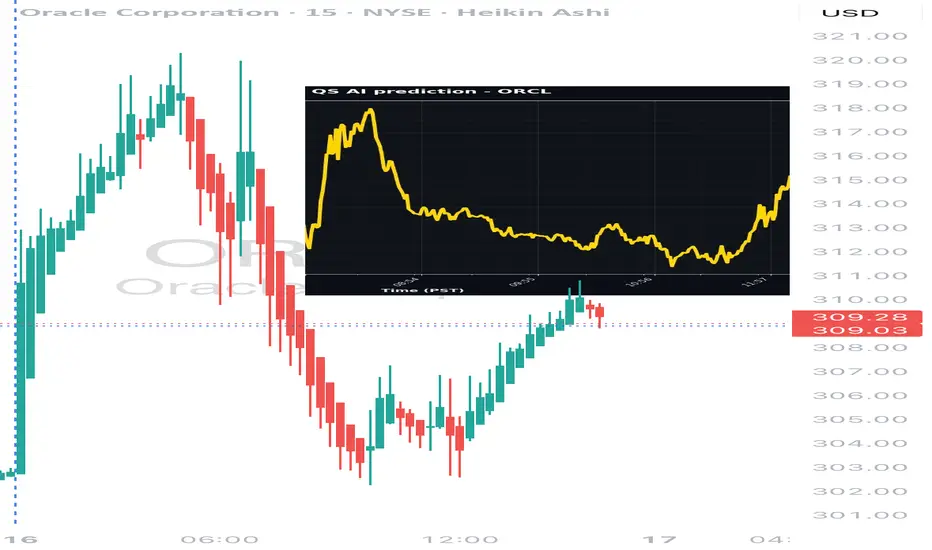
ORCL Rockets and Pullbacks: Today’s Ride 🔥AI powerful prediction—who wins next? 🐂
🚀 ORCL Intraday Move – Sept 16, 2025
💵 Close: $306.65 (+1.49%)
📈 High / Low: $320 / $302
📊 Volume: 51.7M
#ORCL #StockMarket #TradingView #Bullish #AI #Finance
ORCL Technical Outlook – Rebound Within Rising Channel Ticker: 🖥️ ORCL Technical Outlook – Rebound Within Rising Channel
Ticker: ORCL (Oracle Corp.)
Timeframe: 30-minute candles
🔍 Current Setup
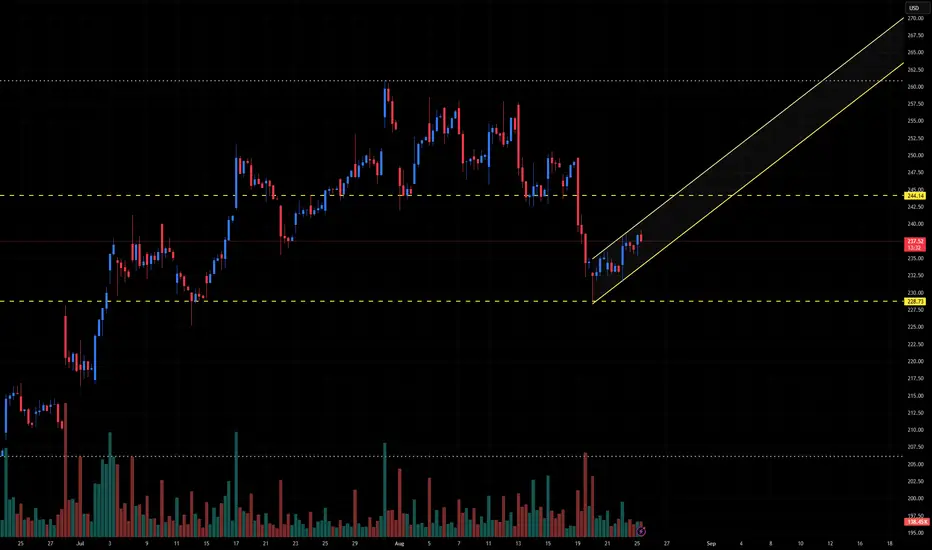
ORCL recently sold off from the 245–246 resistance zone, dropping sharply before finding support near 229. From there, price has begun to rebound, carving out a rising channel.
Immediate support: ~229
Immediate resistance: ~244–246
Current price: ~237.50, climbing within the channel.
This suggests ORCL is in a short-term recovery phase, but it must break back above 244–246 to resume its broader uptrend.
📊 Breakout Levels
🚀 Upside (Bullish Scenario)
Trigger: Break and close above 244–246.
Intermediate Targets:
252–255 → Next resistance cluster.
260–262 → Extension zone.
Measured Move Target: ~265–267 (channel projection).
🔻 Downside (Bearish Scenario)
Trigger: Break below 229, which would invalidate the rising channel.
Intermediate Supports:
225–223 → Minor support.
218–215 → Stronger base.
Measured Move Target: ~210–212 (retracement target).
📈 Volume Analysis
Selling volume spiked on the drop to 229, showing heavy liquidation.
Current rebound is on lighter, steady volume, consistent with a relief rally.
A breakout above 246 requires a surge in volume to confirm bullish intent.
⚖️ Probability Bias
The short-term structure favors a rebound toward 244–246.
However, this level is the line in the sand — failure to reclaim it would likely result in renewed selling pressure.
✅ Takeaway
ORCL is in a channel recovery after its sharp sell-off:
Bullish Break > 246: Targets 252 → 260 → 265–267
Bearish Break < 229: Targets 225 → 218 → 210
The battle at 246 will decide whether ORCL resumes its uptrend or continues lower.
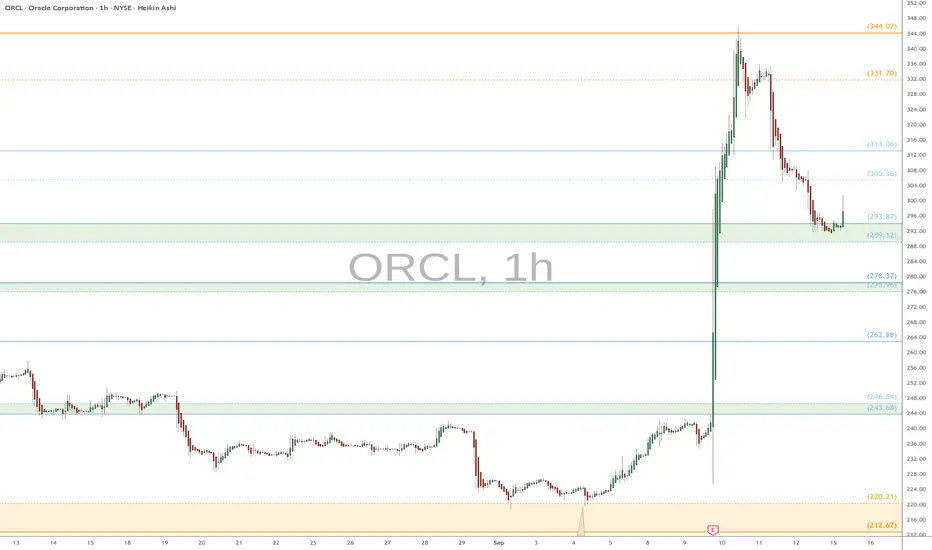
ORCL watch $289-293: Key Support to hold dip from Golden GenesisORCL fell from our Golden Genesis as predicted in idea below.
The retrace has now reached a key support at $289.12-293.87
Looking for consolidation and bounce from this zone to rebuy.
.
Last Plot that gave a PERFECT DROP:
Hit BOOST and FOLLOW for more PRECISE and TIMELY charts.
====================================================
.
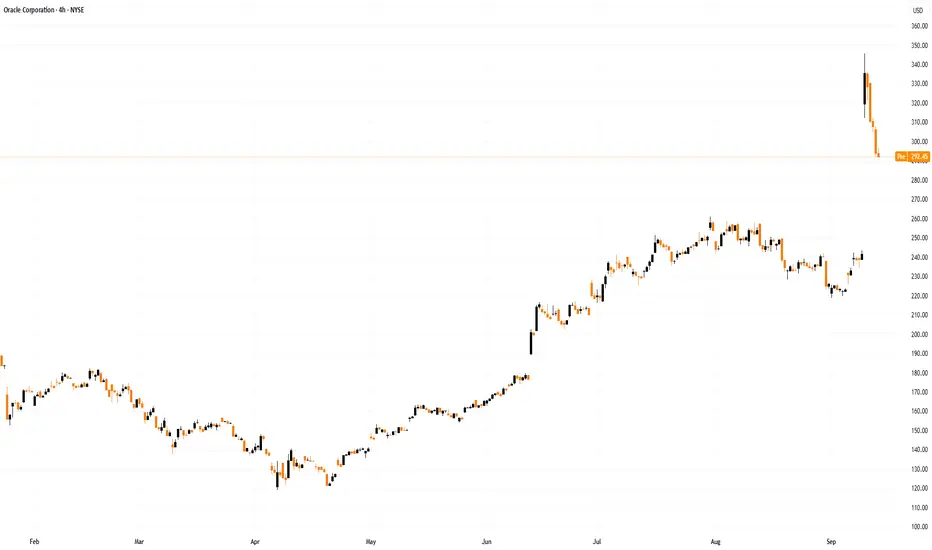
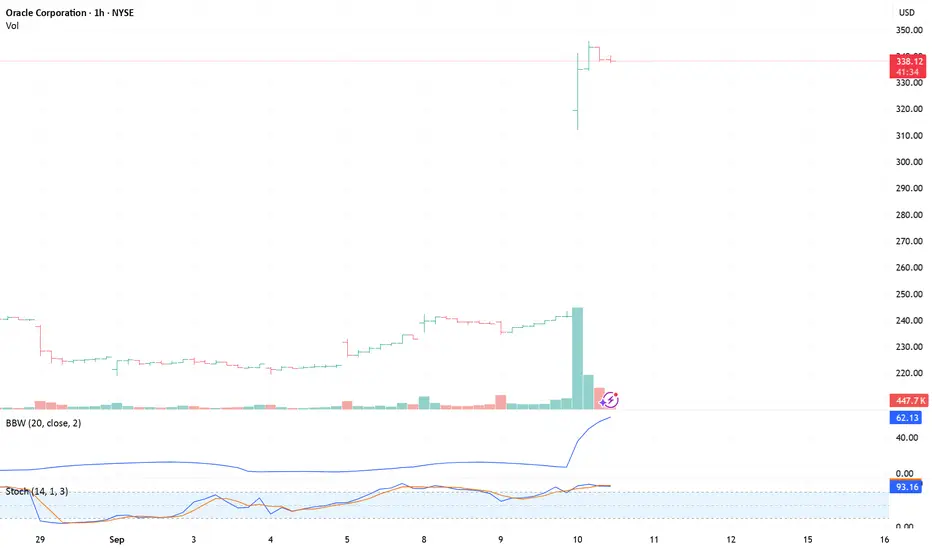
Oracle (ORCL) Stock Price Pulls Back After Historic SurgeOracle (ORCL) Stock Price Pulls Back After Historic Surge
On 10 September 2025, ORCL shares soared by 36% in a single trading session:
→ the price reached an all-time high above $340;
→ Oracle’s co-founder and chairman, Larry Ellison, briefly became the world’s richest individual.
Why Did ORCL Shares Surge?
The rally was triggered by announcements of several multibillion-dollar deals in cloud infrastructure for artificial intelligence. Oracle revealed contracts worth a total of $300 billion, with clients including OpenAI, Nvidia, SoftBank, Meta, and Elon Musk’s xAI.
According to media reports:
→ CEO Safra Catz stated that the company’s Remaining Performance Obligations (RPO) could soon exceed $500 billion;
→ analysts and investors began drawing comparisons between Oracle and Nvidia, positioning Oracle as a key player in the AI ecosystem by providing essential cloud infrastructure.
However, by the end of the week, ORCL shares had retreated by roughly 15% from their peak.
Technical Analysis of ORCL
After such a steep rally, many holders likely took profits, contributing to the pullback. In addition, strong overbought signals emerged following last week’s bullish gap, indicated by:
→ the RSI indicator;
→ a price breakout above the upper boundary of the long-term channel (shown in blue);
→ the advance beyond the psychological $300 level.
Although Oracle’s long-term outlook remains highly promising, the company still holds a smaller share of the cloud services market compared with Amazon Web Services, Microsoft Azure, and Google Cloud.
At present, we could assume that the market has entered a corrective phase, with ORCL potentially retracing to the $270–280 area, where a cluster of support levels is located:
→ the median line of the medium-term (orange) channel;
→ the 50% Fibonacci retracement of the A→B impulse;
→ the upper boundary of the blue channel, which may switch its role to act as support.
Additional support could be found at $260 and at the lower edge of the gap near $240 if the correction deepens. Overall, however, given the long-term impact of the recently secured contracts, Oracle’s prospects in cloud computing and AI remain robust.
This article represents the opinion of the Companies operating under the FXOpen brand only. It is not to be construed as an offer, solicitation, or recommendation with respect to products and services provided by the Companies operating under the FXOpen brand, nor is it to be considered financial advice.
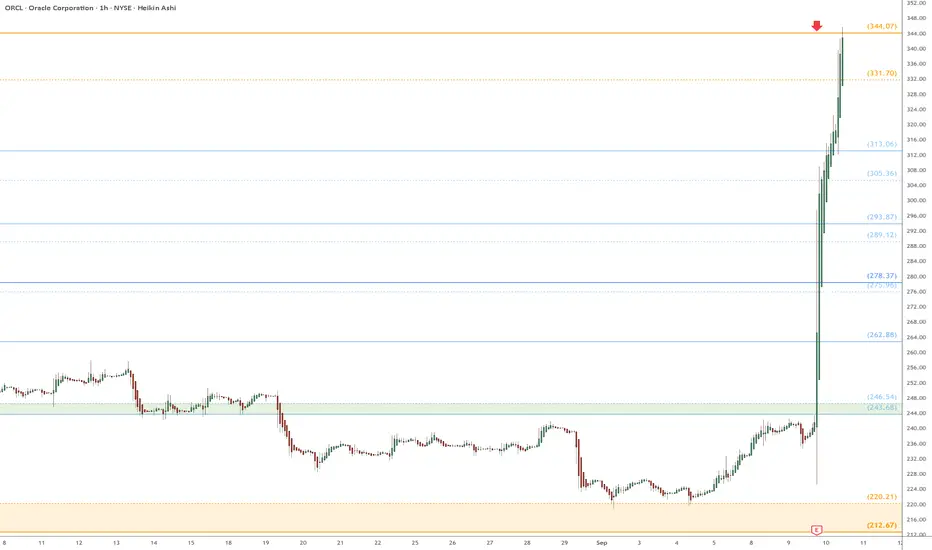
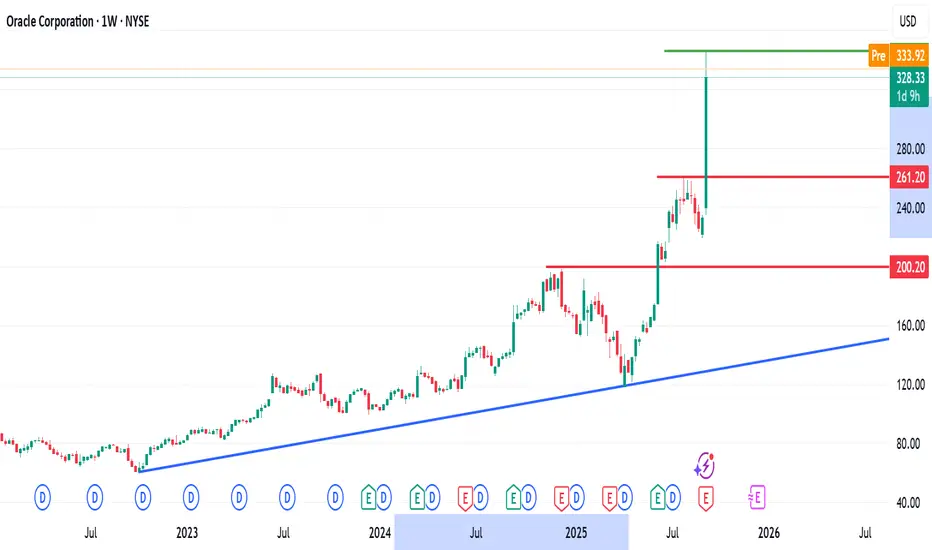
ORCL heads up at $344.07: Golden Genesis fib may STOP the SURGE ORCL got an incredible surge from the Earnings Report.
It surged over 45% into a Golden Genesis fib at $344.07
Look for some Orbits around this fib then a Dip-to-Fib.
.
Previous Analysis that caught this PERFECT BREAKOUT:
Earlier Plot that caught the EXACT BOTTOM:
Hit BOOST and FOLLOW for more such PRECISE and TIMELY charts.
=========================================================
.
ORACLE Oracle's stock opened on a massive bullish note due to several key reasons tied to its latest business developments and market outlook:
Huge Growth Forecasts Driven by AI-Cloud Deals
Oracle announced an aggressive growth outlook for its cloud infrastructure division, projecting booked revenue from Oracle Cloud Infrastructure to exceed $500 billion over the next five years. This is largely driven by booming demand for AI-related cloud infrastructure, including a significant $300 billion, five-year cloud contract with OpenAI and other multibillion-dollar deals. This fueled investor optimism about Oracle's position as a key AI-cloud leader.
Record-Breaking Stock Performance
Oracle’s shares surged approximately 36% in a single trading session on September 10-11, 2025, the largest one-day jump since 1992, adding roughly $247 billion to its market value and pushing valuation close to the $1 trillion mark. This historic performance reflects confidence in Oracle’s AI cloud business expansion.
Strong Backlog and Revenue Growth
Oracle’s Remaining Performance Obligations (RPO) jumped to $455 billion, up more than fourfold year-over-year, signaling a massive backlog of future revenue. Additionally, Oracle’s recent fiscal results showed strong growth in cloud services and license support revenue.
Market-wide AI Optimism
Investors rewarded Oracle amid a broader wave of enthusiasm for AI-driven tech companies, lifting major indices like the S&P 500 and Nasdaq. The AI-cloud infrastructure demand surge reinforced expectations of sustained revenue growth and market leadership.
Summary
Oracle’s massive bullish open is primarily due to its transformational AI-cloud contracts, spectacular revenue backlog growth, and a historic rise in stock valuation. The market views Oracle as a frontrunner in the expanding AI infrastructure space, driving a surge in investor confidence and buying activity.
ALLOW PRICE TO RETEST AND GO LONG
#ORACLE #STOCKS

ORCL Weekly Bullish Scalp – $320 CALL, 50% Target!
🚀 **ORCL Weekly Play | 2025-09-11** 🚀
**Directional Bias:** STRONG BULLISH ✅
**Reason:** Multi‑timeframe momentum (Daily RSI 77 / Weekly RSI 83.5) + 4.1x institutional volume 📊
⚠️ Note: Weekly options flow bearish (call/put 0.77) → likely hedging, **don’t overthink it**.
**💡 Trade Recommendation:**
* **Instrument:** ORCL weekly call
* **Strike:** 320.00 💰
* **Expiry:** 2025-09-12
* **Entry Price (ask):** \$3.10
* **Direction:** LONG ✅
* **Position Size:** 1 contract (scale to 2% account risk max)
**🎯 Targets & Stops:**
* **Profit Target:** \$4.65 (+50%)
* **Stop Loss:** \$1.55 (-50%)
* **Entry Timing:** Market open 🕒
* **Exit:** Prefer by 2–3 PM ET to avoid gamma/pin risk
**⚡ Why This Strike:**
* Higher delta (\~0.35–0.45) → better chance to move ITM in 1 day
* Liquid OI (1,695) → smoother execution
* Premium allows **controlled position sizing**
**Alternative Options:**
* \$322.50 call (ask \$2.41) → more conservative, slightly lower delta
* \$335 call (ask \$0.62) → high-leverage “lottery” ticket, tiny size only
**📈 Key Risks:**
* HIGH gamma / accelerating theta ⚡
* Options flow put dominance → possible short interest
* Intraday news shocks can wipe out premium
**Confidence Level:** 70% ✅
**📊 JSON Trade Snapshot:**
```json
{
"instrument": "ORCL",
"direction": "call",
"strike": 320.0,
"expiry": "2025-09-12",
"confidence": 0.70,
"profit_target": 4.65,
"stop_loss": 1.55,
"size": 1,
"entry_price": 3.10,
"entry_timing": "open",
"signal_publish_time": "2025-09-11 10:16:53 UTC-04:00"
}
```
💥 **TL;DR:** ORCL is firing on all cylinders. Strong bullish momentum + heavy volume → tactical 1-day call for high-gamma intraday play. Tight stops, small size, exit early.
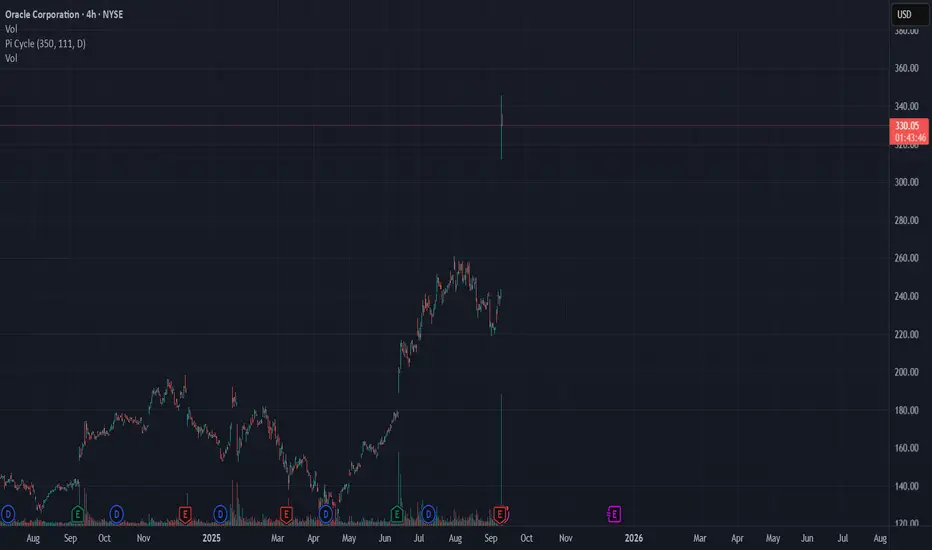
ORCL, what's next after 2 days 58% rallyORCL, what's next after 2 2-day 58% rally?
This asset has witnessed an unprecedented growth in the past 2 days, pushing the stock to an ATH.
The question is, what next?
Share your thoughts
ORCL – Historical +40% Move to ATH, Wave 5 CompletedMy original post was hidden due to a house rule violation, but I’m sharing the setup again here:
Oracle just made a historical one-day gain of over 40% with a gap-up at market open — the largest single-day move in its history. This instantly fulfilled Elliott Wave 5 and pushed price to new all-time highs.
From here, consolidation is expected with an ABC correction, which has not yet started but is likely to begin from this ATH level. At minimum, a 23.6% retracement is highly probable for the first leg, with further direction depending on market structure. The open gap also sits below the 23.6% retracement and will need to be filled at some point.
This is considered a high-probability concept even against the trend, as the plan is to aim for a tight 0.5R trade (1 ATR target, 2 ATR stop loss on the 4H chart). Oscillators don’t play a role here — all are overbought in the uptrend without trend breaks — but this is a different type of entry setup under the Trading Unicorn approach.
Disclaimer: This idea is for educational purposes only. Please do not place trades solely based on this setup.

Oracle’s surge mints new richest man & Traders eye 50bps cutOracle’s shares jumped 35% after reporting a surge in cloud bookings driven by AI demand. The rally propelled CEO Larry Ellison above Elon Musk to the top of the global wealth rankings.
In contrast, Apple fell 3% as its iPhone 17 launch failed to impress. Its new AirPods Pro 3, which can translate languages in real time, has generated some buzz and excitement though.
On the economic front, U.S. producer price inflation (PPI) declined 0.1% in August, defying expectations for a 0.3% increase.
It was the first monthly drop in four months and added momentum to the view that disinflation is back on track ahead of Thursday’s consumer price index (CPI) report.
The combination of softer PPI data and weaker-than-expected NFP data last week has strengthened speculation that the Federal Reserve could deliver a larger-than-expected 50 basis point rate cut next week.

ORCL, the top is inI understand we're seeing a rotation from compute to connectivity, and that companies like MDB, SNOW, and ORCL are bound to pump based on inflows.
HOWEVER, seeing a company miss on both EPS and REV and then pumping 42% after is kind of ridiculous.
WHY did it do that? Because they "have $144B backlog"
but do they really? And how is that being calculated?
For example, if a customer has a contract and you assume they'll keep it for 20 years, how much of that is priced in here with that backlog number?
I am taking 10/17 ORCL 290P as I expect a move back to 275.
At that level, I may re-evaluate.
Oracle Corporation | ORCL & Ai If there is one person that you can compare it with Tony Stark aka IRON MAN is Larry Ellison
the ruthless entrepreneur who is born to win and be the number 1. Since the close of trading Friday, Ellison’s net worth has pumped 8 billion dollar to reach $ 206 billion
Oracle’s stock has reached new highs following its earnings report last week, which exceeded expectations and raised its revenue forecast for fiscal 2026.
Orcl have risen 20% this month and If this upward trend holds, it would mark their best performance since October 2022, when the stock jumped 28%, and the second best month since October 2002, nearly two decades ago.
The company’s stock success is partly driven by its involvement in the booming artificial intelligence sector. Ellison, Oracle’s founder since 1977, mentioned in last week’s earnings call that the company is building data centers to meet the growing demand for generative AI.
“We are literally building the smallest, most portable, most affordable cloud data centers all the way up to 200 megawatt data centers, ideal for training very large language models and keeping them up to date,” Larry said during the call
also he recently mentioned that Elon Musk and I ‘begged’ Jensen Huang for GPUs over dinner!We need you to take more of our money please!! It went ok. I mean, it worked!
Oracle also announced last week a partnership with Amazon’s cloud computing division to run its database services on dedicated hardware. Over the past year, it has formed similar alliances with Microsoft and Google, two other major cloud infrastructure providers
Oracle's cloud services are a key driver of their success, with revenue from this division growing 21% year over year, reaching $5.6 billion in quarterly earnings
Oracle is becoming a crucial provider, acting like a foundational layer for AI-focused companies. Their database systems are now critical to supporting businesses like OpenAI, AWS, and Google Cloud in building the infrastructure for future AI advancements. Despite AWS and Google Cloud being direct competitors, Oracle’s software remains essential to AI’s future.
Oracle's technology plays a foundational role, much like GPUs have in AI development. As companies seek efficient cloud-database solutions for AI workloads, Oracle is well-positioned to fulfill this demand.
Considering their strong Q1 performance and the central role of their database software in this field, I now view Oracle as a strong buy. The company's AI-powered cloud solutions, strategic partnerships, and growing database market make their technology indispensable for the future of AI
Oracle’s fiscal Q1 for FY 2025 exceeded expectations, with non GAAP earnings per share (EPS) of $1.39, surpassing estimates by $0.06, and revenue hitting $13.3 billion, outperforming projections by $60 million. The cloud segment, which includes their AI database software, remains a significant growth driver, generating $5.6 billion in revenue.
Most of Oracle’s revenue came from the Americas, contributing $8.3 billion, a 6.9% year-over-year increase. The AI revolution, gaining momentum in the US, aligns with their strong revenue growth in this region.
During the Q1 earnings call, management emphasized their expanded partnerships with major tech companies like Google Cloud (Alphabet Inc) and AWS (Amazon), which are notable given that they are also competitors. Oracle highlighted its success in the AI training space, pointing to the construction of large data centers equipped with ultra-high-performance RDMA networks and 32,000-node NVIDIA GPU clusters.
In the EMEA region, crucial to Oracle’s growth due to rising demand for cloud infrastructure and AI solutions among European enterprises and governments (sovereign AI), the company reported $3.3 billion in revenue.
Oracle’s earnings per share aka EPS is projected to grow at a compound annual rate of 13.5% for FY 2025, increasing to 14.41% in FY 2026, and continuing to compound at a modest double-digit rate in the coming years.
While these projections show strong potential for Oracle to be a compounder, I believe they may be somewhat conservative. The company’s remaining performance obligations (RPO) jumped 53% year-over-year to $99 billion by the end of the first fiscal quarter, indicating that their pipeline of signed work is growing faster than revenue. Once Oracle scales its solutions and workforce to match this RPO growth, we could see both revenue and EPS accelerate further.
In fact, while Oracle’s forward revenue growth is projected at just 8.86% for the next 12 months, their backlog is growing by over 50%. This suggests a notable gap between revenue expectations and actual demand.
I believe the current revenue growth projections are too low, and once revised upward, they could become a key growth catalyst for the company.
As for Oracle’s valuation, its forward price-to-earnings (P/E) ratio stands at 24.74, which is just 6.76% above the sector median of 23.17. However, given Oracle’s growth potential, I think it warrants a P/E ratio closer to 30.12, which is roughly 30% above the sector median. This would imply an additional 21.75% upside for the stock, excluding dividends.
With a forward P/E ratio only slightly above the sector median, despite Oracle’s impressive growth, the company’s performance suggests the stock should be trading at a higher valuation.
Larry Ellison is the man that I always can trust his vision and always bullish on his spirit and his ambitious. Oracle expanding influence in AI, coupled with robust revenue growth, positions the stock for significant upside. AI is like a modern day Gold Rush, and Oracle, much like GPU makers, is providing the essential tools the "pickaxe" for AI companies so That’s a space I’m eager to invest in
the chart looks insane and if there will be pullback I consider it as a buy opportunity

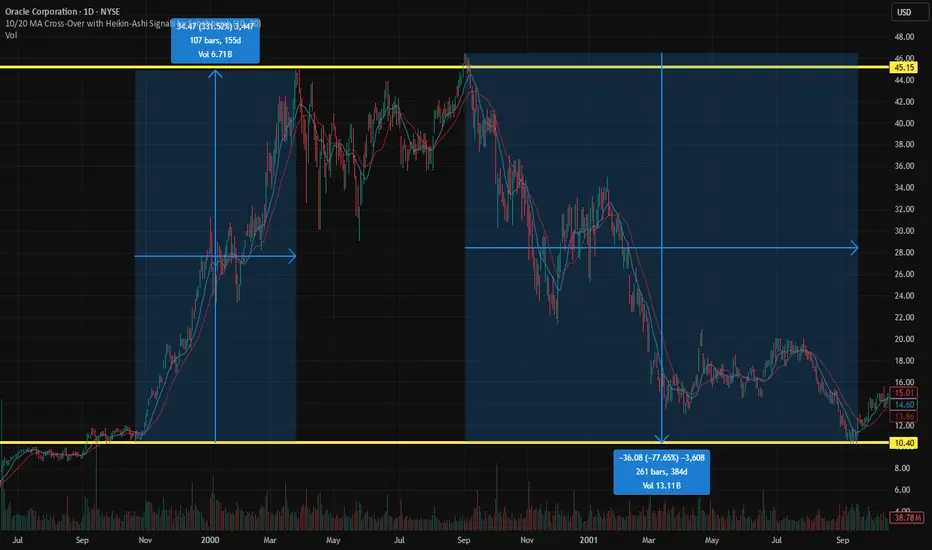
Peak of AI bubble has been reachedToday marks a point in the overexaggeration of AI-company valuation, that concerns me alot. NYSE:ORCL printing 500 billion dollars of market cap in a few hours just based on future revenue projections . Several smaller AI stocks like NASDAQ:IREN , NASDAQ:RZLV and the most important one: NASDAQ:NVDA printing valuation based on future hopes without an end. The companies most likely will not live up to their expectations , causing them to correct to their fair-value. Which in most cases means atleast a 80% correction . This is very similar to the Dotcom-bubble in the year 2000. You dont need profits or large revenue or even a good product to achieve an astronomic valuation. You just need the AI-Label, like the Internet-Label back then.
I expect the broad market and especially tech and AI-focussed stocks to correct rapidly in the coming months to price in less exaggerated expectations. The current state of the market is just pure euphoria . The correction for these stocks will be, for most companies, between 60-80% , with even bigger potential corrections for smaller AI-companies.
ORCL - Clear Signs of TOO MUCH MONEY in the pipesI shorted this at 143. 70 PE, poor earnings report. Pie in the sky future guidance. Somehow, someway, this is going to end and it won't be pretty. Unfortunately, it might not happen in my lifetime, especially with the Fed poised to start cutting already low interest rates.
ORCL heads up at $212 then 220: Double Golden Fibs may STOP runORCL has been flying off the last Earnings report.
About to hit DUAL Golden fibs at $212.67-220.21
Ultra-High Gravity objects in its price-continuum.
It is PROBABLE to consolidate within the zone.
It is POSSIBLE to reject and dip to a fib below.
It is PLAUSIBLE but unlikely to blow thru them.
.
My last Plot that caught the BreakOut EXACTLY:
=================================================
.

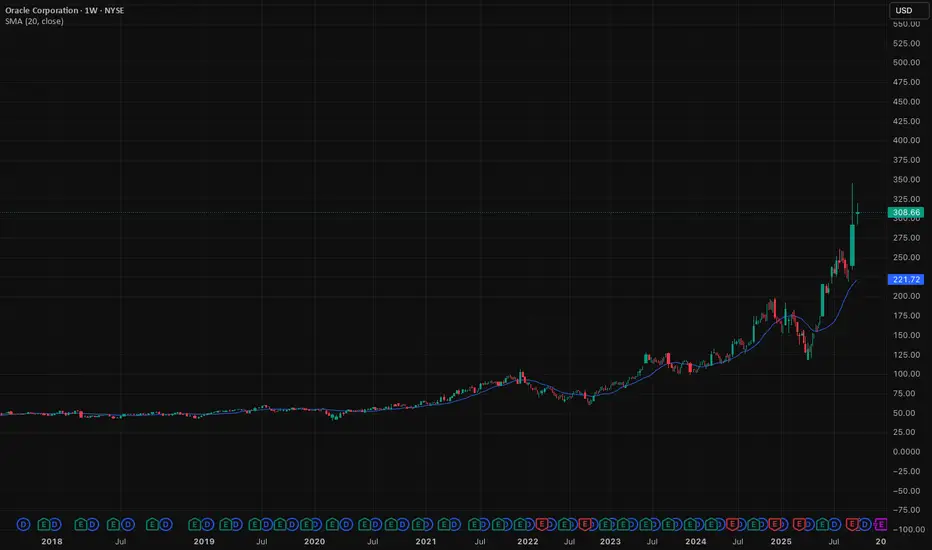
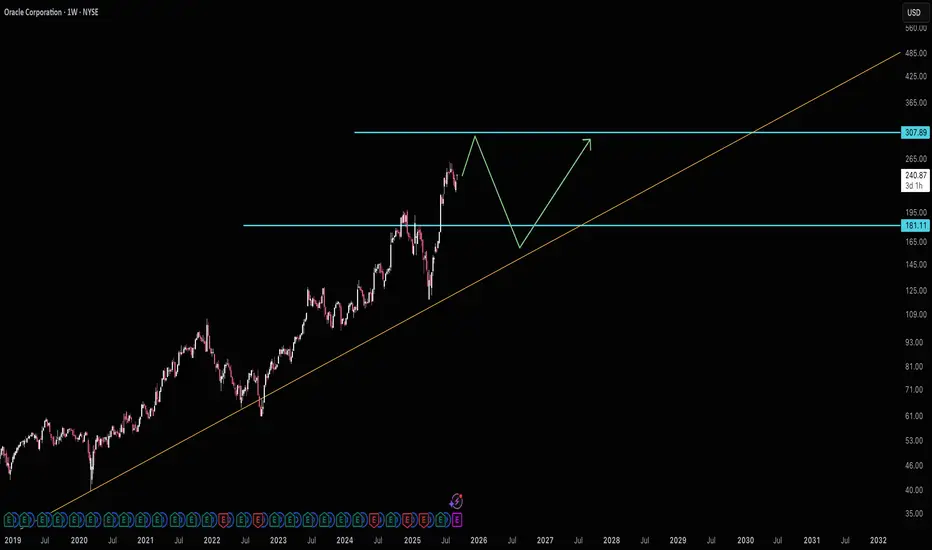
Oracle wants $181Oracle is well off it's long term average and accelerating growth by around 4 years if it hits $307. If it makes it there I would *highly* suggest selling and even potentially a short position. A fair price for ORCL would be $181.
Good luck!
ORCLOracle Corporation is an American multinational computer technology company headquartered in Austin, Texas, United States. In 2020, Oracle was the third-largest software company in the world by revenue and market capitalization.
Buy/long candidate.

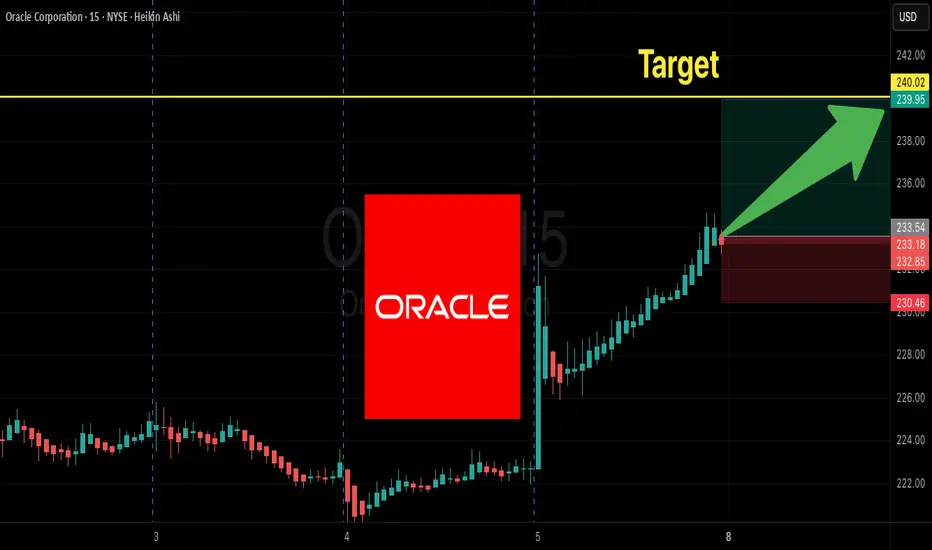
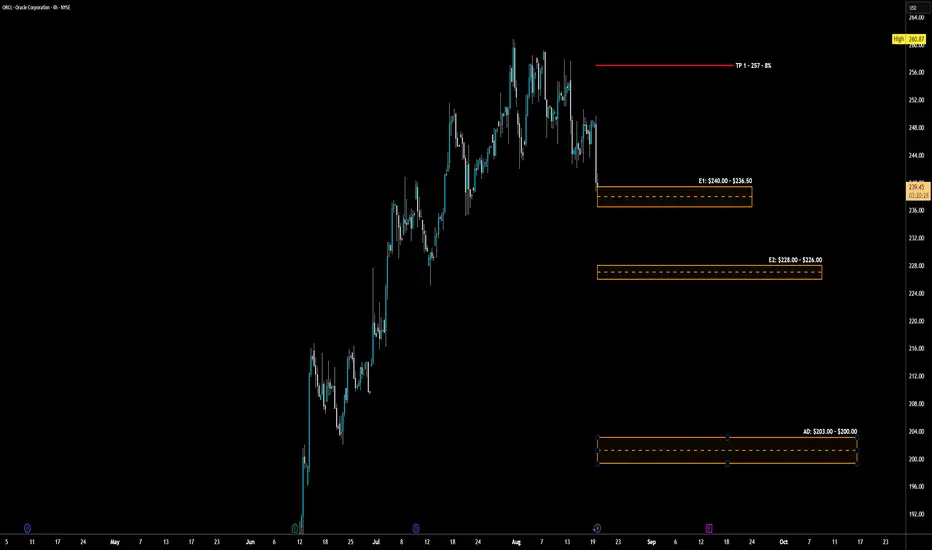
ORCL - LONG Swing Entry PlanNYSE:ORCL - LONG Swing Entry Plan
E1: $240.00 – $236.50
→ Open initial position targeting +8% from entry level.
E2: $228.00 – $226.00
→ If price dips further, average down with a second equal-sized entry.
→ New target becomes +8% from the average of Entry 1 and Entry 2.
AD: $203.00 – $200.00
→ If reached, enter with double the initial size to lower the overall cost basis.
→ Profit target remains +8% from the new average across all three entries.
Risk Management:
Stop Loss:
Risk is capped at 12% below the average entry price (calculated across all executed positions including the Edit Zone).
Position Sizing Approach:
Entry 1: 1x
Entry 2: 1x
Edit Zone: 2x
→ Total exposure: 4x
→ Weighted average determines final TP and SL calculations.
______________________________________
Legal Disclaimer
The information provided in this content is intended for educational and informational purposes only and does not constitute financial, investment, or legal advice or recommendations of any kind. The provider of this content assumes no legal or financial responsibility for any investment decisions made based on this information. Users are strongly advised to conduct their own due diligence and consult with licensed financial advisors before making any financial or investment decisions.
Sharia Compliance Disclaimer: The provider makes no guarantees that the stocks or financial instruments mentioned herein comply with Islamic (Sharia) principles. It is the user’s responsibility to verify Sharia compliance, and consultation with a qualified Sharia advisor is strongly recommended before making any investment decisions
ORCL Earnings Put Play $205 Puts – Are You In?
# 🔥 ORCL Earnings Play – Bearish Tail Hedge 🚨
**📊 Setup:** Oracle (ORCL) – Earnings 09/09 AMC
**🎯 Direction:** PUT (Short Bias)
**💵 Entry:** \$0.93 (205 Put)
**🛑 Stop:** \$0.47 (−50%)
**🎯 Target:** \$2.79 (+300%)
**📅 Expiry:** 2025-09-12
**📈 Confidence:** 66%
---
### ⚡ Why this trade?
* 📉 Weak technicals → price < 20d & 50d MAs, RSI \~42
* 🏦 Institutional flow → heavy OI/volume at \$205 puts
* 💣 Leverage risk (Debt/Equity > 500%)
* 🎯 Cheap asymmetric bet → defined premium risk vs. big payoff
---
### ⚠️ Risks to watch
* ❌ Small move + IV crush = full premium loss
* 🚀 Big beat → upside squeeze
* 📰 Macro (Fed/inflation data) could override stock move
---
### ✅ Trade Plan
* Enter: **Pre-earnings close (09/09 AMC)**
* Position size: ≤2% portfolio
* Profit scale: +100% / +200% / +300%
* Exit rule: If stop hit OR 2 hrs after open post-earnings
---
🔥 **ORCL = High-quality biz but high expectations. This setup = cheap downside hedge with asymmetric payoff.*

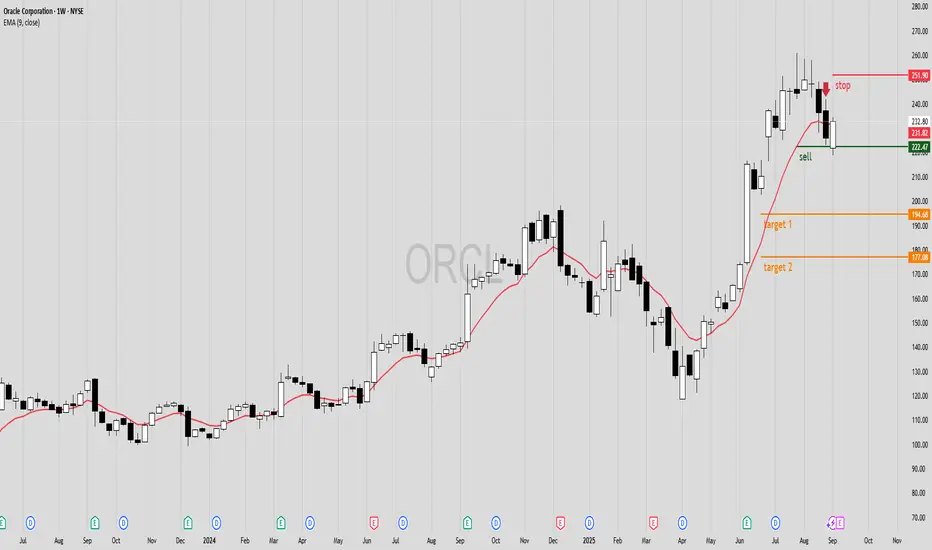
Test sell in ORCL strategy simulator at 222.47Testing a sell in the ORCL simulator at 222.47 with first target at 194.68 and second target at 177.08.
ORCL Weekly Call Setup — $240C Targeting Breakout!
# 🚀 ORCL Weekly Trade Setup (Sep 6, 2025) 🚀
### 🔎 Market Consensus
* **Momentum:** Weekly RSI strong (67.8 ↑), daily RSI improving (47.4).
* **Volume:** 1.5x weekly → institutional activity.
* **Options Flow:** C/P = **1.49** → bullish bias.
* **Volatility:** Low VIX (\~15) → cheap calls.
* **Consensus:** 📈 Moderate Bullish Weekly Bias
---
### 🎯 Trade Plan
* **Instrument:** ORCL
* **Direction:** CALL (LONG)
* **Strike:** 240C
* **Expiry:** 2025-09-12 (6 DTE)
* **Entry Price:** 8.30
* **Profit Target:** 10.40 (+25%) — stretch 12.30–16.40 if momentum holds
* **Stop Loss:** 4.95 (\~-40%)
* **Size:** 1 contract (scale by risk)
* **Entry Timing:** Market Open
* **Exit Rule:** Take profits in strength, exit **by Thu Sep 11** (avoid Friday decay/earnings risk)
* **Confidence:** 🔥 68%
---
### ⚖️ Key Risks
* Earnings risk inside 6-day window → binary volatility.
* High weekly volume could mean **distribution** if no follow-through.
* Theta/gamma crush into late week.
---
### 🧠 Alternative View
* Grok/xAI flags “No Trade” due to binary earnings event risk.
* Conservative traders may stay flat.
---
📊 **TRADE DETAILS (JSON)**
```json
{
"instrument": "ORCL",
"direction": "call",
"strike": 240.0,
"expiry": "2025-09-12",
"confidence": 0.68,
"profit_target": 10.40,
"stop_loss": 4.95,
"size": 1,
"entry_price": 8.30,
"entry_timing": "open",
"signal_publish_time": "2025-09-06 12:07:08 EDT"
}
```
---
🔥 \ NYSE:ORCL | \ AMEX:SPY | \ NASDAQ:QQQ | #OptionsTrading #TradingView #UnusualWhales #SP500 #StocksToWatch #UnusualWhales#GammaSqueeze#OptionsFlow#FlowTrading#WeeklyOptions#CallOptions#StockMarket#TradingView #Bullish#SP500Inclusion#StocksToWatch#MarketMoves#EarningsSeason#MomentumTrading#RiskReward