sxp looking extremely bullish overall consolidating in symmetrical triangle, but recently bounced from bottom of triangle, and cleared multiple hurdles. now expecting rally towards consolidation range descending trendline, then will see price action reaction in that area, and will share further update.

#SXP/USDT moment for try to Buy SXP .
#SXP
The price is moving within a descending channel on the 1-hour frame, adhering well to it, and is heading for a strong breakout and retest.
We have a bearish trend on the RSI indicator that is about to be broken and retested, supporting the upside.
There is a major support area (in green) a
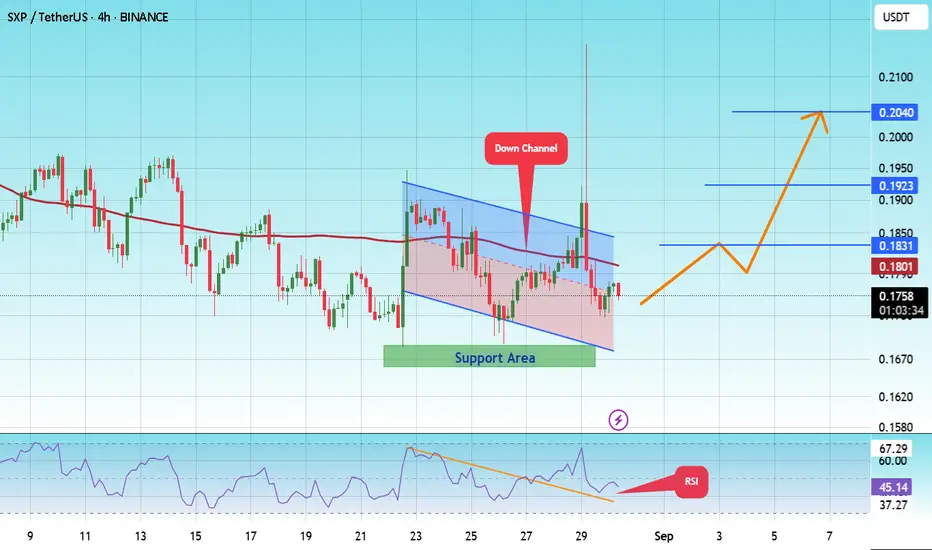
#SXP/USDT moment for try to Buy SXP.#SXP
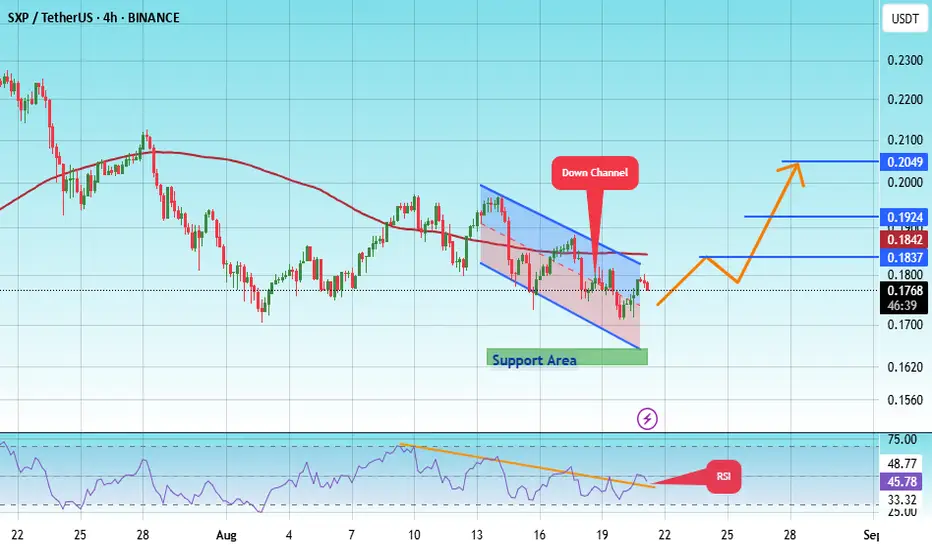
The price is moving within a descending channel on the 1-hour frame, adhering well to it, and is heading for a strong breakout and retest.
We have a bearish trend on the RSI indicator that is about to be broken and retested, supporting the upside.
There is a major support area (in green) at
Sxpusdt Buy opportunitySXPUSDT is showing signs of a potential falling wedge formation, with price breaking above the setup near the $0.3 level to reach a temporary high around $0.6. Following this, the price has begun a pullback, retesting the trendline of the falling wedge. The current bounce indicates a reaction at a m

Good moment for try to Buy SXP.Good moment for try to buy SXP. We are creating new up trend channel and now brake up it. The stop below previous local low. The target ~50% of move. Will see...
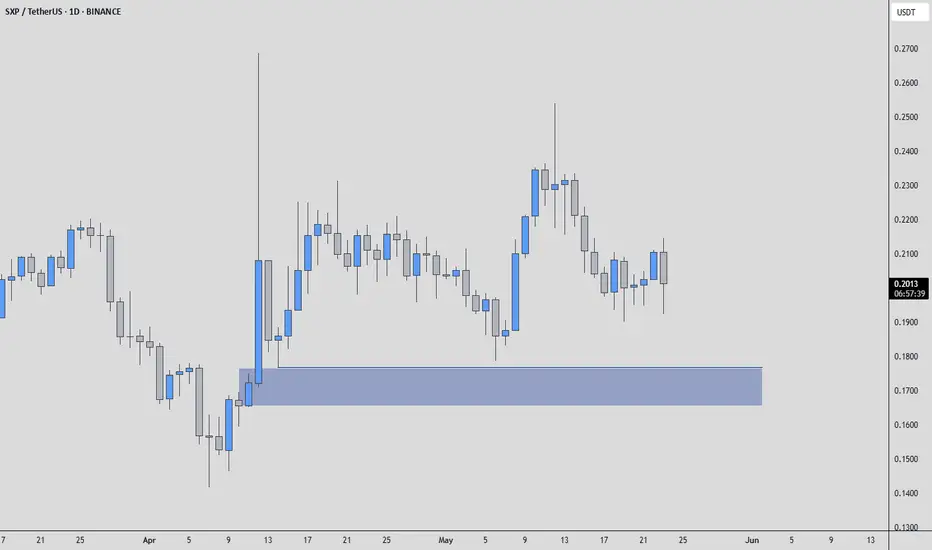
$SXP in falling wedge and retested weekly supportSaw this oldie in my watch list and seems like a good risk-reward setup on weekly chart. Held support, now needs to flip that smaller resistance in the wedge (white line) then break out.
Long term play (swing long)

SXPUSDT UPDATE
Pattern: Falling Wedge Breakout
Current Price: \$0.1836
Target Price: \$0.2470
Target % Gain: 35.20%
Technical Analysis: SXP has broken out of a falling wedge pattern on the 12H chart with a strong bullish candle and volume spike, confirming the breakout. This setup signals potential continuation

#SXP/USDT#SXP
The price is moving within a descending channel on the 1-hour frame, adhering well to it, and is heading for a strong breakout and retest.
We are seeing a rebound from the lower boundary of the descending channel, which is support at 0.1587.
We have a downtrend on the RSI indicator that is ab

SXPUSDT 1W AnalysisSXP ~ 1W Analysis
#SXP This trade is very high risk. Buy if you still have confidence in this coin with a short term target of at least 20%+ from this support.

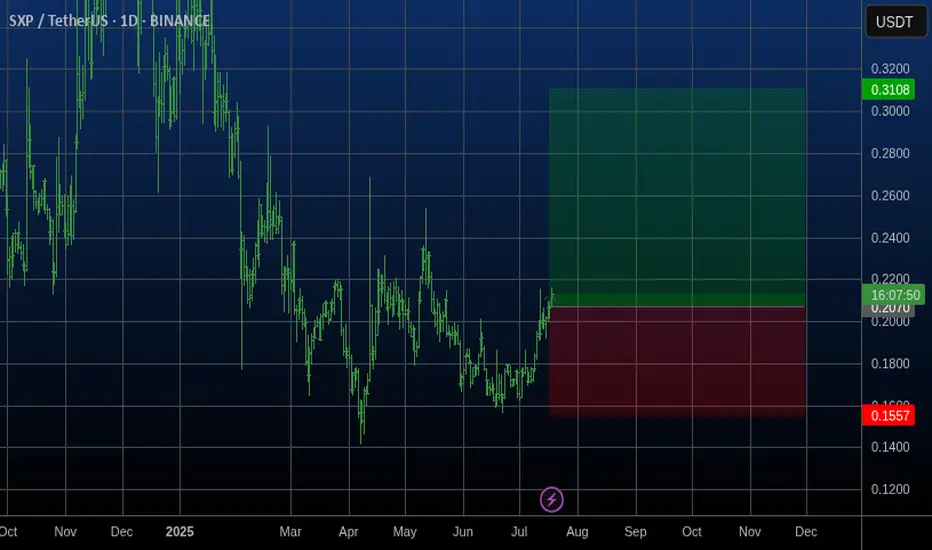
SXPUSDT | Clean Demand Zone BelowSXPUSDT is approaching a blue box that looks like a well-structured demand zone. The last reactions from this area were strong, and it may attract buyers again.
If price revisits that zone with low-timeframe confirmation, I’ll be watching closely. It’s not about predicting, it’s about reacting when
See all ideas
Summarizing what the indicators are suggesting.
Oscillators
Neutral
SellBuy
Strong sellStrong buy
Strong sellSellNeutralBuyStrong buy
Oscillators
Neutral
SellBuy
Strong sellStrong buy
Strong sellSellNeutralBuyStrong buy
Summary
Neutral
SellBuy
Strong sellStrong buy
Strong sellSellNeutralBuyStrong buy
Summary
Neutral
SellBuy
Strong sellStrong buy
Strong sellSellNeutralBuyStrong buy
Summary
Neutral
SellBuy
Strong sellStrong buy
Strong sellSellNeutralBuyStrong buy
Moving Averages
Neutral
SellBuy
Strong sellStrong buy
Strong sellSellNeutralBuyStrong buy
Moving Averages
Neutral
SellBuy
Strong sellStrong buy
Strong sellSellNeutralBuyStrong buy
Displays a symbol's price movements over previous years to identify recurring trends.