SXTUSDT 1D#SXT has broken above the daily SMA50 and is trying to break out above the descending trendline. Keep an eye on it. RSI and MACD are showing bullish momentum. Targets after the breakout are:
🎯 $0.0937
🎯 $0.1016
🎯 $0.1117
🎯 $0.1261
🎯 $0.1445
⚠️ Always remember to use a tight stop-loss and follow pr

Space & Time · Bear vs Bull · Night vs Day · The Moon & The SunHere we have Space and Time (SXT).
Most of the "old" projects bottomed in April or sooner. The newer projects hit bottom in late June, some in July and others even in August. These are important dates.
The 22-June higher low was significant and this pair—SXTUSDT—used this date to cement its bott

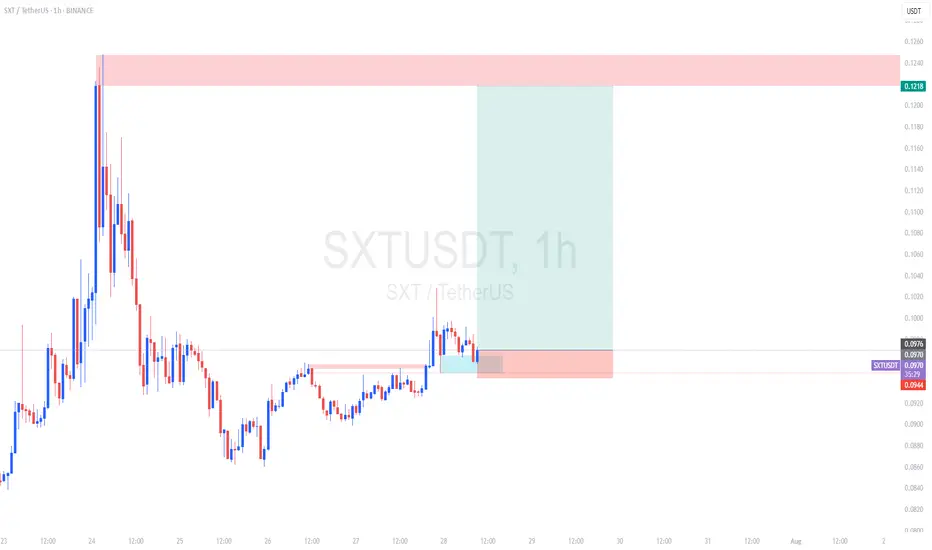
SXT / USDT : Breaking out from Trendline resistanceSXT/USDT is breaking out of its trendline resistance with strong potential. If this breakout sustains with clear confirmation, price could rally toward the $0.09 – $0.10 zone soon.
Best approach: Wait for clear bullish confirmation before entering. Manage risk wisely and trade according to market c

SXTUSDT Forming Descending ChannelSXTUSDT is currently exhibiting a Descending Channel Pattern, a classic bullish reversal signal when spotted in a well-defined downtrend. This pattern suggests a temporary consolidation phase where price consistently makes lower highs and lower lows within a parallel channel. However, as the price a

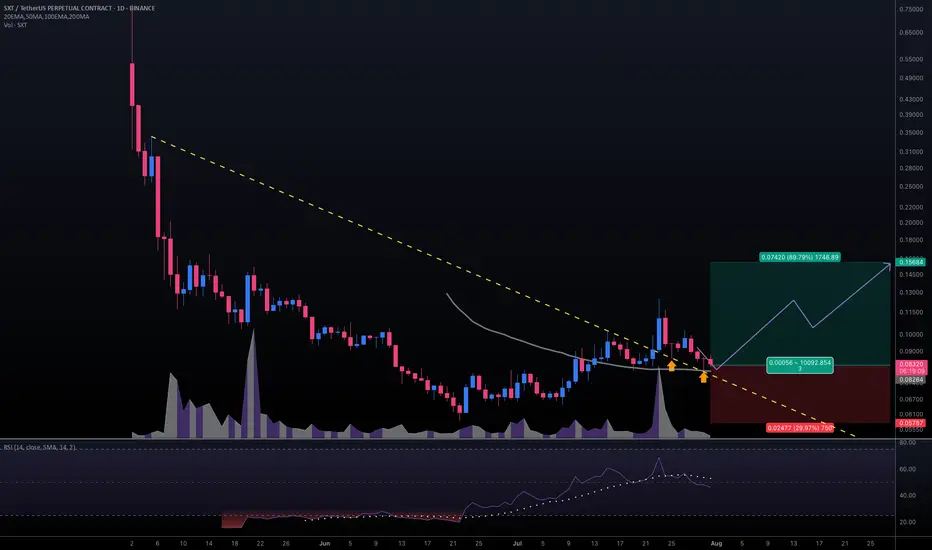
#SXTUSDT #1D (Binance Futures) Descending trendline break retestSpace and Time (SXT) pulled back to 50MA daily support, looks ready for mid-term recovery after those two dragonfly dojis in a row.
⚡️⚡️ #SXT/USDT ⚡️⚡️
Exchanges: Binance Futures
Signal Type: Regular (Long)
Leverage: Isolated (2.0X)
Amount: 5.0%
Entry Targets:
1) 0.08264
Take-Profit Targets:
1) 0
Space and Time: Trading Strategy · 1 BTC = 2.5 BTC (PP: 150%)Are you interested in a double-up?
Let's use round numbers to keep it simple.
Trade: Buy 1 BTC STXUSDT = Get 2.5 BTC (150% profits).
Time duration: 20-40 days.
Risk: Very low (time).
The risk can be calculated in time. Since this is a spot trade, you cannot get liquidated. In the worst case scen

Space and Time Buy Zone: 1,000% or More Profits PotentialWhen the market is no longer bearish we know that something changed. We are going to be looking at the same price pattern we've been looking at on multiple charts.
Space and Time (SXT) was bearish, strongly bearish within a falling wedge pattern. On June 22 the bearish action ceased completely and
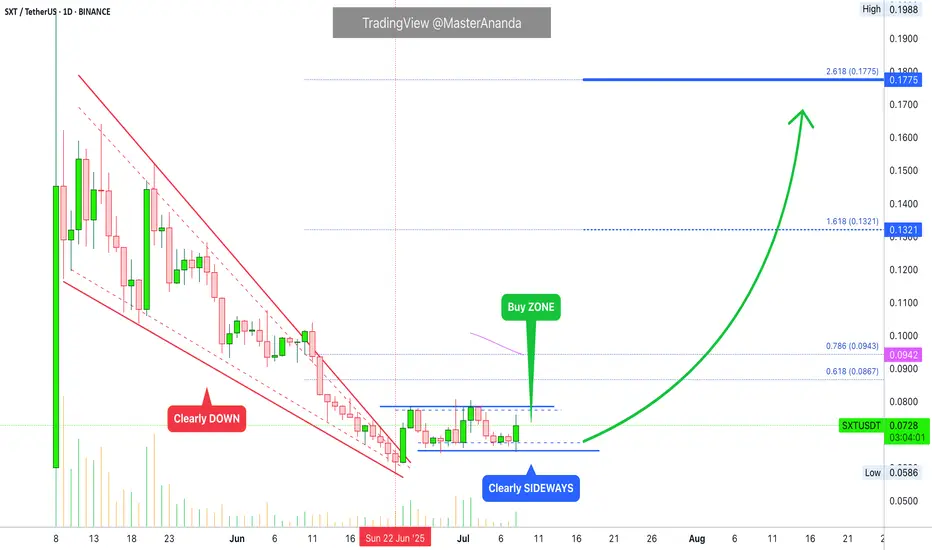
SXT/USDT buy setup SXT, backed by Microsoft, is showing signs of accumulation and gearing up for a potential breakout move toward the key supply zone at $0.15. Momentum is gradually building, and a breakout could trigger a strong rally.
DCA can be considered if price retests lower support levels.

#SXT/USDT#SXT
The price is moving within a descending channel on the 1-hour frame and is expected to break and continue upward.
We have a trend to stabilize above the 100 moving average once again.
We have a downtrend on the RSI indicator, which supports the upward move by breaking it upward.
We have a s

See all ideas
Summarizing what the indicators are suggesting.
Oscillators
Neutral
SellBuy
Strong sellStrong buy
Strong sellSellNeutralBuyStrong buy
Oscillators
Neutral
SellBuy
Strong sellStrong buy
Strong sellSellNeutralBuyStrong buy
Summary
Neutral
SellBuy
Strong sellStrong buy
Strong sellSellNeutralBuyStrong buy
Summary
Neutral
SellBuy
Strong sellStrong buy
Strong sellSellNeutralBuyStrong buy
Summary
Neutral
SellBuy
Strong sellStrong buy
Strong sellSellNeutralBuyStrong buy
Moving Averages
Neutral
SellBuy
Strong sellStrong buy
Strong sellSellNeutralBuyStrong buy
Moving Averages
Neutral
SellBuy
Strong sellStrong buy
Strong sellSellNeutralBuyStrong buy