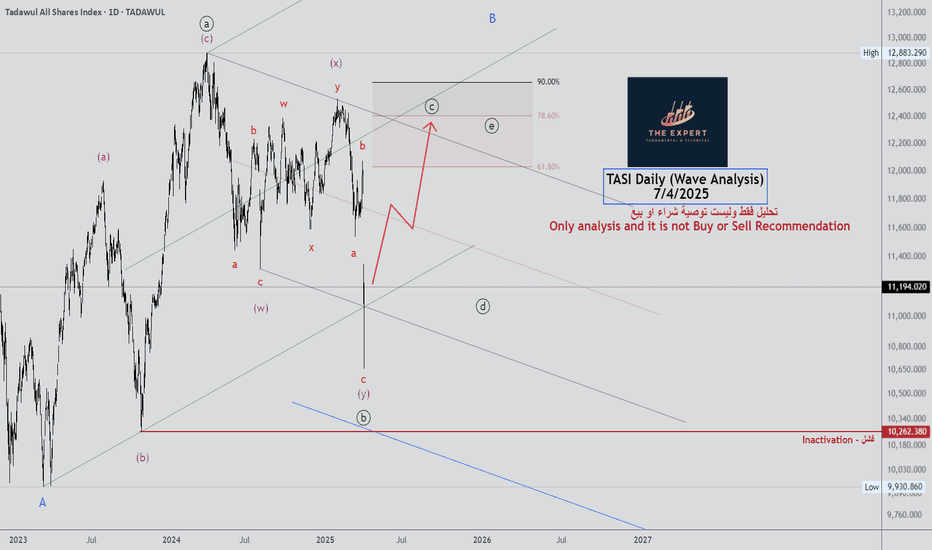
TASI IS STILL FALLING DOWNDear Saudi Traders,
Been a long time since I last posted about saudi market, now I'm back with the lates updates on the markets since I seen some people saying to buy some particular stocks.
First of all TASI is falling down, so there's nothing to do, and it will keep falling for the next following monts, we'll expect it to start rising in the 2nd Q of 2026. But for now there's nothing to make on the market, every position you take will end up in losses.
As you can see on the chart, the price will drop to 10,258.213 at least before reversing to come higher.
So for now hold your funds, and don't buy. Once I see something positive on the market I'll be the first to post about it.
Follow so you won't miss any updates!
Tadawul All Shares Index
No trades
Trade ideas
Levels!TASI Analysis
Closed at 11256.740 (05-11-2025)
10710 - 11110 is a Strong Support Zone that should be sustained.
Chances are there because of a Bullish Divergence on Bigger tf.
Slight Pressure may drag the index down towards 10,700 - 10,800.
However, if this Zone is broken, 7000 - 8700 Zone will be exposed.
Upside Resistance is around 13400 - 14000 which would a Strong
Resistance Zone again; Crossing this Zone may bring TASI again in
Uptrend.
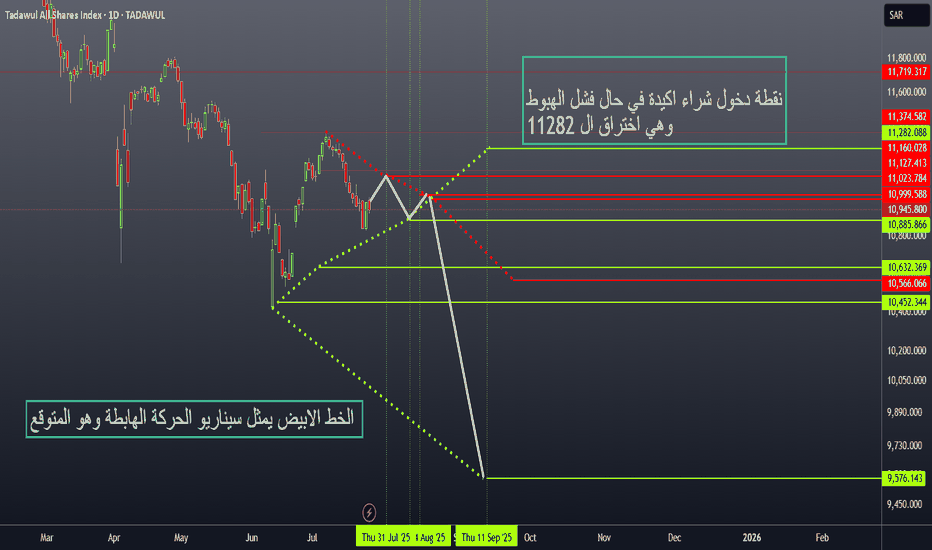
TASI Key Support & Resistance Levels This idea focuses on the Saudi Stock Market (TASI) key support and resistance levels based on time-sequenced price action.
Current support zone is highlighted (Point 1).
Time-based sequence:
🔺 Resistance on July 31 at 11126
🟢 Support on August 11 at 10885
🔺 Resistance on August 14 at 10999 / 10945
🟢 Support on September 1 at 9576
Connecting these points reveals the expected scenario shown in the second chart.
Key level: 11282 (Point 3) – A confirmed breakout above this level signals a strong buy opportunity, as it:
✔ Acts as a major support
✔ Breaks the descending channel
✔ Invalidates the bearish continuation scenario
📈 Watching for a bullish breakout above 11282 to enter long positions.
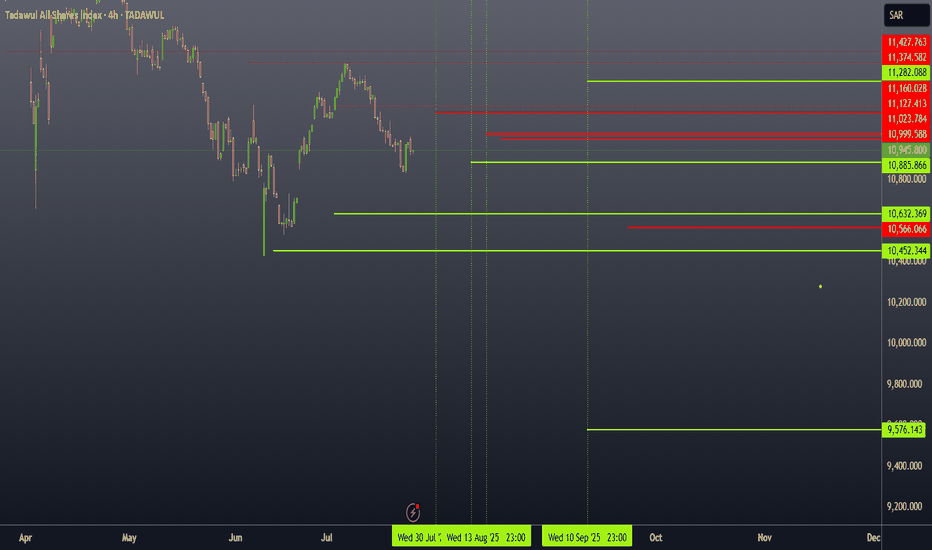
TASI Outlook: No Buy Until 11128 Break — Entry at 11282The Saudi market is currently resting on a support level, but the timing suggests we might see extended sideways movement before any significant trend resumes.
🚫 No buying positions should be considered unless the index breaks above 11128.
✅ A safer entry would be above 11282, confirming bullish momentum.
🔴 Red lines indicate resistance levels.
🟢 Green lines indicate support levels.
#TASI #SaudiStockMarket #TechnicalAnalysis #TradingView #Tadawul #TASIAnalysis
Weekly Buy Plan – TASI📈 Weekly Buy Plan – TASI
Context:
Price has made a deep pullback into a higher timeframe discount zone (highlighted in blue).
A sweep of 2024 low has occurred — clearing out liquidity and triggering a potential reversal.
After the sweep, price showed strong rejection and formed a Weekly Bullish Fair Value Gap (FVG).
A valid bullish Dealing Range has now formed on the weekly timeframe, indicating a strong bullish intent.
🔍 Trade Plan Details (Weekly Dealing Range Confirmation)
✅ 1. Attacking HTF POI
Price reacted from a weekly demand zone (marked in blue), aligned with a swing low from 2024.
✅ 2. Bearish FVG Formed
Before the reversal, price created a short-term bearish FVG — likely trapping sellers.
✅ 3. Bullish FVG Formed
A fresh bullish weekly FVG formed after the rejection from demand zone.
✅ 4. Closed Above Red Candle Series
Price closed above a cluster of bearish candles, showing momentum shift to the upside.
✅ 5. Breaker Block (Support Confirmed)
Previous structure resistance now acts as support, confirming the valid bullish dealing range.
🎯 Target Plan (Context Target)
As per your trade plan, the external swing high at 12,879 (2024 High) is the primary target — aligning with the bullish dealing range.
Is TASI poised to Break its ATHTASI is currently in the 11,000 range, there are historical patterns and fundamental economic drivers that incline towards a potential next rally that could set a new All-Time High.
Key Catalysts
Robust Government Spending
Kingdom's continued robust spending not only on mega-project is a key driver for economic growth
Non-Oil Sector Growth and Diversification
Continued growth in the non-oil sector and the Kingdom's diversification plans are vital for long-term sustainable growth, Kingdom is pouring significant resources into a range of cutting-edge technologies, (AI, Digital Infrastructure and Cloud Computing, Renewal Energy, EVs, Gaming and Entertainment.
Geopolitical Stability
Recent signs of easing geopolitical situation will strengthen investor confidence and lower further risks to market.
Technical Setups and Historical Data
On the charts, TASI shows possible upside trend based on historical and cyclic behavior, sooner breakout above 13000 will lead to all new ATH
TASI, looking for a nose divethe current geo political developments, the Index is looking for a dive towards 10,200- 9800 levels.
anything is possible, but based on the analysis, any push upwards is a desperate last breath before the dive. watch out.
This is not a financial advise at all. just what i see happening in the market.
TASI / Market Update: Bullish Signals Confirmed! 📈 Market Update: Bullish Signals Confirmed! 📈
The market has confirmed a solid bottom, and with God’s will, we won’t see lower lows! Here’s why we’re optimistic:
Strong Green Hammer Candle 🕯️: A clear bullish signal, showing the market’s rejection of further declines with conviction.
Bounce from Key Support 🔼: The rebound from a well-tested support zone reinforces the strength of this move.
Market Indicators Shining 🌟: The average market index is flashing positive signals, indicating robust momentum.
Undervalued Stocks 💎: Most companies are sitting at their lows, presenting attractive opportunities for investors.
🚀 Key Level to Watch: A close above 12,065 points seals the bullish outlook, paving the way for further gains.
TASI Weekly Chart AnalysisFalse breakdown or trapdoor setup?
Saudi market bounces sharply off 200W MA + horizontal support. Classic Stage 3 to 2 retest in action?
•Massive bullish engulfing after shakeout
•Held key support zone near 11,100
•RSI rebounding from oversold territory
•Volume spike = institutional footprint
•Above 11,556? Stage 2 breakout confirmed
•Long-term target: 13,955+
Saudi bulls: Are you ready?
#TASI #Tadawul #SaudiStocks #TechnicalAnalysis #SwingTrading #MiddleEastMarkets #StockMarket
TASI Weekly Chart AnalysisFalse breakdown or trapdoor setup?
Saudi market bounces sharply off 200W MA + horizontal support. Classic Stage 3 to 2 retest in action?
• Massive bullish engulfing after shakeout
• Held key support zone near 11,100
• RSI rebounding from oversold territory
• Volume spike = institutional footprint
• Above 11,556? Stage 2 breakout confirmed
• Long-term target: 13,955+
Saudi bulls: Are you ready?
#TASI #Tadawul #SaudiStocks #TechnicalAnalysis #SwingTrading #MiddleEastMarkets #StockMarket
TASI, Saudi StockHello traders,
The last few days all stocks around the world move fast due to tariff.
Saudi stock is different than others, it looks strong, and it is a fantastic investment.
I see it goes up in the remaining days in april.
Symbol like
8200
1810
2090
2160
4070
4250
6010
8030
8180
8310
Good Luck for all


